SlideShare a Scribd company logo
Carbon Emission Factor for Ukrainian Electricity Grid
Mykola Shlapak
Environment and Energy Consultant, KT-Energy LLC
m.shlapak.ua@gmail.com
Summary
The article provides the results of calculation of carbon emission factor for Ukrainian electricity grid
for the period 2012-2015 using publicly available data. Carbon emission factor for Ukrainian
electricity grid is estimated using operation margin emission factor method in line with the provisions
of the latest versions of the relevant CDM tools. The results provided could be used when calculating
GHG emission reduction for renewable energy (where a project activity supplies electricity to a grid)
and energy efficiency projects (project activity that results in savings of electricity that would have
been provided by the grid.
Introduction
As of the end of 2016, Ukrainian energy system had the capacity of 55 331 MW dominated by
thermal power plants and nuclear power plants.
Pic. 1. Installed capacity of Ukrainian power grid.
Nuclear power plants provide the baseload power and generated 55% of total annual electricity
generation volume in 2015 (88 TWh). Nuclear power plants have the capacity of 13 835 MW: 6
VVER-1000 energy units at Zaporizka NPP, 3 VVER-1000 energy units at Yuzhno-Ukrainska NPP, 2
VVER-1000 energy units at Khmelnytska NPP, 2 VVER-1000e nergy units and VVER-440 energy
units at Rivnenska NPP.
Hydropower plants have the capacity of 6 047 MW, including 7 large scale hydropower plants on
Dnipro and Dnister rivers, 3 hydro pump and storage power plants (HPSP), 3 mid-size hydro power
plants. Hydropower plants partially cover peak power demand during the day.
© Mykola Shlapak, KT-Energy LLC. Contact author: m.shlapak.ua@gmail.com
Version 1.1, dated 12/10/2017
1
The share of renewable energy has grown during recent years, but still renewables cover only up to
7% of electricity generation volume (including up to 6% generated by HPPs and 1% – by other
renewable sources). As of the end of 2016, the capacity of renewable energy plants in the national
electricity system reached 1135 MW, including 439 MW of wind power plants, 458 MW of solar
power plants, 65 MW of biomass power plants, and 174 MW of small hydro power plants.
The share of thermal power plants in overall installed capacity of Ukrainian energy system is more
than 50%, however actual available capacity of TPPs is significantly lower than the designed
capacity, and thus the share of TPPs in current electricity generation is around 35%. Ukraine has 14
thermal power plants, mainly coal fired, with total current installed capacity of 27.8 GW. Zuivska TPP
and Starobesivska TPP are located on the territory occupied by Russian Federation. Ukrainian
thermal power plants were constructed mainly in 1950-1960s and many of the units have worked
more than 250 000 hours. Such long operation time of main equipment led to physical depreciation of
the equipment and higher level of emergency failures. With average efficiency of 31% resulting in 400
grams of coal equivalent (or 11.7 GJ per MWh) consumption per kilowatt hour ratio thermal power
generation contributes a significant part of national GHG emissions.
Previously, carbon emission factor for Ukrainian electricity grid was calculated in several studies to
estimate GHG emission reductions from joint implementation projects.
In 2007, carbon emission factor for Ukrainian electricity grid was developed by Global Carbon B.V.
and verified by TÜV SÜD Industrie Service GmbH.1
The estimation was based on a simple operation
margin emission factor method and data for the years 2003-2005. The resulted carbon emission
factor was 0.807 tonnes CO2 / MWh for power generation (“producing projects”), and 0.896 tonnes
CO2 / MWh for electricity consumption (“reducing projects”).
In 2010 Lahmeyer International prepared the study on the development of the electricity carbon
emission factors for Ukraine for the European Bank for Development and Reconstruction2
. Carbon
emission factors for Ukraine for the period from 2009 to 2020 were calculated using simple adjusted
operation margin emission factor method. The resulted operating margin emission factor starts at
1.052 t CO2/MWh in 2009 and increases slightly in 2011 and 2012 to a maximum of 1.063 t
CO2/MWh. For the period 2013-2017 the operating margin ranges between 1.058-1.059 t CO2/MWh
and than gradually decreases to 0.941 t CO2/MWh in 2020.
In 2011 the National Ecological Investment Agency of Ukraine has approved the methodology for the
calculation of carbon dioxide emission factor for electricity generation by thermal power plants and
emission factor for electricity consumption.3
Based on the approved methodology, which corresponds
to the simple operation margin calculation method, the emission factor was calculated and approved
by the orders of the National Ecological Investment Agency for the years 2008-2011.
Table 1. Emission factors approved by the National Ecological Investment Agency
Emission factor 2008 2009 2010 2011
Emission factor for electricity generation by thermal power
plants, tonnes CO2 per MWh
1.055 1.068 1.067 1.063
Emission factor for electricity consumption, tonnes CO2 per
MWh
1.219 1.237 1.225 1.227
1 https://ji.unfccc.int/UserManagement/FileStorage/46JW2KL36KM0GEMI0PHDTQF6DVI514
2 http://encon.sumdu.edu.ua/doc/methodics/Baseline_Study_Ukraine_Final_English.pdf
3 http://cons.parus.ua/map/doc/07IC44DC43/Pro-zatverdzhennya-Metodiki-rozrakhunku-pitomikh-vikidiv-dvookisu-vugletsyu-pri-virobnitstvi-
elektrichnoyi-energiyi-na-teplovikh-elektrostantsiyakh-ta-pri-yiyi-spozhivann.html
© Mykola Shlapak, KT-Energy LLC. Contact author: m.shlapak.ua@gmail.com
Version 1.1, dated 12/10/2017
2
Methodology
The calculation of emission factor for Ukrainian electricity system is based on the CDM
Methodological tool “Tool to calculate the emission factor for an electricity system”, Version 05.0. This
tool provides methodological guidance to estimate the operation margin (OM), build margin (BM)
and/or combined margin (CM) emission factor for the electricity system.
Electricity export is not subtracted from electricity generation data used for calculating the electricity
emission factors.
Only grid power plants are included in the calculation.
The combined margin emission factor is the result of a weighted average of two emission factors
pertaining to the electricity system: the “operating margin” (OM) and the “build margin” (BM). The
operating margin is the emission factor that refers to the group of existing power plants whose current
electricity generation would be affected by the proposed project activity. The build margin is the
emission factor that refers to the group of prospective power plants whose construction and future
operation would be affected by the proposed project activity.
The calculation of BM emission factor is based on the analysis of most recent additions of the new
capacities to the electricity system. Capacity additions from retrofits of power plants should not be
included in the calculation of the build margin emission factor. Electricity generation of the sample
group of power units used to calculate the build margin should comprise 20% of the annual electricity
generation of the electricity system. The sample group of power units is determined either as the set
of five power units, that started to supply electricity to the grid most recently, or larger set of power
units, started to supply electricity to the grid during last 10 years and annual electricity generation of
which comprises 20% of the annual electricity generation of the electricity system. The power units
that started to supply electricity to the grid more than 10 years ago could also be included in the
sample until the electricity generation of the new set comprises 20 per cent of the annual electricity
generation of the project electricity system.
In Ukraine, however, the electricity system is characterized by significant overcapacity and limited
capacities of new power plants connected to the grid during last 10 years. During 2006-2017, major
capacity additions in the united electricity system of Ukraine were due to construction of renewable
energy power plants (more than 1200 MW of solar, wind, small hydro and biomass power plants),
construction of hydro pump and storage power plants (1123 MW), modernization of thermal power
plants (845 MW), commissioning of new CHPs units and industrial power plants (about 650 MW),
and modernization of hydro power plants (336 MW). Capacity additions from the retrofit of thermal
power and hydro power plants are not taken into account during the calculation of BM emission factor
according to the Methodological Tool. Renewable energy power plants, new CHPs units and
industrial power plants, and hydro pump and storage power plants commissioned during last 10 yers
generate less than 5% of electricity.
To reach 20% of annual electricity generation we should include in the sample power plants
connected to the grid up to 30 years ago, including nuclear power units commissioned in 2004 (2000
MW), 1995 (1000 MW), and even 1989 (1000 MW). Nuclear power units would constitute the major
share of the capacity in the sample. Such sample would not be representative in terms of the
expected technology and fuel mix of the power plants to be constructed in Ukraine. Moreover,
renewable energy and energy efficiency projects are not likely to influence the operation of nuclear
power plants, which provide low-cost base-load electricity supply.
© Mykola Shlapak, KT-Energy LLC. Contact author: m.shlapak.ua@gmail.com
Version 1.1, dated 12/10/2017
3
Therefore, carbon emission factor for Ukrainian electricity grid is calculated based only on the
operation margin emission factor.4
The Methodological Tool provides step-by-step guidance to define the approach to be used for OM
emission factor calculation.
Pic. 2. Overview of the application of OM methods
As only annual data from each power plant on power generation, fuel type and fuel consumption are
available the LCMR share was defined on the first step. Low-cost/must-run (LCMR) resources - are
defined as power plants with low marginal generation costs or dispatched independently of the daily
or seasonal load of the grid. They include hydro, geothermal, wind, low-cost biomass, nuclear and
solar generation. If a fossil fuel plant is dispatched independently of the daily or seasonal load of the
grid and if this can be demonstrated based on the publicly available data, it should be considered as
a low-cost/must-run. Electricity imports shall be treated as one LCMR power plant.
Combined heat and power plants (CHP units) connected to the electricity system of Ukraine are also
considered as low-cost/must-run resources, as they are usually dispatched independently of the daily
or seasonal load to provide heat energy for residential, commercial and public buildings.
In Ukraine LCMR share is higher than 50% and during last 5 years was in the range of 55-65%.
Please refer to Data section for details.
4 Similar approach has been used in “Development of the electricity carbon emission factors for Ukraine.
Baseline study for Ukraine. Final Report” and “Ukraine - Assessment of new calculation of CEF ”. Available at:
http://encon.sumdu.edu.ua/doc/methodics/Baseline_Study_Ukraine_Final_English.pdf and
https://ji.unfccc.int/UserManagement/FileStorage/46JW2KL36KM0GEMI0PHDTQF6DVI514
© Mykola Shlapak, KT-Energy LLC. Contact author: m.shlapak.ua@gmail.com
Version 1.1, dated 12/10/2017
4
The average load of LCMR (average amount of load supplied by low-cost/must-run resources in a
grid) is lower than average lowest annual system loads (LASL) during most recent 3 years (average
load of LCMR is 11604 MW while average LASL is 12150 MW). The average load of LCMR is
defined by dividing total electricity generation by LCMR resources by 8760 hours.
Table 2. LCMR and LASL data
Data 2012 2013 2014 2015 2016
LCMR share 55.9% 55.0% 57.9% 64.3% 65.5%
Average load of LCMR 12642 12152 12017 11614 11182
Lowest annual system load (LASL) N/D N/D 13158 11989 11302
Average load of LCMR is less than
LASL?
N/D N/D Yes Yes Yes
Therefore, the simple operation margin will be used for the estimation of the emission factor for
Ukrainian electricity system.
According to the Methodological tool the simple OM emission factor is calculated as the generation-
weighted average CO2 emissions per unit net electricity generation (t CO2 /MWh) of all generating
power plants serving the system, not including low-cost/must-run power plants/units.
The simple OM has been calculated using Option A proposed the Methodological tool, which is
calculation based on the net electricity generation and a CO2 emission factor of each power unit
(Equation 3 of the Methodological tool).
CO2 emission factor of each thermal power plant in year y (t CO2 /MWh) was calculated using option
A.1 of the Methodological Tool using the data on fuel consumption and electricity generation for each
power plant (using equation 4 of the Methodological Tool).
© Mykola Shlapak, KT-Energy LLC. Contact author: m.shlapak.ua@gmail.com
Version 1.1, dated 12/10/2017
5
In case of industrial power plants, where only data on electricity generation is available, an emission
factor of 0 t CO2 / MWh has been assumed as a simple and conservative approach (Option A3 of the
Methodological Tool).
CO2 emission factor to estimate the baseline, project and/or leakage emissions associated with the
consumption of electricity (CO2 emissions from the combustion of fossil fuels at power plants
connected physically to the national electricity system) was calculated based on the provisions of the
CDM Methodological tool “Baseline, project and/or leakage emissions from electricity consumption
and monitoring of electricity generation”, Version 03.0.
Following the generic approach, project, baseline and/or leakage emissions from consumption of
electricity are calculated based on the quantity of electricity consumed, an emission factor for
electricity generation and a factor to account for transmission losses (equations 1, 2, 3 of the CDM
Methodological tool “Baseline, project and/or leakage emissions from electricity consumption and
monitoring of electricity generation”, Version 03.0).
Emission factor for consumption of electricity is thus can be calculated as follows:
EFelectricity=EFEF , j,l×(1+TDLj, y )
where:
EFelectricity – is the CO2 emission factor to estimate the baseline, project and/or leakage emissions
associated with the consumption of electricity;
EF EF, j, i – is the CO2 emission factor for electricity generation;
TDL j, y – is the transmission and distribution losses value for the grid during year y.
Average technical transmission and distribution losses in the united energy system of Ukraine was
used to calculate a factor to account for transmission losses (TDL).
© Mykola Shlapak, KT-Energy LLC. Contact author: m.shlapak.ua@gmail.com
Version 1.1, dated 12/10/2017
6
Data
Data on power generation volumes by different types of power plants were derived from the statistical
data of the Ministry of Energy and Coal Industry of Ukraine. The structuring of the data has been
slightly changed to ensure consistency with the structuring principle of the National GHG Inventory. In
particular power generation by Myronivska TPP has been counted in the group of thermal power
plants, and excluded from power generation by CHP units. Data on electricity generation by Zuivska
TPP and Starobesivska TPP for 2015 and 2016 are not included in the official statistics of the
Ministry of Energy and Coal Industry of Ukraine. National GHG inventory report for the period 1990-
2015 includes data on fuel consumption by Zuivska TPP and Starobesivska TPP and associated
GHG emissions. For the year 2015 electricity generation by Zuivska TPP and Starobesivska TPP as
reported by TPPs operators were included in the total electricity generation volumes to ensure
consistency with the National GHG Inventory.
Table 3. Electricity generation in Ukraine during 2012-2015 in GWh
Generation Type 2012 2013 2014 2015
Hydro 10832.6 14215.2 9092.5 6777.9
Other renewables (excl. hydro), incl.: 617.6 1247.0 1664.5 1577.4
Wind 284.0 N/A 1128.7 978.7
Solar 333.6 N/A 432.1 464.6
Biomass 0.0 N/A 103.7 134.1
Nuclear 90137.4 83209.4 88389.1 87627.5
CHPs 9156.0 7781.7 6123.9 5757.7
Total Low-cost/must-run (LCMR) resources 110743.6 106453.3 105270.0 101740.5
Termal power plants generation
(incl. Myronivska TPP)
79401.5 78797.8 68884.5 54745.0
Industrial power plants generation (block
stations)
7974.2 8312.3 7790.2 1773.0
Total not low-cost / must-run (LCMR)
resources
87375.7 87110.1 76674.7 56518.0
Total electricity generation, GWh 198119.3 193563.4 181944.7 158258.6
The calculation of OM emission factor has been performed using publicly available data, in particular:
• data on total and net electricity generation volumes by 15 thermal power plants, which are
provided by TPP operators in annual reports as well as in open data sets of the Ministry of
Energy and Coal Industry of Ukraine;
• data on coal consumption by each of 15 thermal power plants, which are provided in most
recent Ukraine’s GHG inventory;5
• data on fuels characteristics provided in most recent Ukraine’s GHG inventory: NCV, carbon
content and oxidation factor for coal; NCV, carbon content and density for natural gas; NCV
and carbon content for heavy oil fuels; oxidation factor for natural gas and heavy oil fuels is
assumed to be equal 1.6
The following data gaps have been identified during the calculation of OM emission factor:
5 UKRAINE’S GREENHOUSE GAS INVENTORY 1990-2015. Annual National Inventory Report for
Submission under the United Nations Framework Convention on Climate Change and the Kyoto Protocol,
section A.2.11.2
6 Same as above.
© Mykola Shlapak, KT-Energy LLC. Contact author: m.shlapak.ua@gmail.com
Version 1.1, dated 12/10/2017
7
• no public data on natural gas consumption and heavy oil fuels consumption by each thermal
power plants were identified; the data were estimated based on total consumption of fuel by
each thermal power plant7
, fuel structure data for the years 2010-20128
or later periods where
available, as well as the share of each thermal power plant in electricity generation; such an
approach could lead to errors in the figures of particular fuel consumption by specific power
plants, but the errors will not have material effect on the results of carbon emission factor
calculation due to the low share of natural gas and heavy oil fuels in the fuel mix (less than 2%
on average);
• no public data on net electricity supply to the grid were identified for Centrenergo’s TPPs for
the years 2013-2015, Myronivska TPP for the year 2012 and industrial power plants; the data
were estimated based on the information about total electricity generation and the average
rate of electricity consumption for own needs during the period 2009-2012 in case of
Centrenergo’s TPPs and during the period 2013-2015 in case of Myronivska TPP; for
industrial power plants electricity consumption for own needs were assumed to be equal 10%.
Filling these data gaps by extending the open data sets from the Ministry of Energy and Coal Industry
of Ukraine will improve the accuracy of the calculations and ensure full correspondence with the
provisions of the Methodological Tool.
Data used in the calculation of OM emission factor is provided in Annex 1.
Results
The results of the calculation of the carbon dioxide emission factor for each thermal power plant are
provided in Table 2.
Table 4. Carbon dioxide emission factor for each thermal power plant
Thermal power plants Coal type 2010 2011 2012 2013 2014 2015
Kryvorizka TPP Т 1.058 1.051 1.068 1.077 1.086 1.196
Prydniprovska TPP А+Т 1.196 1.198 1.193 1.217 1.209 1.329
Zaporizka TPP Г+Д 0.914 0.897 0.982 0.971 0.969 0.967
Zuivska TPP Г+Д 0.893 0.882 0.980 0.972 0.997 1.014
Luganska TPP А+Т 1.214 1.204 1.231 1.231 1.215 1.291
Kurakhivska TPP Г+Д 1.091 1.052 1.064 1.044 1.053 1.078
Burshtyn TPP Г+Д 1.091 1.091 1.077 1.071 1.077 1.083
Dobrotvirska TPP Г+Д+Ж 1.113 1.110 1.076 1.124 1.116 1.110
Ladyzhyn TPP Г+Д 1.038 1.030 1.056 1.070 1.091 1.120
Starobeshivska TPP А+Т 1.180 1.199 1.203 1.208 1.188 1.164
Slovianska TPP А+Т 1.242 1.214 1.220 1.240 1.259 1.197
Vuglegirska TPP Г+Д 1.018 1.012 0.985 1.000 1.005 1.019
Trypilska TPP А+Т 1.152 1.154 1.141 1.151 1.081 1.142
Zmiivska TPP А+Т 1.165 1.142 1.150 1.158 1.134 1.174
Myronivska А+Т / Г+Д 1.637 1.675 1.660 1.581 1.573 1.628
7 As provided in UKRAINE’S GREENHOUSE GAS INVENTORY 1990-2015, section A.2.11.2
8 As provided in Перспективи впровадження чистих вугільних технологій в енергетику України/ [Вольчин І.
А., Дунаєвська Н. І., Гапонич Л. С., Чернявський М. В., Топал О. І., Засядько Я. І.]. –К.:ГНОЗІС,2013.–308с.
© Mykola Shlapak, KT-Energy LLC. Contact author: m.shlapak.ua@gmail.com
Version 1.1, dated 12/10/2017
8
The simple OM emission factor for Ukrainian electricity grid was calculated as the generation-
weighted average CO2 emissions per unit net electricity generation (t CO2 /MWh) of all thermal power
plants serving the united energy system of Ukraine and taking into account electricity generation by
industrial power plants, which are also part of non-LCMR resources.
CO2 emission factor for electricity generation by thermal power plants (weighted average CO2
emissions per unit net electricity generation of all thermal power plants serving the united energy
system of Ukraine not taking into account electricity generation by industrial power plants) provided in
the table below for illustrative purposes.
CO2 emission factor to estimate the emissions associated with the consumption of electricity has
been calculated based on both CO2 emission factor for electricity generation by thermal power
plants and CO2 emission factor for Ukrainian electricity grid. The more conservative lower value is
recommended to be used for the estimation of emission reduction for energy efficiency projects.
Table 5. Emission factors for electricity generation and consumption
Parameter 2012 2013 2014 2015
CO2 emission factor for electricity generation by thermal
power plants, tonne CO2 per MWh
1.101 1.103 1.097 1.105
CO2 emission factor for Ukrainian electricity grid, tonne
CO2 per MWh
1.001 0.999 0.986 1.071
CO2 emission factor to estimate the baseline, project
and/or leakage emissions associated with the consumption
of electricity (based on CO2 emission factor for electricity
generation by thermal power plants), tonne CO2 per MWh
1.231 1.229 1.219 1.234
CO2 emission factor to estimate the baseline, project
and/or leakage emissions associated with the consumption
of electricity (CO2 emission factor for Ukrainian electricity
grid), tonne CO2 per MWh
1.120 1.113 1.096 1.195
Conclusions
Due to the large share of mainly coal fired thermal power plants in the installed capacity, the national
electricity grid of Ukraine has high carbon intensity. CO2 emission factor for Ukrainian electricity grid
estimated based on the publicly available data ranges between 0.986 and 1.071 tonne CO2 per
MWh during the period 2012-2015. High transmission losses lead to even greater CO2 emission
factor associated with the consumption of electricity ranging between 1.096 and 1.195 tonne CO2
per MWh. High carbon intensity leads to significant GHG emissions in the energy sector, but
simultaneously provides opportunities for carbon emission reduction by energy efficiency and
renewable energy projects.
© Mykola Shlapak, KT-Energy LLC. Contact author: m.shlapak.ua@gmail.com
Version 1.1, dated 12/10/2017
9
Annex 1. Data used in the calculation of OM emission factor
Data on coal consumption by thermal power plants (1000 tonnes)
Thermal power plants Coal type 2012 2013 2014 2015
Kryvorizka TPP Т 3747 3236 3023 1241
Prydniprovska TPP А+Т 1986 1943 1907 794
Zaporizka TPP Г+Д 2165 2605 2482 2656
Zuivska TPP Г+Д 2629 3119 2087 1560
Luganska TPP А+Т 2747 2345 2128 1267
Kurakhivska TPP Г+Д 3424 3785 3303 3368
Burshtyn TPP Г+Д 4700 4748 4895 4845
Dobrotvirska TPP Г+Д+Ж 1139 972 912 1158
Ladyzhyn TPP Г+Д 2252 2823 2706 2746
Starobeshivska TPP А+Т 3035 3739 2721 2107
Slovianska TPP А+Т 1346 1159 575 1075
Vuglegirska TPP Г+Д 2596 1016 1608 2002
Trypilska TPP А+Т 2564 2148 1803 1311
Zmiivska TPP А+Т 3139 3213 2382 552
Myronivska А+Т 192 179 147 125
Myronivska Г+Д 166 164 135 80
Data source: calculated following the approach provided in Ukraine’s greenhouse gases inventory
1990-2015, section A.2.11.2
Data on fuel NCV (GJ per tonnes or GJ per 1000 m3
)
Thermal power plants Coal type 2012 2013 2014 2015
Kryvorizka TPP Т 24.35 24.15 24.28 23.35
Prydniprovska TPP А+Т 22.56 23.09 23.31 22.32
Zaporizka TPP Г+Д 21.08 22.14 21.31 21.11
Zuivska TPP Г+Д 19.22 20.22 20.34 20.73
Luganska TPP А+Т 24.43 25.02 24.94 23.17
Kurakhivska TPP Г+Д 17.67 18.87 17.93 17.94
Burshtyn TPP Г+Д 21.33 21.56 21.31 20.76
Dobrotvirska TPP Г+Д+Ж 22.44 22.46 21.99 20.81
Ladyzhyn TPP Г+Д 20.73 21.31 20.39 20.40
Starobeshivska TPP А+Т 22.55 22.01 23.17 23.14
Slovianska TPP А+Т 22.63 22.84 23.37 23.60
Vuglegirska TPP Г+Д 22.57 22.51 22.71 22.39
Trypilska TPP А+Т 22.82 22.91 22.23 23.35
Zmiivska TPP А+Т 23.03 23.00 22.08 23.53
Myronivska А+Т / Г+Д 20.57 20.62 20.84 22.64
Myronivska Т 18.56 18.77 18.51 19.00
Natural Gas 34.10 34.14 33.93 34.82
Heavy oil fuel 40.15 40.15 40.13 40.18
Data source: Ukraine’s greenhouse gases inventory 1990-2015
© Mykola Shlapak, KT-Energy LLC. Contact author: m.shlapak.ua@gmail.com
Version 1.1, dated 12/10/2017
10
Data on fuels’ CO2 emission factor (tonne CO2 per TJ)
Thermal power plants Coal type 2012 2013 2014 2015
Kryvorizka TPP Т 95.45 94.96 93.65 92.87
Prydniprovska TPP А+Т 92.61 93.08 92.87 93.76
Zaporizka TPP Г+Д 92.49 92.94 93.78 92.38
Zuivska TPP Г+Д 93.86 93.62 93.59 92.78
Luganska TPP А+Т 98.43 98.85 97.88 97.74
Kurakhivska TPP Г+Д 92.76 91.78 93.55 93.26
Burshtyn TPP Г+Д 91.70 92.57 92.84 93.09
Dobrotvirska TPP Г+Д+Ж 88.90 90.26 91.63 91.95
Ladyzhyn TPP Г+Д 94.75 96.38 96.50 95.44
Starobeshivska TPP А+Т 98.85 99.52 98.25 96.71
Slovianska TPP А+Т 98.40 99.61 99.92 98.25
Vuglegirska TPP Г+Д 90.50 91.48 91.96 91.76
Trypilska TPP А+Т 95.96 96.81 95.81 95.31
Zmiivska TPP А+Т 97.76 98.12 95.44 95.15
Myronivska А+Т / Г+Д 98.87 98.98 98.40 98.80
Myronivska Т 91.08 91.98 92.67 93.40
Natural Gas 55.51 55.62 55.44 55.78
Heavy oil fuel 77.37 77.37 77.37 77.37
Data source: calculated using carbon content and oxidation factor data provided in Ukraine’s
greenhouse gases inventory 1990-2015 and the molecular mass ratio of CO2 / C (44/12).
Data on net electricity generation (GWh)
Thermal power plants Coal type 2012 2013 2014 2015
Kryvorizka TPP Т 8210.4 6934.5 6380.7 2279.7
Prydniprovska TPP А+Т 3629.0 3544.6 3525.8 1266.1
Zaporizka TPP Г+Д 4330.7 5548.1 5142.3 5442.4
Zuivska TPP Г+Д 4875.3 6100.3 4004.3 3005.0
Luganska TPP А+Т 5428.2 4767.4 4293.0 2250.8
Kurakhivska TPP Г+Д 5370.8 6388.5 5347.6 5303.2
Burshtyn TPP Г+Д 8691.3 8974.7 9073.0 8771.3
Dobrotvirska TPP Г+Д+Ж 2121.9 1759.0 1654.9 2024.7
Ladyzhyn TPP Г+Д 4215.9 5452.6 4918.5 4839.7
Starobeshivska TPP А+Т 5710.6 6864.5 5272.0 4106.0
Slovianska TPP А+Т 2468.0 2141.4 1084.0 2110.0
Vuglegirska TPP Г+Д 5410.8 2108.7 3357.4 4098.4
Trypilska TPP А+Т 4961.9 4159.9 3584.6 2589.1
Zmiivska TPP А+Т 6287.1 6364.9 4518.3 1066.5
Myronivska А+Т / Г+Д 406.9 413.0 340.0 260.8
Total 72118.8 71522.1 62496.4 49413.7
Data source: annual reports of TPP operators; cells marked grain contain estimated values (see
Data section for the explanation).
© Mykola Shlapak, KT-Energy LLC. Contact author: m.shlapak.ua@gmail.com
Version 1.1, dated 12/10/2017
11
Data on transmission losses
Data 2012 2013 2014 2015
Electricity supply, GWh 180880 176331 165975 146358.6
Total technological electricity losses
during transmission and distribution
(0.38-800 kV), GWh
21380 20145 18555 16980
Total technological electricity losses
during transmission and distribution
(0.38-800 kV), %
11.82% 11.41% 11.17% 11.60%
Data source: annual reports of the National Commission on Energy Sector and Utilities Regulation
-----
Document Revision History
Date Version Changes
11/10/2017 Version 1.0 Initial publication
12/10/2017 Version 1.1 Information on previous studies on carbon emission factors
for Ukrainian electricity grid and official carbon emission
factors for electricity generation by thermal power plants
approved by the National Ecological Investment Agency has
been added in section “Introduction” (p. 2).
Editorial changes.
© Mykola Shlapak, KT-Energy LLC. Contact author: m.shlapak.ua@gmail.com
Version 1.1, dated 12/10/2017
12

More Related Content

What's hot

Guidance on calculating greenhouse gas (GHG) emissions.
Guidance on calculating greenhouse gas (GHG) emissions.Guidance on calculating greenhouse gas (GHG) emissions.
Guidance on calculating greenhouse gas (GHG) emissions.
Medi Ambient. Generalitat de Catalunya
 
Power sector in argentina
Power sector in argentinaPower sector in argentina
Power sector in argentina
Machiraju Presentations Pvt. Ltd.
 
India’s energy scenario in 2015 Nitish Sharma (Renewable Sources, Non - ren...
India’s energy scenario in 2015   Nitish Sharma (Renewable Sources, Non - ren...India’s energy scenario in 2015   Nitish Sharma (Renewable Sources, Non - ren...
India’s energy scenario in 2015 Nitish Sharma (Renewable Sources, Non - ren...
Nitish Sharma
 
Mitigation of Climate Change
 Mitigation of Climate Change Mitigation of Climate Change
Mitigation of Climate Change
ipcc-media
 
Plastics and global warming
Plastics and global warmingPlastics and global warming
Plastics and global warming
Pratima Pandey
 
Clean development mechanism basics
Clean development mechanism basicsClean development mechanism basics
Clean development mechanism basics
Zolt Energy
 
World Energy Outlook Special Report on Energy and Climate Change
World Energy Outlook Special Report on  Energy and Climate Change World Energy Outlook Special Report on  Energy and Climate Change
World Energy Outlook Special Report on Energy and Climate Change
International Energy Agency
 
Climate Change and Energy
Climate Change and EnergyClimate Change and Energy
Energy production & consumption
Energy production & consumptionEnergy production & consumption
Energy production & consumptioncdenef
 
Energy efficiency
Energy efficiencyEnergy efficiency
Energy efficiency
Priya Chaudhary
 
Introduction to Climate Science
Introduction to Climate ScienceIntroduction to Climate Science
Introduction to Climate Science
ipcc-media
 
How much energy goes into making a loaf of bread?y_en
How much energy goes into making a loaf of bread?y_enHow much energy goes into making a loaf of bread?y_en
How much energy goes into making a loaf of bread?y_en
EnergyEfficiencyplat
 
Sustainable and non sustainable energy
Sustainable and non sustainable energySustainable and non sustainable energy
Sustainable and non sustainable energy
Saad Farooqi
 
Decarbonization of industry - impact on energy
Decarbonization of industry - impact on energyDecarbonization of industry - impact on energy
Decarbonization of industry - impact on energy
Big Data Value Association
 
4 3.3 comparison of energy resources
4 3.3 comparison of energy resources4 3.3 comparison of energy resources
4 3.3 comparison of energy resources
GURU CHARAN KUMAR
 
Comparison of Solar-Wind Hybrid Policies-07.02.2019
Comparison of Solar-Wind Hybrid Policies-07.02.2019Comparison of Solar-Wind Hybrid Policies-07.02.2019
Comparison of Solar-Wind Hybrid Policies-07.02.2019
Gensol Engineering Limited
 
Clean Development Mechanism
Clean Development MechanismClean Development Mechanism
Clean Development Mechanism
Nayan Bhatia
 
Atmospheric pollution
Atmospheric pollutionAtmospheric pollution
Atmospheric pollution
Rik Viana
 

What's hot (20)

Guidance on calculating greenhouse gas (GHG) emissions.
Guidance on calculating greenhouse gas (GHG) emissions.Guidance on calculating greenhouse gas (GHG) emissions.
Guidance on calculating greenhouse gas (GHG) emissions.
 
Power sector in argentina
Power sector in argentinaPower sector in argentina
Power sector in argentina
 
India’s energy scenario in 2015 Nitish Sharma (Renewable Sources, Non - ren...
India’s energy scenario in 2015   Nitish Sharma (Renewable Sources, Non - ren...India’s energy scenario in 2015   Nitish Sharma (Renewable Sources, Non - ren...
India’s energy scenario in 2015 Nitish Sharma (Renewable Sources, Non - ren...
 
Mitigation of Climate Change
 Mitigation of Climate Change Mitigation of Climate Change
Mitigation of Climate Change
 
Plastics and global warming
Plastics and global warmingPlastics and global warming
Plastics and global warming
 
Clean development mechanism basics
Clean development mechanism basicsClean development mechanism basics
Clean development mechanism basics
 
World Energy Outlook Special Report on Energy and Climate Change
World Energy Outlook Special Report on  Energy and Climate Change World Energy Outlook Special Report on  Energy and Climate Change
World Energy Outlook Special Report on Energy and Climate Change
 
Climate Change and Energy
Climate Change and EnergyClimate Change and Energy
Climate Change and Energy
 
Sources of energy.
Sources of energy.Sources of energy.
Sources of energy.
 
Energy production & consumption
Energy production & consumptionEnergy production & consumption
Energy production & consumption
 
Energy efficiency
Energy efficiencyEnergy efficiency
Energy efficiency
 
Introduction to Climate Science
Introduction to Climate ScienceIntroduction to Climate Science
Introduction to Climate Science
 
How much energy goes into making a loaf of bread?y_en
How much energy goes into making a loaf of bread?y_enHow much energy goes into making a loaf of bread?y_en
How much energy goes into making a loaf of bread?y_en
 
Sustainable and non sustainable energy
Sustainable and non sustainable energySustainable and non sustainable energy
Sustainable and non sustainable energy
 
Decarbonization of industry - impact on energy
Decarbonization of industry - impact on energyDecarbonization of industry - impact on energy
Decarbonization of industry - impact on energy
 
4 3.3 comparison of energy resources
4 3.3 comparison of energy resources4 3.3 comparison of energy resources
4 3.3 comparison of energy resources
 
Comparison of Solar-Wind Hybrid Policies-07.02.2019
Comparison of Solar-Wind Hybrid Policies-07.02.2019Comparison of Solar-Wind Hybrid Policies-07.02.2019
Comparison of Solar-Wind Hybrid Policies-07.02.2019
 
energy sources
energy sourcesenergy sources
energy sources
 
Clean Development Mechanism
Clean Development MechanismClean Development Mechanism
Clean Development Mechanism
 
Atmospheric pollution
Atmospheric pollutionAtmospheric pollution
Atmospheric pollution
 

Similar to Carbon Emission Factor for Ukrainian Electricity Grid

POWER GRID BALANCING BY BIOMASS CHPs IN UKRAINE
POWER GRID BALANCING  BY BIOMASS CHPs IN UKRAINEPOWER GRID BALANCING  BY BIOMASS CHPs IN UKRAINE
POWER GRID BALANCING BY BIOMASS CHPs IN UKRAINE
SofiiaLevinska
 
Electric vehicles as the future of personal transportation?
Electric vehicles as the future of personal transportation?Electric vehicles as the future of personal transportation?
Electric vehicles as the future of personal transportation?
benboycott
 
FEASIBILITY STUDY OF ORKNEY’S WINDFARM DEVELOPMENT FOR SELF-SUFFICIENT FOR ...
FEASIBILITY STUDY OF ORKNEY’S WINDFARM  DEVELOPMENT FOR SELF-SUFFICIENT FOR  ...FEASIBILITY STUDY OF ORKNEY’S WINDFARM  DEVELOPMENT FOR SELF-SUFFICIENT FOR  ...
FEASIBILITY STUDY OF ORKNEY’S WINDFARM DEVELOPMENT FOR SELF-SUFFICIENT FOR ...
AEIJjournal2
 
FEASIBILITY STUDY OF ORKNEY’S WINDFARM DEVELOPMENT FOR SELF-SUFFICIENT FOR EN...
FEASIBILITY STUDY OF ORKNEY’S WINDFARM DEVELOPMENT FOR SELF-SUFFICIENT FOR EN...FEASIBILITY STUDY OF ORKNEY’S WINDFARM DEVELOPMENT FOR SELF-SUFFICIENT FOR EN...
FEASIBILITY STUDY OF ORKNEY’S WINDFARM DEVELOPMENT FOR SELF-SUFFICIENT FOR EN...
aeijjournal
 
FEASIBILITY STUDY OF ORKNEY’S WINDFARM DEVELOPMENT FOR SELF-SUFFICIENT FOR EN...
FEASIBILITY STUDY OF ORKNEY’S WINDFARM DEVELOPMENT FOR SELF-SUFFICIENT FOR EN...FEASIBILITY STUDY OF ORKNEY’S WINDFARM DEVELOPMENT FOR SELF-SUFFICIENT FOR EN...
FEASIBILITY STUDY OF ORKNEY’S WINDFARM DEVELOPMENT FOR SELF-SUFFICIENT FOR EN...
AEIJjournal2
 
Involvement of solar and wind power plants in the capacity coverage of the In...
Involvement of solar and wind power plants in the capacity coverage of the In...Involvement of solar and wind power plants in the capacity coverage of the In...
Involvement of solar and wind power plants in the capacity coverage of the In...
НЕК Укренерго - NPC Ukrenergo
 
Global electricity network – Feasibility study
Global electricity network – Feasibility studyGlobal electricity network – Feasibility study
Global electricity network – Feasibility study
Power System Operation
 
Invest in Ukraine: Renewable Energy Sector
Invest in Ukraine: Renewable Energy SectorInvest in Ukraine: Renewable Energy Sector
Invest in Ukraine: Renewable Energy Sector
OfficeNIC
 
Energy Management through Bio-gas Based Electricity Generation System during ...
Energy Management through Bio-gas Based Electricity Generation System during ...Energy Management through Bio-gas Based Electricity Generation System during ...
Energy Management through Bio-gas Based Electricity Generation System during ...
TELKOMNIKA JOURNAL
 
Environmental Profiles for Motors and Transformers
Environmental Profiles for Motors and TransformersEnvironmental Profiles for Motors and Transformers
Environmental Profiles for Motors and Transformers
Leonardo ENERGY
 
Analysis of Modelling and Engineering Building Power Integration System Based...
Analysis of Modelling and Engineering Building Power Integration System Based...Analysis of Modelling and Engineering Building Power Integration System Based...
Analysis of Modelling and Engineering Building Power Integration System Based...
SyamsirAbduh2
 
Waste heat recovery dynamics an analogy of electricity generation & emiss...
Waste heat recovery dynamics an analogy of electricity generation & emiss...Waste heat recovery dynamics an analogy of electricity generation & emiss...
Waste heat recovery dynamics an analogy of electricity generation & emiss...
Arya Jena
 
Modeling and Simulation for a 3.5 Kw Grid Connected Photo Voltaic Power System
Modeling and Simulation for a 3.5 Kw Grid Connected Photo Voltaic Power SystemModeling and Simulation for a 3.5 Kw Grid Connected Photo Voltaic Power System
Modeling and Simulation for a 3.5 Kw Grid Connected Photo Voltaic Power System
ijtsrd
 
assignment on power plant engineering
assignment on power plant engineering assignment on power plant engineering
assignment on power plant engineering
Khaled Mosharraf Mukut
 
Vietnam, a hidden gem in power development & investing
Vietnam, a hidden gem in power development & investingVietnam, a hidden gem in power development & investing
Vietnam, a hidden gem in power development & investing
Phat Nguyen
 

Similar to Carbon Emission Factor for Ukrainian Electricity Grid (20)

POWER GRID BALANCING BY BIOMASS CHPs IN UKRAINE
POWER GRID BALANCING  BY BIOMASS CHPs IN UKRAINEPOWER GRID BALANCING  BY BIOMASS CHPs IN UKRAINE
POWER GRID BALANCING BY BIOMASS CHPs IN UKRAINE
 
Electric vehicles as the future of personal transportation?
Electric vehicles as the future of personal transportation?Electric vehicles as the future of personal transportation?
Electric vehicles as the future of personal transportation?
 
FEASIBILITY STUDY OF ORKNEY’S WINDFARM DEVELOPMENT FOR SELF-SUFFICIENT FOR ...
FEASIBILITY STUDY OF ORKNEY’S WINDFARM  DEVELOPMENT FOR SELF-SUFFICIENT FOR  ...FEASIBILITY STUDY OF ORKNEY’S WINDFARM  DEVELOPMENT FOR SELF-SUFFICIENT FOR  ...
FEASIBILITY STUDY OF ORKNEY’S WINDFARM DEVELOPMENT FOR SELF-SUFFICIENT FOR ...
 
FEASIBILITY STUDY OF ORKNEY’S WINDFARM DEVELOPMENT FOR SELF-SUFFICIENT FOR EN...
FEASIBILITY STUDY OF ORKNEY’S WINDFARM DEVELOPMENT FOR SELF-SUFFICIENT FOR EN...FEASIBILITY STUDY OF ORKNEY’S WINDFARM DEVELOPMENT FOR SELF-SUFFICIENT FOR EN...
FEASIBILITY STUDY OF ORKNEY’S WINDFARM DEVELOPMENT FOR SELF-SUFFICIENT FOR EN...
 
FEASIBILITY STUDY OF ORKNEY’S WINDFARM DEVELOPMENT FOR SELF-SUFFICIENT FOR EN...
FEASIBILITY STUDY OF ORKNEY’S WINDFARM DEVELOPMENT FOR SELF-SUFFICIENT FOR EN...FEASIBILITY STUDY OF ORKNEY’S WINDFARM DEVELOPMENT FOR SELF-SUFFICIENT FOR EN...
FEASIBILITY STUDY OF ORKNEY’S WINDFARM DEVELOPMENT FOR SELF-SUFFICIENT FOR EN...
 
Involvement of solar and wind power plants in the capacity coverage of the In...
Involvement of solar and wind power plants in the capacity coverage of the In...Involvement of solar and wind power plants in the capacity coverage of the In...
Involvement of solar and wind power plants in the capacity coverage of the In...
 
Slovakia
SlovakiaSlovakia
Slovakia
 
report
reportreport
report
 
Global electricity network – Feasibility study
Global electricity network – Feasibility studyGlobal electricity network – Feasibility study
Global electricity network – Feasibility study
 
Invest in Ukraine: Renewable Energy Sector
Invest in Ukraine: Renewable Energy SectorInvest in Ukraine: Renewable Energy Sector
Invest in Ukraine: Renewable Energy Sector
 
Energy Management through Bio-gas Based Electricity Generation System during ...
Energy Management through Bio-gas Based Electricity Generation System during ...Energy Management through Bio-gas Based Electricity Generation System during ...
Energy Management through Bio-gas Based Electricity Generation System during ...
 
Environmental Profiles for Motors and Transformers
Environmental Profiles for Motors and TransformersEnvironmental Profiles for Motors and Transformers
Environmental Profiles for Motors and Transformers
 
Analysis of Modelling and Engineering Building Power Integration System Based...
Analysis of Modelling and Engineering Building Power Integration System Based...Analysis of Modelling and Engineering Building Power Integration System Based...
Analysis of Modelling and Engineering Building Power Integration System Based...
 
Waste heat recovery dynamics an analogy of electricity generation & emiss...
Waste heat recovery dynamics an analogy of electricity generation & emiss...Waste heat recovery dynamics an analogy of electricity generation & emiss...
Waste heat recovery dynamics an analogy of electricity generation & emiss...
 
Modeling and Simulation for a 3.5 Kw Grid Connected Photo Voltaic Power System
Modeling and Simulation for a 3.5 Kw Grid Connected Photo Voltaic Power SystemModeling and Simulation for a 3.5 Kw Grid Connected Photo Voltaic Power System
Modeling and Simulation for a 3.5 Kw Grid Connected Photo Voltaic Power System
 
assignment on power plant engineering
assignment on power plant engineering assignment on power plant engineering
assignment on power plant engineering
 
Ukraine
UkraineUkraine
Ukraine
 
Vietnam, a hidden gem in power development & investing
Vietnam, a hidden gem in power development & investingVietnam, a hidden gem in power development & investing
Vietnam, a hidden gem in power development & investing
 

More from Mykola Shlapak

Impact of Agriculture on Climate Change in Ukraine and Solutions to Reduce GH...
Impact of Agriculture on Climate Change in Ukraine and Solutions to Reduce GH...Impact of Agriculture on Climate Change in Ukraine and Solutions to Reduce GH...
Impact of Agriculture on Climate Change in Ukraine and Solutions to Reduce GH...
Mykola Shlapak
 
Заходи державної політики для клімат та можливості для скорочення викидів пар...
Заходи державної політики для клімат та можливості для скорочення викидів пар...Заходи державної політики для клімат та можливості для скорочення викидів пар...
Заходи державної політики для клімат та можливості для скорочення викидів пар...
Mykola Shlapak
 
Зміна клімату та вуглецевий слід
Зміна клімату та вуглецевий слідЗміна клімату та вуглецевий слід
Зміна клімату та вуглецевий слід
Mykola Shlapak
 
Технології скорочення викидів парникових газів у секторі сільського господарства
Технології скорочення викидів парникових газів у секторі сільського господарстваТехнології скорочення викидів парникових газів у секторі сільського господарства
Технології скорочення викидів парникових газів у секторі сільського господарства
Mykola Shlapak
 
Вплив сільського господарства на клімат та можливості скорочення викидів парн...
Вплив сільського господарства на клімат та можливості скорочення викидів парн...Вплив сільського господарства на клімат та можливості скорочення викидів парн...
Вплив сільського господарства на клімат та можливості скорочення викидів парн...
Mykola Shlapak
 
Від енергоефективності до енергодостатності: поведінковий ефект
Від енергоефективності до енергодостатності: поведінковий ефектВід енергоефективності до енергодостатності: поведінковий ефект
Від енергоефективності до енергодостатності: поведінковий ефект
Mykola Shlapak
 
Біокліматичне проектування
Біокліматичне проектуванняБіокліматичне проектування
Біокліматичне проектування
Mykola Shlapak
 
Взаємовплив зміни клімату та будівельної і житлової сфер
Взаємовплив зміни клімату та будівельної і житлової сферВзаємовплив зміни клімату та будівельної і житлової сфер
Взаємовплив зміни клімату та будівельної і житлової сфер
Mykola Shlapak
 
Climate change adaptation policies in agriculture: international experience a...
Climate change adaptation policies in agriculture: international experience a...Climate change adaptation policies in agriculture: international experience a...
Climate change adaptation policies in agriculture: international experience a...
Mykola Shlapak
 
Політики з адаптації до наслідків змін клімату
Політики з адаптації до наслідків змін кліматуПолітики з адаптації до наслідків змін клімату
Політики з адаптації до наслідків змін клімату
Mykola Shlapak
 
Технології скорочення викидів парникових газів у секторі сільського господар...
Технології скорочення викидів парникових газів у секторі  сільського господар...Технології скорочення викидів парникових газів у секторі  сільського господар...
Технології скорочення викидів парникових газів у секторі сільського господар...
Mykola Shlapak
 
KeepWarm: Зміни клімату та розрахунок скорочень викидів парникових газів
KeepWarm: Зміни клімату та розрахунок скорочень викидів парникових газівKeepWarm: Зміни клімату та розрахунок скорочень викидів парникових газів
KeepWarm: Зміни клімату та розрахунок скорочень викидів парникових газів
Mykola Shlapak
 
Наслідки змін клімату
Наслідки змін кліматуНаслідки змін клімату
Наслідки змін клімату
Mykola Shlapak
 
Climate Drops
Climate DropsClimate Drops
Climate Drops
Mykola Shlapak
 
Кліматичні краплі
Кліматичні крапліКліматичні краплі
Кліматичні краплі
Mykola Shlapak
 
План дій зі сталого енергетичного розвитку та клімату м. Дружківка на 2018-20...
План дій зі сталого енергетичного розвитку та клімату м. Дружківка на 2018-20...План дій зі сталого енергетичного розвитку та клімату м. Дружківка на 2018-20...
План дій зі сталого енергетичного розвитку та клімату м. Дружківка на 2018-20...
Mykola Shlapak
 
План дій зі сталого енергетичного розвитку та клімату м. Біла Церква на 2017-...
План дій зі сталого енергетичного розвитку та клімату м. Біла Церква на 2017-...План дій зі сталого енергетичного розвитку та клімату м. Біла Церква на 2017-...
План дій зі сталого енергетичного розвитку та клімату м. Біла Церква на 2017-...
Mykola Shlapak
 
National environmental accounting of EU countries: useful experience for Ukraine
National environmental accounting of EU countries: useful experience for UkraineNational environmental accounting of EU countries: useful experience for Ukraine
National environmental accounting of EU countries: useful experience for Ukraine
Mykola Shlapak
 
Green GDP as an indicator of environmental cost of economic growth in Ukraine
Green GDP as an indicator of environmental cost of economic growth in UkraineGreen GDP as an indicator of environmental cost of economic growth in Ukraine
Green GDP as an indicator of environmental cost of economic growth in Ukraine
Mykola Shlapak
 

More from Mykola Shlapak (19)

Impact of Agriculture on Climate Change in Ukraine and Solutions to Reduce GH...
Impact of Agriculture on Climate Change in Ukraine and Solutions to Reduce GH...Impact of Agriculture on Climate Change in Ukraine and Solutions to Reduce GH...
Impact of Agriculture on Climate Change in Ukraine and Solutions to Reduce GH...
 
Заходи державної політики для клімат та можливості для скорочення викидів пар...
Заходи державної політики для клімат та можливості для скорочення викидів пар...Заходи державної політики для клімат та можливості для скорочення викидів пар...
Заходи державної політики для клімат та можливості для скорочення викидів пар...
 
Зміна клімату та вуглецевий слід
Зміна клімату та вуглецевий слідЗміна клімату та вуглецевий слід
Зміна клімату та вуглецевий слід
 
Технології скорочення викидів парникових газів у секторі сільського господарства
Технології скорочення викидів парникових газів у секторі сільського господарстваТехнології скорочення викидів парникових газів у секторі сільського господарства
Технології скорочення викидів парникових газів у секторі сільського господарства
 
Вплив сільського господарства на клімат та можливості скорочення викидів парн...
Вплив сільського господарства на клімат та можливості скорочення викидів парн...Вплив сільського господарства на клімат та можливості скорочення викидів парн...
Вплив сільського господарства на клімат та можливості скорочення викидів парн...
 
Від енергоефективності до енергодостатності: поведінковий ефект
Від енергоефективності до енергодостатності: поведінковий ефектВід енергоефективності до енергодостатності: поведінковий ефект
Від енергоефективності до енергодостатності: поведінковий ефект
 
Біокліматичне проектування
Біокліматичне проектуванняБіокліматичне проектування
Біокліматичне проектування
 
Взаємовплив зміни клімату та будівельної і житлової сфер
Взаємовплив зміни клімату та будівельної і житлової сферВзаємовплив зміни клімату та будівельної і житлової сфер
Взаємовплив зміни клімату та будівельної і житлової сфер
 
Climate change adaptation policies in agriculture: international experience a...
Climate change adaptation policies in agriculture: international experience a...Climate change adaptation policies in agriculture: international experience a...
Climate change adaptation policies in agriculture: international experience a...
 
Політики з адаптації до наслідків змін клімату
Політики з адаптації до наслідків змін кліматуПолітики з адаптації до наслідків змін клімату
Політики з адаптації до наслідків змін клімату
 
Технології скорочення викидів парникових газів у секторі сільського господар...
Технології скорочення викидів парникових газів у секторі  сільського господар...Технології скорочення викидів парникових газів у секторі  сільського господар...
Технології скорочення викидів парникових газів у секторі сільського господар...
 
KeepWarm: Зміни клімату та розрахунок скорочень викидів парникових газів
KeepWarm: Зміни клімату та розрахунок скорочень викидів парникових газівKeepWarm: Зміни клімату та розрахунок скорочень викидів парникових газів
KeepWarm: Зміни клімату та розрахунок скорочень викидів парникових газів
 
Наслідки змін клімату
Наслідки змін кліматуНаслідки змін клімату
Наслідки змін клімату
 
Climate Drops
Climate DropsClimate Drops
Climate Drops
 
Кліматичні краплі
Кліматичні крапліКліматичні краплі
Кліматичні краплі
 
План дій зі сталого енергетичного розвитку та клімату м. Дружківка на 2018-20...
План дій зі сталого енергетичного розвитку та клімату м. Дружківка на 2018-20...План дій зі сталого енергетичного розвитку та клімату м. Дружківка на 2018-20...
План дій зі сталого енергетичного розвитку та клімату м. Дружківка на 2018-20...
 
План дій зі сталого енергетичного розвитку та клімату м. Біла Церква на 2017-...
План дій зі сталого енергетичного розвитку та клімату м. Біла Церква на 2017-...План дій зі сталого енергетичного розвитку та клімату м. Біла Церква на 2017-...
План дій зі сталого енергетичного розвитку та клімату м. Біла Церква на 2017-...
 
National environmental accounting of EU countries: useful experience for Ukraine
National environmental accounting of EU countries: useful experience for UkraineNational environmental accounting of EU countries: useful experience for Ukraine
National environmental accounting of EU countries: useful experience for Ukraine
 
Green GDP as an indicator of environmental cost of economic growth in Ukraine
Green GDP as an indicator of environmental cost of economic growth in UkraineGreen GDP as an indicator of environmental cost of economic growth in Ukraine
Green GDP as an indicator of environmental cost of economic growth in Ukraine
 

Recently uploaded

NRW Board Paper - DRAFT NRW Recreation Strategy
NRW Board Paper - DRAFT NRW Recreation StrategyNRW Board Paper - DRAFT NRW Recreation Strategy
NRW Board Paper - DRAFT NRW Recreation Strategy
Robin Grant
 
Daan Park Hydrangea flower season I like it
Daan Park Hydrangea flower season I like itDaan Park Hydrangea flower season I like it
Daan Park Hydrangea flower season I like it
a0966109726
 
Willie Nelson Net Worth: A Journey Through Music, Movies, and Business Ventures
Willie Nelson Net Worth: A Journey Through Music, Movies, and Business VenturesWillie Nelson Net Worth: A Journey Through Music, Movies, and Business Ventures
Willie Nelson Net Worth: A Journey Through Music, Movies, and Business Ventures
greendigital
 
一比一原版(UMTC毕业证书)明尼苏达大学双城分校毕业证如何办理
一比一原版(UMTC毕业证书)明尼苏达大学双城分校毕业证如何办理一比一原版(UMTC毕业证书)明尼苏达大学双城分校毕业证如何办理
一比一原版(UMTC毕业证书)明尼苏达大学双城分校毕业证如何办理
zm9ajxup
 
International+e-Commerce+Platform-www.cfye-commerce.shop
International+e-Commerce+Platform-www.cfye-commerce.shopInternational+e-Commerce+Platform-www.cfye-commerce.shop
International+e-Commerce+Platform-www.cfye-commerce.shop
laozhuseo02
 
Characterization and the Kinetics of drying at the drying oven and with micro...
Characterization and the Kinetics of drying at the drying oven and with micro...Characterization and the Kinetics of drying at the drying oven and with micro...
Characterization and the Kinetics of drying at the drying oven and with micro...
Open Access Research Paper
 
Environmental Science Book By Dr. Y.K. Singh
Environmental Science Book By Dr. Y.K. SinghEnvironmental Science Book By Dr. Y.K. Singh
Environmental Science Book By Dr. Y.K. Singh
AhmadKhan917612
 
Navigating the complex landscape of AI governance
Navigating the complex landscape of AI governanceNavigating the complex landscape of AI governance
Navigating the complex landscape of AI governance
Piermenotti Mauro
 
growbilliontrees.com-Trees for Granddaughter (1).pdf
growbilliontrees.com-Trees for Granddaughter (1).pdfgrowbilliontrees.com-Trees for Granddaughter (1).pdf
growbilliontrees.com-Trees for Granddaughter (1).pdf
yadavakashagra
 
Artificial Reefs by Kuddle Life Foundation - May 2024
Artificial Reefs by Kuddle Life Foundation - May 2024Artificial Reefs by Kuddle Life Foundation - May 2024
Artificial Reefs by Kuddle Life Foundation - May 2024
punit537210
 
Natural farming @ Dr. Siddhartha S. Jena.pptx
Natural farming @ Dr. Siddhartha S. Jena.pptxNatural farming @ Dr. Siddhartha S. Jena.pptx
Natural farming @ Dr. Siddhartha S. Jena.pptx
sidjena70
 
ppt on beauty of the nature by Palak.pptx
ppt on  beauty of the nature by Palak.pptxppt on  beauty of the nature by Palak.pptx
ppt on beauty of the nature by Palak.pptx
RaniJaiswal16
 
Presentación Giulio Quaggiotto-Diálogo improbable .pptx.pdf
Presentación Giulio Quaggiotto-Diálogo improbable .pptx.pdfPresentación Giulio Quaggiotto-Diálogo improbable .pptx.pdf
Presentación Giulio Quaggiotto-Diálogo improbable .pptx.pdf
Innovation and Technology for Development Centre
 
DRAFT NRW Recreation Strategy - People and Nature thriving together
DRAFT NRW Recreation Strategy - People and Nature thriving togetherDRAFT NRW Recreation Strategy - People and Nature thriving together
DRAFT NRW Recreation Strategy - People and Nature thriving together
Robin Grant
 
UNDERSTANDING WHAT GREEN WASHING IS!.pdf
UNDERSTANDING WHAT GREEN WASHING IS!.pdfUNDERSTANDING WHAT GREEN WASHING IS!.pdf
UNDERSTANDING WHAT GREEN WASHING IS!.pdf
JulietMogola
 
Q&A with the Experts: The Food Service Playbook
Q&A with the Experts: The Food Service PlaybookQ&A with the Experts: The Food Service Playbook
Q&A with the Experts: The Food Service Playbook
World Resources Institute (WRI)
 
AGRICULTURE Hydrophonic FERTILISER PPT.pptx
AGRICULTURE Hydrophonic FERTILISER PPT.pptxAGRICULTURE Hydrophonic FERTILISER PPT.pptx
AGRICULTURE Hydrophonic FERTILISER PPT.pptx
BanitaDsouza
 
Celebrating World-environment-day-2024.pdf
Celebrating  World-environment-day-2024.pdfCelebrating  World-environment-day-2024.pdf
Celebrating World-environment-day-2024.pdf
rohankumarsinghrore1
 
How about Huawei mobile phone-www.cfye-commerce.shop
How about Huawei mobile phone-www.cfye-commerce.shopHow about Huawei mobile phone-www.cfye-commerce.shop
How about Huawei mobile phone-www.cfye-commerce.shop
laozhuseo02
 
alhambra case study Islamic gardens part-2.pptx
alhambra case study Islamic gardens part-2.pptxalhambra case study Islamic gardens part-2.pptx
alhambra case study Islamic gardens part-2.pptx
CECOS University Peshawar, Pakistan
 

Recently uploaded (20)

NRW Board Paper - DRAFT NRW Recreation Strategy
NRW Board Paper - DRAFT NRW Recreation StrategyNRW Board Paper - DRAFT NRW Recreation Strategy
NRW Board Paper - DRAFT NRW Recreation Strategy
 
Daan Park Hydrangea flower season I like it
Daan Park Hydrangea flower season I like itDaan Park Hydrangea flower season I like it
Daan Park Hydrangea flower season I like it
 
Willie Nelson Net Worth: A Journey Through Music, Movies, and Business Ventures
Willie Nelson Net Worth: A Journey Through Music, Movies, and Business VenturesWillie Nelson Net Worth: A Journey Through Music, Movies, and Business Ventures
Willie Nelson Net Worth: A Journey Through Music, Movies, and Business Ventures
 
一比一原版(UMTC毕业证书)明尼苏达大学双城分校毕业证如何办理
一比一原版(UMTC毕业证书)明尼苏达大学双城分校毕业证如何办理一比一原版(UMTC毕业证书)明尼苏达大学双城分校毕业证如何办理
一比一原版(UMTC毕业证书)明尼苏达大学双城分校毕业证如何办理
 
International+e-Commerce+Platform-www.cfye-commerce.shop
International+e-Commerce+Platform-www.cfye-commerce.shopInternational+e-Commerce+Platform-www.cfye-commerce.shop
International+e-Commerce+Platform-www.cfye-commerce.shop
 
Characterization and the Kinetics of drying at the drying oven and with micro...
Characterization and the Kinetics of drying at the drying oven and with micro...Characterization and the Kinetics of drying at the drying oven and with micro...
Characterization and the Kinetics of drying at the drying oven and with micro...
 
Environmental Science Book By Dr. Y.K. Singh
Environmental Science Book By Dr. Y.K. SinghEnvironmental Science Book By Dr. Y.K. Singh
Environmental Science Book By Dr. Y.K. Singh
 
Navigating the complex landscape of AI governance
Navigating the complex landscape of AI governanceNavigating the complex landscape of AI governance
Navigating the complex landscape of AI governance
 
growbilliontrees.com-Trees for Granddaughter (1).pdf
growbilliontrees.com-Trees for Granddaughter (1).pdfgrowbilliontrees.com-Trees for Granddaughter (1).pdf
growbilliontrees.com-Trees for Granddaughter (1).pdf
 
Artificial Reefs by Kuddle Life Foundation - May 2024
Artificial Reefs by Kuddle Life Foundation - May 2024Artificial Reefs by Kuddle Life Foundation - May 2024
Artificial Reefs by Kuddle Life Foundation - May 2024
 
Natural farming @ Dr. Siddhartha S. Jena.pptx
Natural farming @ Dr. Siddhartha S. Jena.pptxNatural farming @ Dr. Siddhartha S. Jena.pptx
Natural farming @ Dr. Siddhartha S. Jena.pptx
 
ppt on beauty of the nature by Palak.pptx
ppt on  beauty of the nature by Palak.pptxppt on  beauty of the nature by Palak.pptx
ppt on beauty of the nature by Palak.pptx
 
Presentación Giulio Quaggiotto-Diálogo improbable .pptx.pdf
Presentación Giulio Quaggiotto-Diálogo improbable .pptx.pdfPresentación Giulio Quaggiotto-Diálogo improbable .pptx.pdf
Presentación Giulio Quaggiotto-Diálogo improbable .pptx.pdf
 
DRAFT NRW Recreation Strategy - People and Nature thriving together
DRAFT NRW Recreation Strategy - People and Nature thriving togetherDRAFT NRW Recreation Strategy - People and Nature thriving together
DRAFT NRW Recreation Strategy - People and Nature thriving together
 
UNDERSTANDING WHAT GREEN WASHING IS!.pdf
UNDERSTANDING WHAT GREEN WASHING IS!.pdfUNDERSTANDING WHAT GREEN WASHING IS!.pdf
UNDERSTANDING WHAT GREEN WASHING IS!.pdf
 
Q&A with the Experts: The Food Service Playbook
Q&A with the Experts: The Food Service PlaybookQ&A with the Experts: The Food Service Playbook
Q&A with the Experts: The Food Service Playbook
 
AGRICULTURE Hydrophonic FERTILISER PPT.pptx
AGRICULTURE Hydrophonic FERTILISER PPT.pptxAGRICULTURE Hydrophonic FERTILISER PPT.pptx
AGRICULTURE Hydrophonic FERTILISER PPT.pptx
 
Celebrating World-environment-day-2024.pdf
Celebrating  World-environment-day-2024.pdfCelebrating  World-environment-day-2024.pdf
Celebrating World-environment-day-2024.pdf
 
How about Huawei mobile phone-www.cfye-commerce.shop
How about Huawei mobile phone-www.cfye-commerce.shopHow about Huawei mobile phone-www.cfye-commerce.shop
How about Huawei mobile phone-www.cfye-commerce.shop
 
alhambra case study Islamic gardens part-2.pptx
alhambra case study Islamic gardens part-2.pptxalhambra case study Islamic gardens part-2.pptx
alhambra case study Islamic gardens part-2.pptx
 

Carbon Emission Factor for Ukrainian Electricity Grid

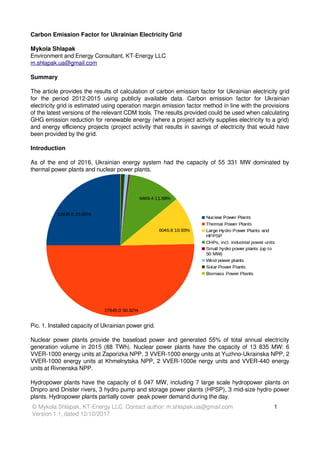
  • 1. Carbon Emission Factor for Ukrainian Electricity Grid Mykola Shlapak Environment and Energy Consultant, KT-Energy LLC m.shlapak.ua@gmail.com Summary The article provides the results of calculation of carbon emission factor for Ukrainian electricity grid for the period 2012-2015 using publicly available data. Carbon emission factor for Ukrainian electricity grid is estimated using operation margin emission factor method in line with the provisions of the latest versions of the relevant CDM tools. The results provided could be used when calculating GHG emission reduction for renewable energy (where a project activity supplies electricity to a grid) and energy efficiency projects (project activity that results in savings of electricity that would have been provided by the grid. Introduction As of the end of 2016, Ukrainian energy system had the capacity of 55 331 MW dominated by thermal power plants and nuclear power plants. Pic. 1. Installed capacity of Ukrainian power grid. Nuclear power plants provide the baseload power and generated 55% of total annual electricity generation volume in 2015 (88 TWh). Nuclear power plants have the capacity of 13 835 MW: 6 VVER-1000 energy units at Zaporizka NPP, 3 VVER-1000 energy units at Yuzhno-Ukrainska NPP, 2 VVER-1000 energy units at Khmelnytska NPP, 2 VVER-1000e nergy units and VVER-440 energy units at Rivnenska NPP. Hydropower plants have the capacity of 6 047 MW, including 7 large scale hydropower plants on Dnipro and Dnister rivers, 3 hydro pump and storage power plants (HPSP), 3 mid-size hydro power plants. Hydropower plants partially cover peak power demand during the day. © Mykola Shlapak, KT-Energy LLC. Contact author: m.shlapak.ua@gmail.com Version 1.1, dated 12/10/2017 1
  • 2. The share of renewable energy has grown during recent years, but still renewables cover only up to 7% of electricity generation volume (including up to 6% generated by HPPs and 1% – by other renewable sources). As of the end of 2016, the capacity of renewable energy plants in the national electricity system reached 1135 MW, including 439 MW of wind power plants, 458 MW of solar power plants, 65 MW of biomass power plants, and 174 MW of small hydro power plants. The share of thermal power plants in overall installed capacity of Ukrainian energy system is more than 50%, however actual available capacity of TPPs is significantly lower than the designed capacity, and thus the share of TPPs in current electricity generation is around 35%. Ukraine has 14 thermal power plants, mainly coal fired, with total current installed capacity of 27.8 GW. Zuivska TPP and Starobesivska TPP are located on the territory occupied by Russian Federation. Ukrainian thermal power plants were constructed mainly in 1950-1960s and many of the units have worked more than 250 000 hours. Such long operation time of main equipment led to physical depreciation of the equipment and higher level of emergency failures. With average efficiency of 31% resulting in 400 grams of coal equivalent (or 11.7 GJ per MWh) consumption per kilowatt hour ratio thermal power generation contributes a significant part of national GHG emissions. Previously, carbon emission factor for Ukrainian electricity grid was calculated in several studies to estimate GHG emission reductions from joint implementation projects. In 2007, carbon emission factor for Ukrainian electricity grid was developed by Global Carbon B.V. and verified by TÜV SÜD Industrie Service GmbH.1 The estimation was based on a simple operation margin emission factor method and data for the years 2003-2005. The resulted carbon emission factor was 0.807 tonnes CO2 / MWh for power generation (“producing projects”), and 0.896 tonnes CO2 / MWh for electricity consumption (“reducing projects”). In 2010 Lahmeyer International prepared the study on the development of the electricity carbon emission factors for Ukraine for the European Bank for Development and Reconstruction2 . Carbon emission factors for Ukraine for the period from 2009 to 2020 were calculated using simple adjusted operation margin emission factor method. The resulted operating margin emission factor starts at 1.052 t CO2/MWh in 2009 and increases slightly in 2011 and 2012 to a maximum of 1.063 t CO2/MWh. For the period 2013-2017 the operating margin ranges between 1.058-1.059 t CO2/MWh and than gradually decreases to 0.941 t CO2/MWh in 2020. In 2011 the National Ecological Investment Agency of Ukraine has approved the methodology for the calculation of carbon dioxide emission factor for electricity generation by thermal power plants and emission factor for electricity consumption.3 Based on the approved methodology, which corresponds to the simple operation margin calculation method, the emission factor was calculated and approved by the orders of the National Ecological Investment Agency for the years 2008-2011. Table 1. Emission factors approved by the National Ecological Investment Agency Emission factor 2008 2009 2010 2011 Emission factor for electricity generation by thermal power plants, tonnes CO2 per MWh 1.055 1.068 1.067 1.063 Emission factor for electricity consumption, tonnes CO2 per MWh 1.219 1.237 1.225 1.227 1 https://ji.unfccc.int/UserManagement/FileStorage/46JW2KL36KM0GEMI0PHDTQF6DVI514 2 http://encon.sumdu.edu.ua/doc/methodics/Baseline_Study_Ukraine_Final_English.pdf 3 http://cons.parus.ua/map/doc/07IC44DC43/Pro-zatverdzhennya-Metodiki-rozrakhunku-pitomikh-vikidiv-dvookisu-vugletsyu-pri-virobnitstvi- elektrichnoyi-energiyi-na-teplovikh-elektrostantsiyakh-ta-pri-yiyi-spozhivann.html © Mykola Shlapak, KT-Energy LLC. Contact author: m.shlapak.ua@gmail.com Version 1.1, dated 12/10/2017 2
  • 3. Methodology The calculation of emission factor for Ukrainian electricity system is based on the CDM Methodological tool “Tool to calculate the emission factor for an electricity system”, Version 05.0. This tool provides methodological guidance to estimate the operation margin (OM), build margin (BM) and/or combined margin (CM) emission factor for the electricity system. Electricity export is not subtracted from electricity generation data used for calculating the electricity emission factors. Only grid power plants are included in the calculation. The combined margin emission factor is the result of a weighted average of two emission factors pertaining to the electricity system: the “operating margin” (OM) and the “build margin” (BM). The operating margin is the emission factor that refers to the group of existing power plants whose current electricity generation would be affected by the proposed project activity. The build margin is the emission factor that refers to the group of prospective power plants whose construction and future operation would be affected by the proposed project activity. The calculation of BM emission factor is based on the analysis of most recent additions of the new capacities to the electricity system. Capacity additions from retrofits of power plants should not be included in the calculation of the build margin emission factor. Electricity generation of the sample group of power units used to calculate the build margin should comprise 20% of the annual electricity generation of the electricity system. The sample group of power units is determined either as the set of five power units, that started to supply electricity to the grid most recently, or larger set of power units, started to supply electricity to the grid during last 10 years and annual electricity generation of which comprises 20% of the annual electricity generation of the electricity system. The power units that started to supply electricity to the grid more than 10 years ago could also be included in the sample until the electricity generation of the new set comprises 20 per cent of the annual electricity generation of the project electricity system. In Ukraine, however, the electricity system is characterized by significant overcapacity and limited capacities of new power plants connected to the grid during last 10 years. During 2006-2017, major capacity additions in the united electricity system of Ukraine were due to construction of renewable energy power plants (more than 1200 MW of solar, wind, small hydro and biomass power plants), construction of hydro pump and storage power plants (1123 MW), modernization of thermal power plants (845 MW), commissioning of new CHPs units and industrial power plants (about 650 MW), and modernization of hydro power plants (336 MW). Capacity additions from the retrofit of thermal power and hydro power plants are not taken into account during the calculation of BM emission factor according to the Methodological Tool. Renewable energy power plants, new CHPs units and industrial power plants, and hydro pump and storage power plants commissioned during last 10 yers generate less than 5% of electricity. To reach 20% of annual electricity generation we should include in the sample power plants connected to the grid up to 30 years ago, including nuclear power units commissioned in 2004 (2000 MW), 1995 (1000 MW), and even 1989 (1000 MW). Nuclear power units would constitute the major share of the capacity in the sample. Such sample would not be representative in terms of the expected technology and fuel mix of the power plants to be constructed in Ukraine. Moreover, renewable energy and energy efficiency projects are not likely to influence the operation of nuclear power plants, which provide low-cost base-load electricity supply. © Mykola Shlapak, KT-Energy LLC. Contact author: m.shlapak.ua@gmail.com Version 1.1, dated 12/10/2017 3
  • 4. Therefore, carbon emission factor for Ukrainian electricity grid is calculated based only on the operation margin emission factor.4 The Methodological Tool provides step-by-step guidance to define the approach to be used for OM emission factor calculation. Pic. 2. Overview of the application of OM methods As only annual data from each power plant on power generation, fuel type and fuel consumption are available the LCMR share was defined on the first step. Low-cost/must-run (LCMR) resources - are defined as power plants with low marginal generation costs or dispatched independently of the daily or seasonal load of the grid. They include hydro, geothermal, wind, low-cost biomass, nuclear and solar generation. If a fossil fuel plant is dispatched independently of the daily or seasonal load of the grid and if this can be demonstrated based on the publicly available data, it should be considered as a low-cost/must-run. Electricity imports shall be treated as one LCMR power plant. Combined heat and power plants (CHP units) connected to the electricity system of Ukraine are also considered as low-cost/must-run resources, as they are usually dispatched independently of the daily or seasonal load to provide heat energy for residential, commercial and public buildings. In Ukraine LCMR share is higher than 50% and during last 5 years was in the range of 55-65%. Please refer to Data section for details. 4 Similar approach has been used in “Development of the electricity carbon emission factors for Ukraine. Baseline study for Ukraine. Final Report” and “Ukraine - Assessment of new calculation of CEF ”. Available at: http://encon.sumdu.edu.ua/doc/methodics/Baseline_Study_Ukraine_Final_English.pdf and https://ji.unfccc.int/UserManagement/FileStorage/46JW2KL36KM0GEMI0PHDTQF6DVI514 © Mykola Shlapak, KT-Energy LLC. Contact author: m.shlapak.ua@gmail.com Version 1.1, dated 12/10/2017 4
  • 5. The average load of LCMR (average amount of load supplied by low-cost/must-run resources in a grid) is lower than average lowest annual system loads (LASL) during most recent 3 years (average load of LCMR is 11604 MW while average LASL is 12150 MW). The average load of LCMR is defined by dividing total electricity generation by LCMR resources by 8760 hours. Table 2. LCMR and LASL data Data 2012 2013 2014 2015 2016 LCMR share 55.9% 55.0% 57.9% 64.3% 65.5% Average load of LCMR 12642 12152 12017 11614 11182 Lowest annual system load (LASL) N/D N/D 13158 11989 11302 Average load of LCMR is less than LASL? N/D N/D Yes Yes Yes Therefore, the simple operation margin will be used for the estimation of the emission factor for Ukrainian electricity system. According to the Methodological tool the simple OM emission factor is calculated as the generation- weighted average CO2 emissions per unit net electricity generation (t CO2 /MWh) of all generating power plants serving the system, not including low-cost/must-run power plants/units. The simple OM has been calculated using Option A proposed the Methodological tool, which is calculation based on the net electricity generation and a CO2 emission factor of each power unit (Equation 3 of the Methodological tool). CO2 emission factor of each thermal power plant in year y (t CO2 /MWh) was calculated using option A.1 of the Methodological Tool using the data on fuel consumption and electricity generation for each power plant (using equation 4 of the Methodological Tool). © Mykola Shlapak, KT-Energy LLC. Contact author: m.shlapak.ua@gmail.com Version 1.1, dated 12/10/2017 5
  • 6. In case of industrial power plants, where only data on electricity generation is available, an emission factor of 0 t CO2 / MWh has been assumed as a simple and conservative approach (Option A3 of the Methodological Tool). CO2 emission factor to estimate the baseline, project and/or leakage emissions associated with the consumption of electricity (CO2 emissions from the combustion of fossil fuels at power plants connected physically to the national electricity system) was calculated based on the provisions of the CDM Methodological tool “Baseline, project and/or leakage emissions from electricity consumption and monitoring of electricity generation”, Version 03.0. Following the generic approach, project, baseline and/or leakage emissions from consumption of electricity are calculated based on the quantity of electricity consumed, an emission factor for electricity generation and a factor to account for transmission losses (equations 1, 2, 3 of the CDM Methodological tool “Baseline, project and/or leakage emissions from electricity consumption and monitoring of electricity generation”, Version 03.0). Emission factor for consumption of electricity is thus can be calculated as follows: EFelectricity=EFEF , j,l×(1+TDLj, y ) where: EFelectricity – is the CO2 emission factor to estimate the baseline, project and/or leakage emissions associated with the consumption of electricity; EF EF, j, i – is the CO2 emission factor for electricity generation; TDL j, y – is the transmission and distribution losses value for the grid during year y. Average technical transmission and distribution losses in the united energy system of Ukraine was used to calculate a factor to account for transmission losses (TDL). © Mykola Shlapak, KT-Energy LLC. Contact author: m.shlapak.ua@gmail.com Version 1.1, dated 12/10/2017 6
  • 7. Data Data on power generation volumes by different types of power plants were derived from the statistical data of the Ministry of Energy and Coal Industry of Ukraine. The structuring of the data has been slightly changed to ensure consistency with the structuring principle of the National GHG Inventory. In particular power generation by Myronivska TPP has been counted in the group of thermal power plants, and excluded from power generation by CHP units. Data on electricity generation by Zuivska TPP and Starobesivska TPP for 2015 and 2016 are not included in the official statistics of the Ministry of Energy and Coal Industry of Ukraine. National GHG inventory report for the period 1990- 2015 includes data on fuel consumption by Zuivska TPP and Starobesivska TPP and associated GHG emissions. For the year 2015 electricity generation by Zuivska TPP and Starobesivska TPP as reported by TPPs operators were included in the total electricity generation volumes to ensure consistency with the National GHG Inventory. Table 3. Electricity generation in Ukraine during 2012-2015 in GWh Generation Type 2012 2013 2014 2015 Hydro 10832.6 14215.2 9092.5 6777.9 Other renewables (excl. hydro), incl.: 617.6 1247.0 1664.5 1577.4 Wind 284.0 N/A 1128.7 978.7 Solar 333.6 N/A 432.1 464.6 Biomass 0.0 N/A 103.7 134.1 Nuclear 90137.4 83209.4 88389.1 87627.5 CHPs 9156.0 7781.7 6123.9 5757.7 Total Low-cost/must-run (LCMR) resources 110743.6 106453.3 105270.0 101740.5 Termal power plants generation (incl. Myronivska TPP) 79401.5 78797.8 68884.5 54745.0 Industrial power plants generation (block stations) 7974.2 8312.3 7790.2 1773.0 Total not low-cost / must-run (LCMR) resources 87375.7 87110.1 76674.7 56518.0 Total electricity generation, GWh 198119.3 193563.4 181944.7 158258.6 The calculation of OM emission factor has been performed using publicly available data, in particular: • data on total and net electricity generation volumes by 15 thermal power plants, which are provided by TPP operators in annual reports as well as in open data sets of the Ministry of Energy and Coal Industry of Ukraine; • data on coal consumption by each of 15 thermal power plants, which are provided in most recent Ukraine’s GHG inventory;5 • data on fuels characteristics provided in most recent Ukraine’s GHG inventory: NCV, carbon content and oxidation factor for coal; NCV, carbon content and density for natural gas; NCV and carbon content for heavy oil fuels; oxidation factor for natural gas and heavy oil fuels is assumed to be equal 1.6 The following data gaps have been identified during the calculation of OM emission factor: 5 UKRAINE’S GREENHOUSE GAS INVENTORY 1990-2015. Annual National Inventory Report for Submission under the United Nations Framework Convention on Climate Change and the Kyoto Protocol, section A.2.11.2 6 Same as above. © Mykola Shlapak, KT-Energy LLC. Contact author: m.shlapak.ua@gmail.com Version 1.1, dated 12/10/2017 7
  • 8. • no public data on natural gas consumption and heavy oil fuels consumption by each thermal power plants were identified; the data were estimated based on total consumption of fuel by each thermal power plant7 , fuel structure data for the years 2010-20128 or later periods where available, as well as the share of each thermal power plant in electricity generation; such an approach could lead to errors in the figures of particular fuel consumption by specific power plants, but the errors will not have material effect on the results of carbon emission factor calculation due to the low share of natural gas and heavy oil fuels in the fuel mix (less than 2% on average); • no public data on net electricity supply to the grid were identified for Centrenergo’s TPPs for the years 2013-2015, Myronivska TPP for the year 2012 and industrial power plants; the data were estimated based on the information about total electricity generation and the average rate of electricity consumption for own needs during the period 2009-2012 in case of Centrenergo’s TPPs and during the period 2013-2015 in case of Myronivska TPP; for industrial power plants electricity consumption for own needs were assumed to be equal 10%. Filling these data gaps by extending the open data sets from the Ministry of Energy and Coal Industry of Ukraine will improve the accuracy of the calculations and ensure full correspondence with the provisions of the Methodological Tool. Data used in the calculation of OM emission factor is provided in Annex 1. Results The results of the calculation of the carbon dioxide emission factor for each thermal power plant are provided in Table 2. Table 4. Carbon dioxide emission factor for each thermal power plant Thermal power plants Coal type 2010 2011 2012 2013 2014 2015 Kryvorizka TPP Т 1.058 1.051 1.068 1.077 1.086 1.196 Prydniprovska TPP А+Т 1.196 1.198 1.193 1.217 1.209 1.329 Zaporizka TPP Г+Д 0.914 0.897 0.982 0.971 0.969 0.967 Zuivska TPP Г+Д 0.893 0.882 0.980 0.972 0.997 1.014 Luganska TPP А+Т 1.214 1.204 1.231 1.231 1.215 1.291 Kurakhivska TPP Г+Д 1.091 1.052 1.064 1.044 1.053 1.078 Burshtyn TPP Г+Д 1.091 1.091 1.077 1.071 1.077 1.083 Dobrotvirska TPP Г+Д+Ж 1.113 1.110 1.076 1.124 1.116 1.110 Ladyzhyn TPP Г+Д 1.038 1.030 1.056 1.070 1.091 1.120 Starobeshivska TPP А+Т 1.180 1.199 1.203 1.208 1.188 1.164 Slovianska TPP А+Т 1.242 1.214 1.220 1.240 1.259 1.197 Vuglegirska TPP Г+Д 1.018 1.012 0.985 1.000 1.005 1.019 Trypilska TPP А+Т 1.152 1.154 1.141 1.151 1.081 1.142 Zmiivska TPP А+Т 1.165 1.142 1.150 1.158 1.134 1.174 Myronivska А+Т / Г+Д 1.637 1.675 1.660 1.581 1.573 1.628 7 As provided in UKRAINE’S GREENHOUSE GAS INVENTORY 1990-2015, section A.2.11.2 8 As provided in Перспективи впровадження чистих вугільних технологій в енергетику України/ [Вольчин І. А., Дунаєвська Н. І., Гапонич Л. С., Чернявський М. В., Топал О. І., Засядько Я. І.]. –К.:ГНОЗІС,2013.–308с. © Mykola Shlapak, KT-Energy LLC. Contact author: m.shlapak.ua@gmail.com Version 1.1, dated 12/10/2017 8
  • 9. The simple OM emission factor for Ukrainian electricity grid was calculated as the generation- weighted average CO2 emissions per unit net electricity generation (t CO2 /MWh) of all thermal power plants serving the united energy system of Ukraine and taking into account electricity generation by industrial power plants, which are also part of non-LCMR resources. CO2 emission factor for electricity generation by thermal power plants (weighted average CO2 emissions per unit net electricity generation of all thermal power plants serving the united energy system of Ukraine not taking into account electricity generation by industrial power plants) provided in the table below for illustrative purposes. CO2 emission factor to estimate the emissions associated with the consumption of electricity has been calculated based on both CO2 emission factor for electricity generation by thermal power plants and CO2 emission factor for Ukrainian electricity grid. The more conservative lower value is recommended to be used for the estimation of emission reduction for energy efficiency projects. Table 5. Emission factors for electricity generation and consumption Parameter 2012 2013 2014 2015 CO2 emission factor for electricity generation by thermal power plants, tonne CO2 per MWh 1.101 1.103 1.097 1.105 CO2 emission factor for Ukrainian electricity grid, tonne CO2 per MWh 1.001 0.999 0.986 1.071 CO2 emission factor to estimate the baseline, project and/or leakage emissions associated with the consumption of electricity (based on CO2 emission factor for electricity generation by thermal power plants), tonne CO2 per MWh 1.231 1.229 1.219 1.234 CO2 emission factor to estimate the baseline, project and/or leakage emissions associated with the consumption of electricity (CO2 emission factor for Ukrainian electricity grid), tonne CO2 per MWh 1.120 1.113 1.096 1.195 Conclusions Due to the large share of mainly coal fired thermal power plants in the installed capacity, the national electricity grid of Ukraine has high carbon intensity. CO2 emission factor for Ukrainian electricity grid estimated based on the publicly available data ranges between 0.986 and 1.071 tonne CO2 per MWh during the period 2012-2015. High transmission losses lead to even greater CO2 emission factor associated with the consumption of electricity ranging between 1.096 and 1.195 tonne CO2 per MWh. High carbon intensity leads to significant GHG emissions in the energy sector, but simultaneously provides opportunities for carbon emission reduction by energy efficiency and renewable energy projects. © Mykola Shlapak, KT-Energy LLC. Contact author: m.shlapak.ua@gmail.com Version 1.1, dated 12/10/2017 9
  • 10. Annex 1. Data used in the calculation of OM emission factor Data on coal consumption by thermal power plants (1000 tonnes) Thermal power plants Coal type 2012 2013 2014 2015 Kryvorizka TPP Т 3747 3236 3023 1241 Prydniprovska TPP А+Т 1986 1943 1907 794 Zaporizka TPP Г+Д 2165 2605 2482 2656 Zuivska TPP Г+Д 2629 3119 2087 1560 Luganska TPP А+Т 2747 2345 2128 1267 Kurakhivska TPP Г+Д 3424 3785 3303 3368 Burshtyn TPP Г+Д 4700 4748 4895 4845 Dobrotvirska TPP Г+Д+Ж 1139 972 912 1158 Ladyzhyn TPP Г+Д 2252 2823 2706 2746 Starobeshivska TPP А+Т 3035 3739 2721 2107 Slovianska TPP А+Т 1346 1159 575 1075 Vuglegirska TPP Г+Д 2596 1016 1608 2002 Trypilska TPP А+Т 2564 2148 1803 1311 Zmiivska TPP А+Т 3139 3213 2382 552 Myronivska А+Т 192 179 147 125 Myronivska Г+Д 166 164 135 80 Data source: calculated following the approach provided in Ukraine’s greenhouse gases inventory 1990-2015, section A.2.11.2 Data on fuel NCV (GJ per tonnes or GJ per 1000 m3 ) Thermal power plants Coal type 2012 2013 2014 2015 Kryvorizka TPP Т 24.35 24.15 24.28 23.35 Prydniprovska TPP А+Т 22.56 23.09 23.31 22.32 Zaporizka TPP Г+Д 21.08 22.14 21.31 21.11 Zuivska TPP Г+Д 19.22 20.22 20.34 20.73 Luganska TPP А+Т 24.43 25.02 24.94 23.17 Kurakhivska TPP Г+Д 17.67 18.87 17.93 17.94 Burshtyn TPP Г+Д 21.33 21.56 21.31 20.76 Dobrotvirska TPP Г+Д+Ж 22.44 22.46 21.99 20.81 Ladyzhyn TPP Г+Д 20.73 21.31 20.39 20.40 Starobeshivska TPP А+Т 22.55 22.01 23.17 23.14 Slovianska TPP А+Т 22.63 22.84 23.37 23.60 Vuglegirska TPP Г+Д 22.57 22.51 22.71 22.39 Trypilska TPP А+Т 22.82 22.91 22.23 23.35 Zmiivska TPP А+Т 23.03 23.00 22.08 23.53 Myronivska А+Т / Г+Д 20.57 20.62 20.84 22.64 Myronivska Т 18.56 18.77 18.51 19.00 Natural Gas 34.10 34.14 33.93 34.82 Heavy oil fuel 40.15 40.15 40.13 40.18 Data source: Ukraine’s greenhouse gases inventory 1990-2015 © Mykola Shlapak, KT-Energy LLC. Contact author: m.shlapak.ua@gmail.com Version 1.1, dated 12/10/2017 10
  • 11. Data on fuels’ CO2 emission factor (tonne CO2 per TJ) Thermal power plants Coal type 2012 2013 2014 2015 Kryvorizka TPP Т 95.45 94.96 93.65 92.87 Prydniprovska TPP А+Т 92.61 93.08 92.87 93.76 Zaporizka TPP Г+Д 92.49 92.94 93.78 92.38 Zuivska TPP Г+Д 93.86 93.62 93.59 92.78 Luganska TPP А+Т 98.43 98.85 97.88 97.74 Kurakhivska TPP Г+Д 92.76 91.78 93.55 93.26 Burshtyn TPP Г+Д 91.70 92.57 92.84 93.09 Dobrotvirska TPP Г+Д+Ж 88.90 90.26 91.63 91.95 Ladyzhyn TPP Г+Д 94.75 96.38 96.50 95.44 Starobeshivska TPP А+Т 98.85 99.52 98.25 96.71 Slovianska TPP А+Т 98.40 99.61 99.92 98.25 Vuglegirska TPP Г+Д 90.50 91.48 91.96 91.76 Trypilska TPP А+Т 95.96 96.81 95.81 95.31 Zmiivska TPP А+Т 97.76 98.12 95.44 95.15 Myronivska А+Т / Г+Д 98.87 98.98 98.40 98.80 Myronivska Т 91.08 91.98 92.67 93.40 Natural Gas 55.51 55.62 55.44 55.78 Heavy oil fuel 77.37 77.37 77.37 77.37 Data source: calculated using carbon content and oxidation factor data provided in Ukraine’s greenhouse gases inventory 1990-2015 and the molecular mass ratio of CO2 / C (44/12). Data on net electricity generation (GWh) Thermal power plants Coal type 2012 2013 2014 2015 Kryvorizka TPP Т 8210.4 6934.5 6380.7 2279.7 Prydniprovska TPP А+Т 3629.0 3544.6 3525.8 1266.1 Zaporizka TPP Г+Д 4330.7 5548.1 5142.3 5442.4 Zuivska TPP Г+Д 4875.3 6100.3 4004.3 3005.0 Luganska TPP А+Т 5428.2 4767.4 4293.0 2250.8 Kurakhivska TPP Г+Д 5370.8 6388.5 5347.6 5303.2 Burshtyn TPP Г+Д 8691.3 8974.7 9073.0 8771.3 Dobrotvirska TPP Г+Д+Ж 2121.9 1759.0 1654.9 2024.7 Ladyzhyn TPP Г+Д 4215.9 5452.6 4918.5 4839.7 Starobeshivska TPP А+Т 5710.6 6864.5 5272.0 4106.0 Slovianska TPP А+Т 2468.0 2141.4 1084.0 2110.0 Vuglegirska TPP Г+Д 5410.8 2108.7 3357.4 4098.4 Trypilska TPP А+Т 4961.9 4159.9 3584.6 2589.1 Zmiivska TPP А+Т 6287.1 6364.9 4518.3 1066.5 Myronivska А+Т / Г+Д 406.9 413.0 340.0 260.8 Total 72118.8 71522.1 62496.4 49413.7 Data source: annual reports of TPP operators; cells marked grain contain estimated values (see Data section for the explanation). © Mykola Shlapak, KT-Energy LLC. Contact author: m.shlapak.ua@gmail.com Version 1.1, dated 12/10/2017 11
  • 12. Data on transmission losses Data 2012 2013 2014 2015 Electricity supply, GWh 180880 176331 165975 146358.6 Total technological electricity losses during transmission and distribution (0.38-800 kV), GWh 21380 20145 18555 16980 Total technological electricity losses during transmission and distribution (0.38-800 kV), % 11.82% 11.41% 11.17% 11.60% Data source: annual reports of the National Commission on Energy Sector and Utilities Regulation ----- Document Revision History Date Version Changes 11/10/2017 Version 1.0 Initial publication 12/10/2017 Version 1.1 Information on previous studies on carbon emission factors for Ukrainian electricity grid and official carbon emission factors for electricity generation by thermal power plants approved by the National Ecological Investment Agency has been added in section “Introduction” (p. 2). Editorial changes. © Mykola Shlapak, KT-Energy LLC. Contact author: m.shlapak.ua@gmail.com Version 1.1, dated 12/10/2017 12