Downloaded 469 times


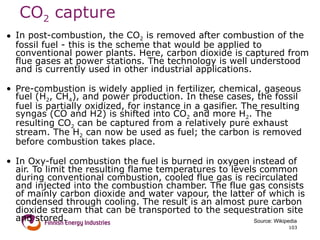
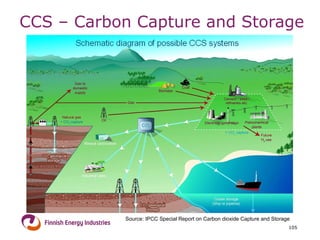
![Carbon Capture and Storage - CCS CCS is an approach to mitigate global warming by capturing CO 2 from large point sources such as fossil fuel power plants and storing it. Technology for large scale capture of CO 2 is already commercially available and fairly well developed. Although CO 2 has been injected into geological formations for various purposes, the long term storage of CO 2 is a relatively untried concept and as yet no large scale power plant operates with a full CCS system. CCS could reduce CO2 emissions approximately 80-90%, increase the fuel needs of a coal-fired plant with CCS by about 25% and increase the cost of energy from a new power plant with CCS by 21-91% [ IPCC special report on Carbon Dioxide Capture and Storage 2005]](https://image.slidesharecdn.com/yviestintverkkoviestintenergia-fiverkkopalvelu-uudistuskalvosarjatympristclimatechangeandenergyppt2008-100908060312-phpapp02/85/Climate-Change-and-Energy-102-320.jpg)
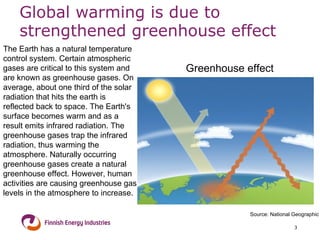
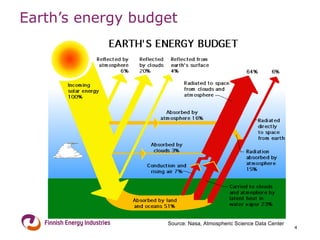
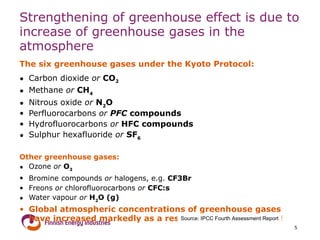
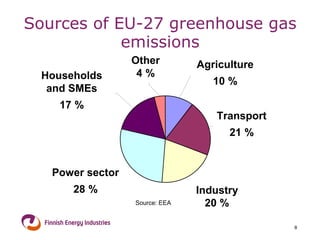
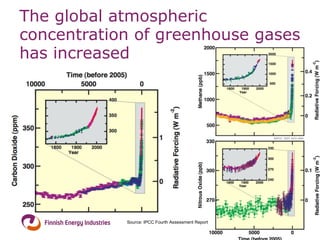
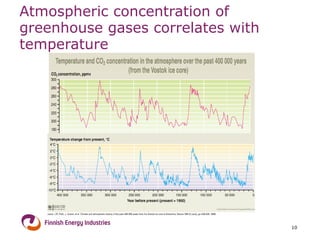
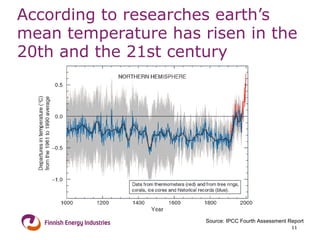
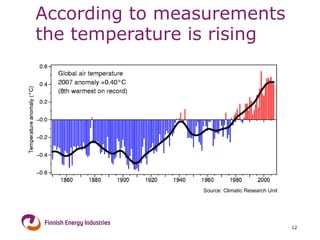
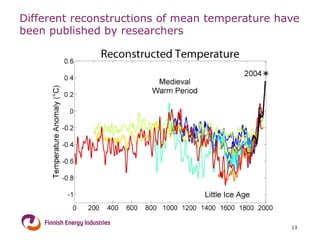
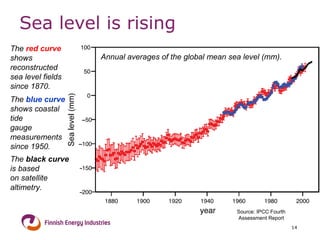
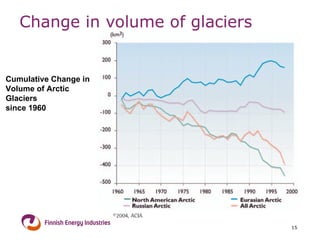
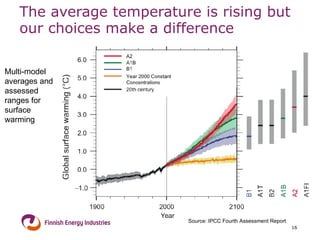
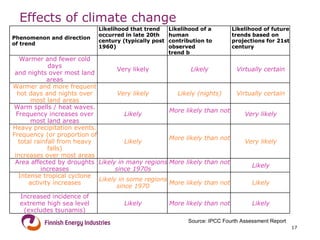
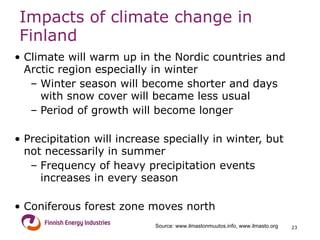
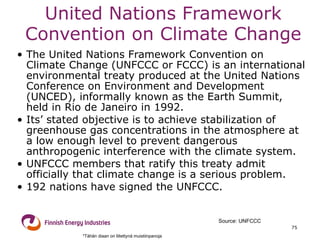
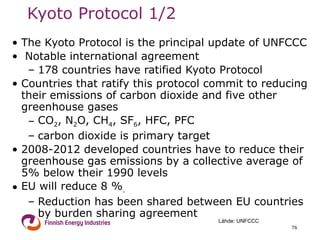
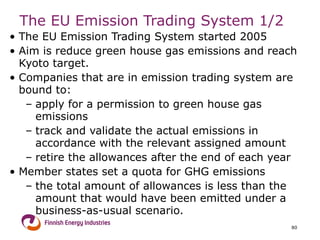
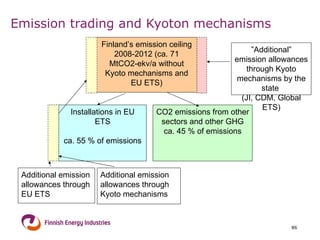
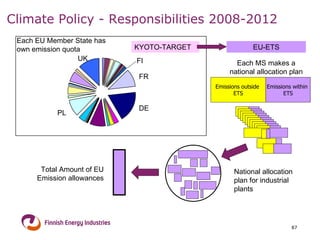
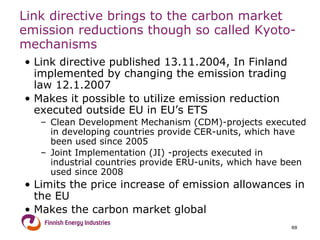
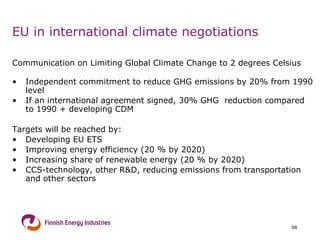
The document discusses climate change and the energy sector. It provides information on: 1) The greenhouse effect and how human activities are increasing greenhouse gas levels and global warming. 2) Key greenhouse gases like carbon dioxide and their sources. Human activities like fossil fuel use are the main driver of rising CO2 levels. 3) Climate change is already affecting factors like temperature, sea levels, and glaciers. Impacts are projected for areas like agriculture, water resources, and human health. 4) International agreements like the UNFCCC and Kyoto Protocol aim to reduce emissions but countries have different commitments. The EU ETS is a carbon market program to lower emissions cost-effectively.