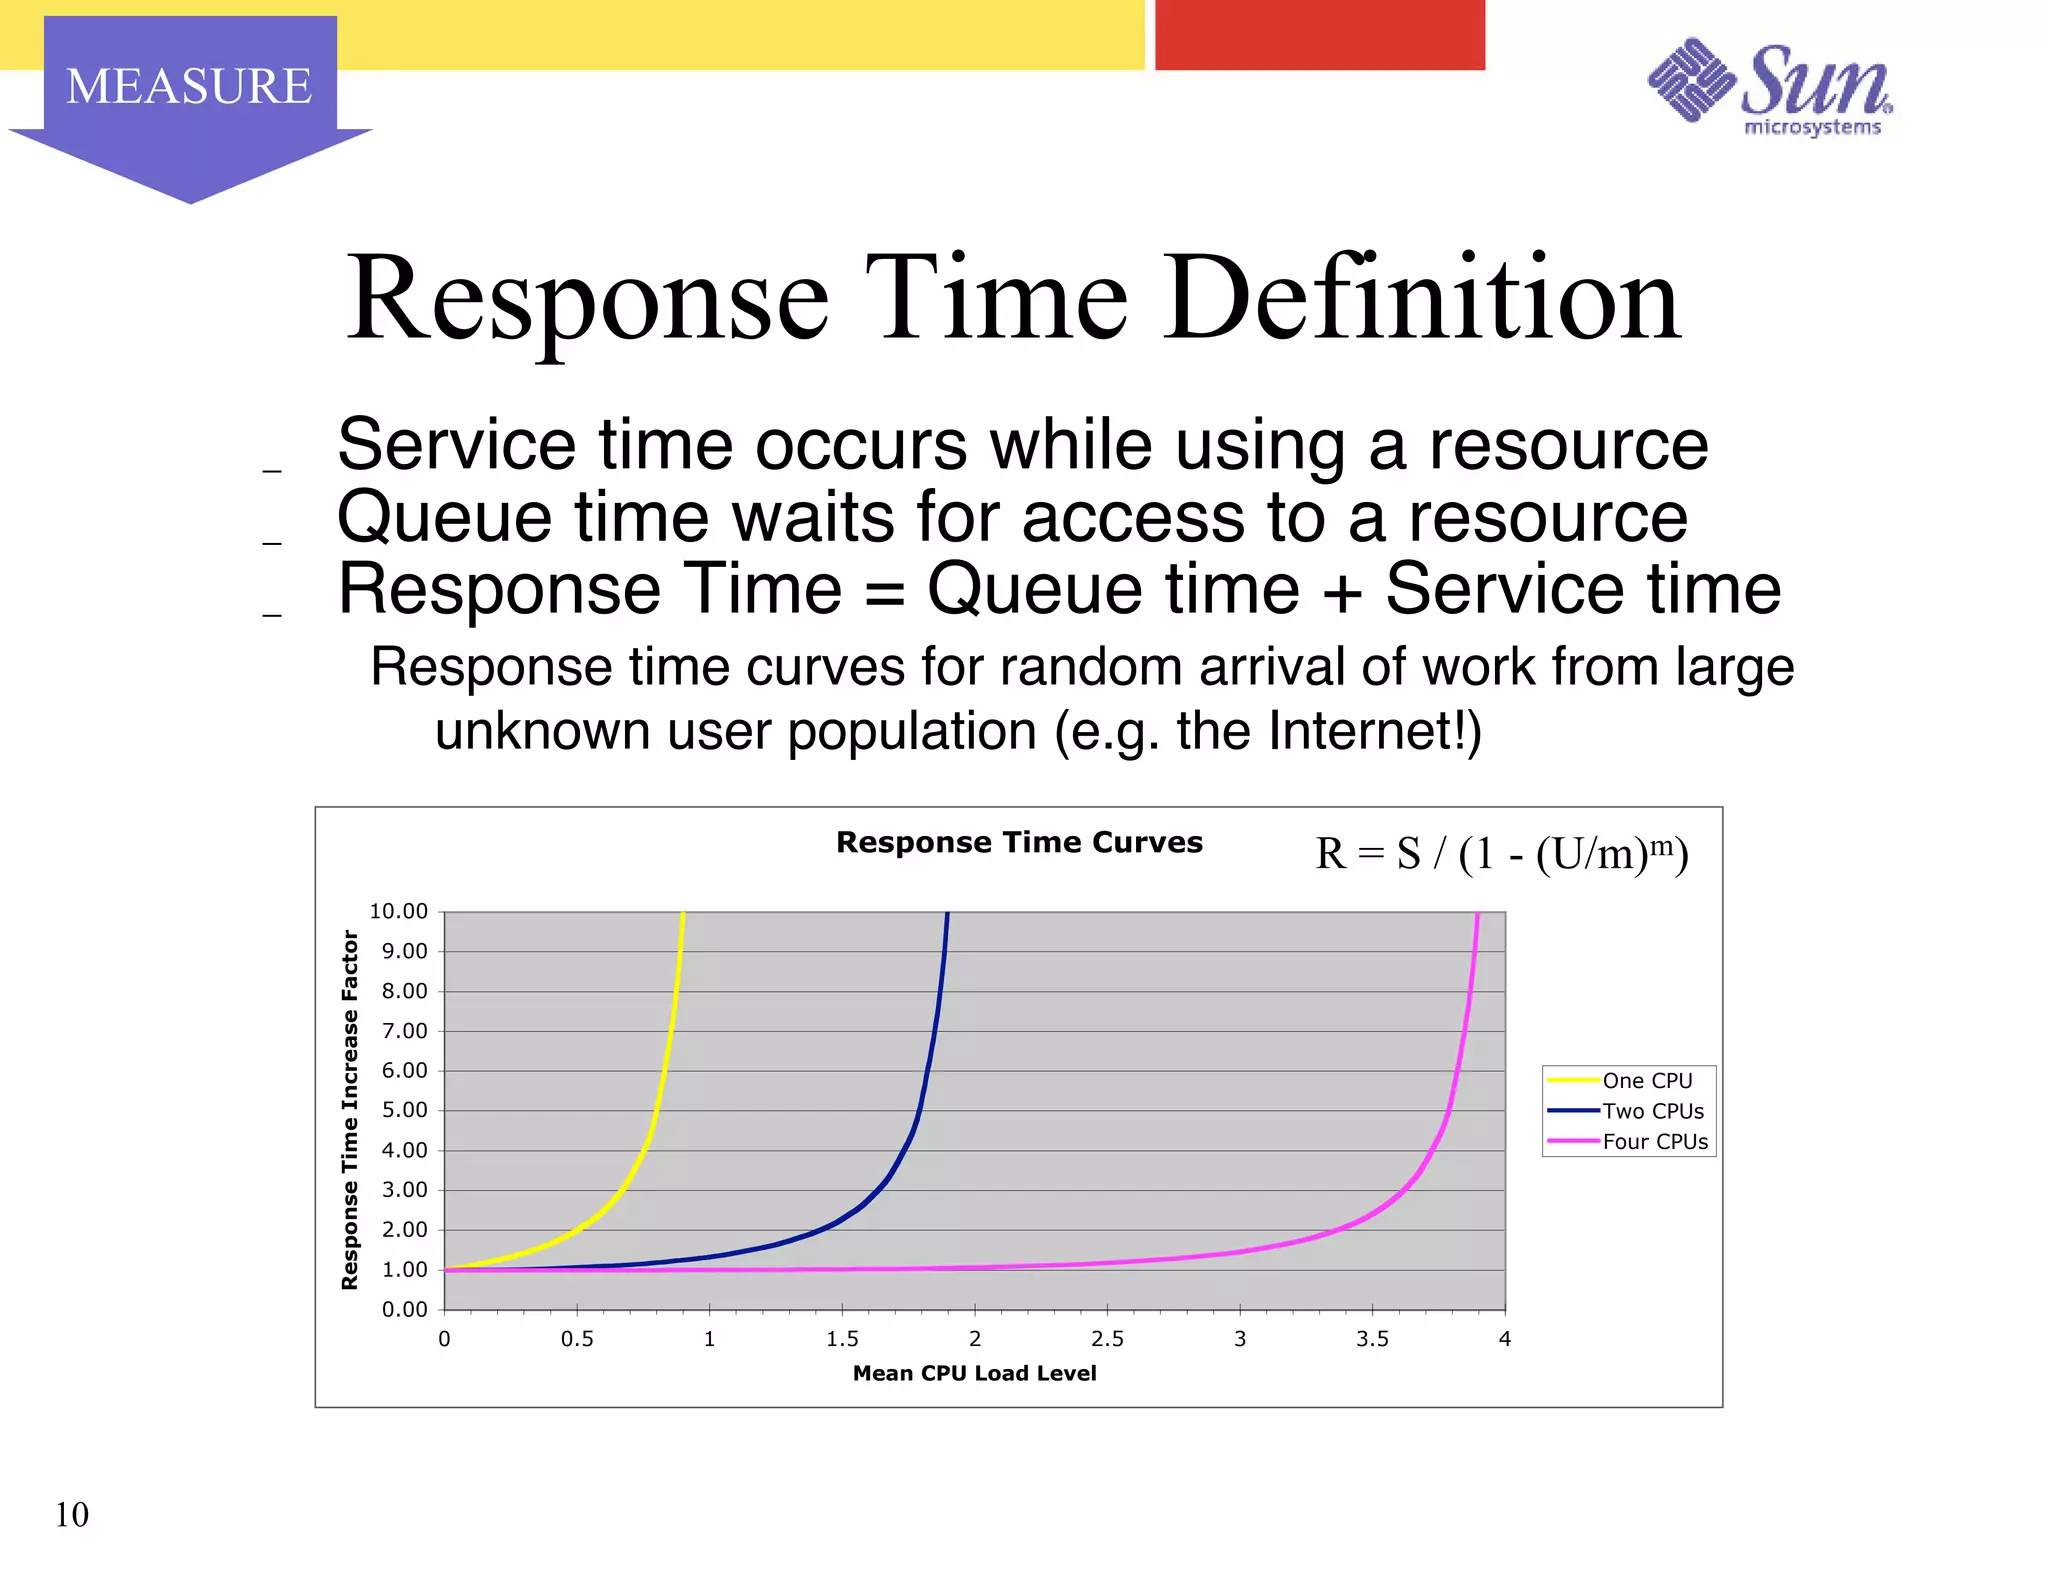
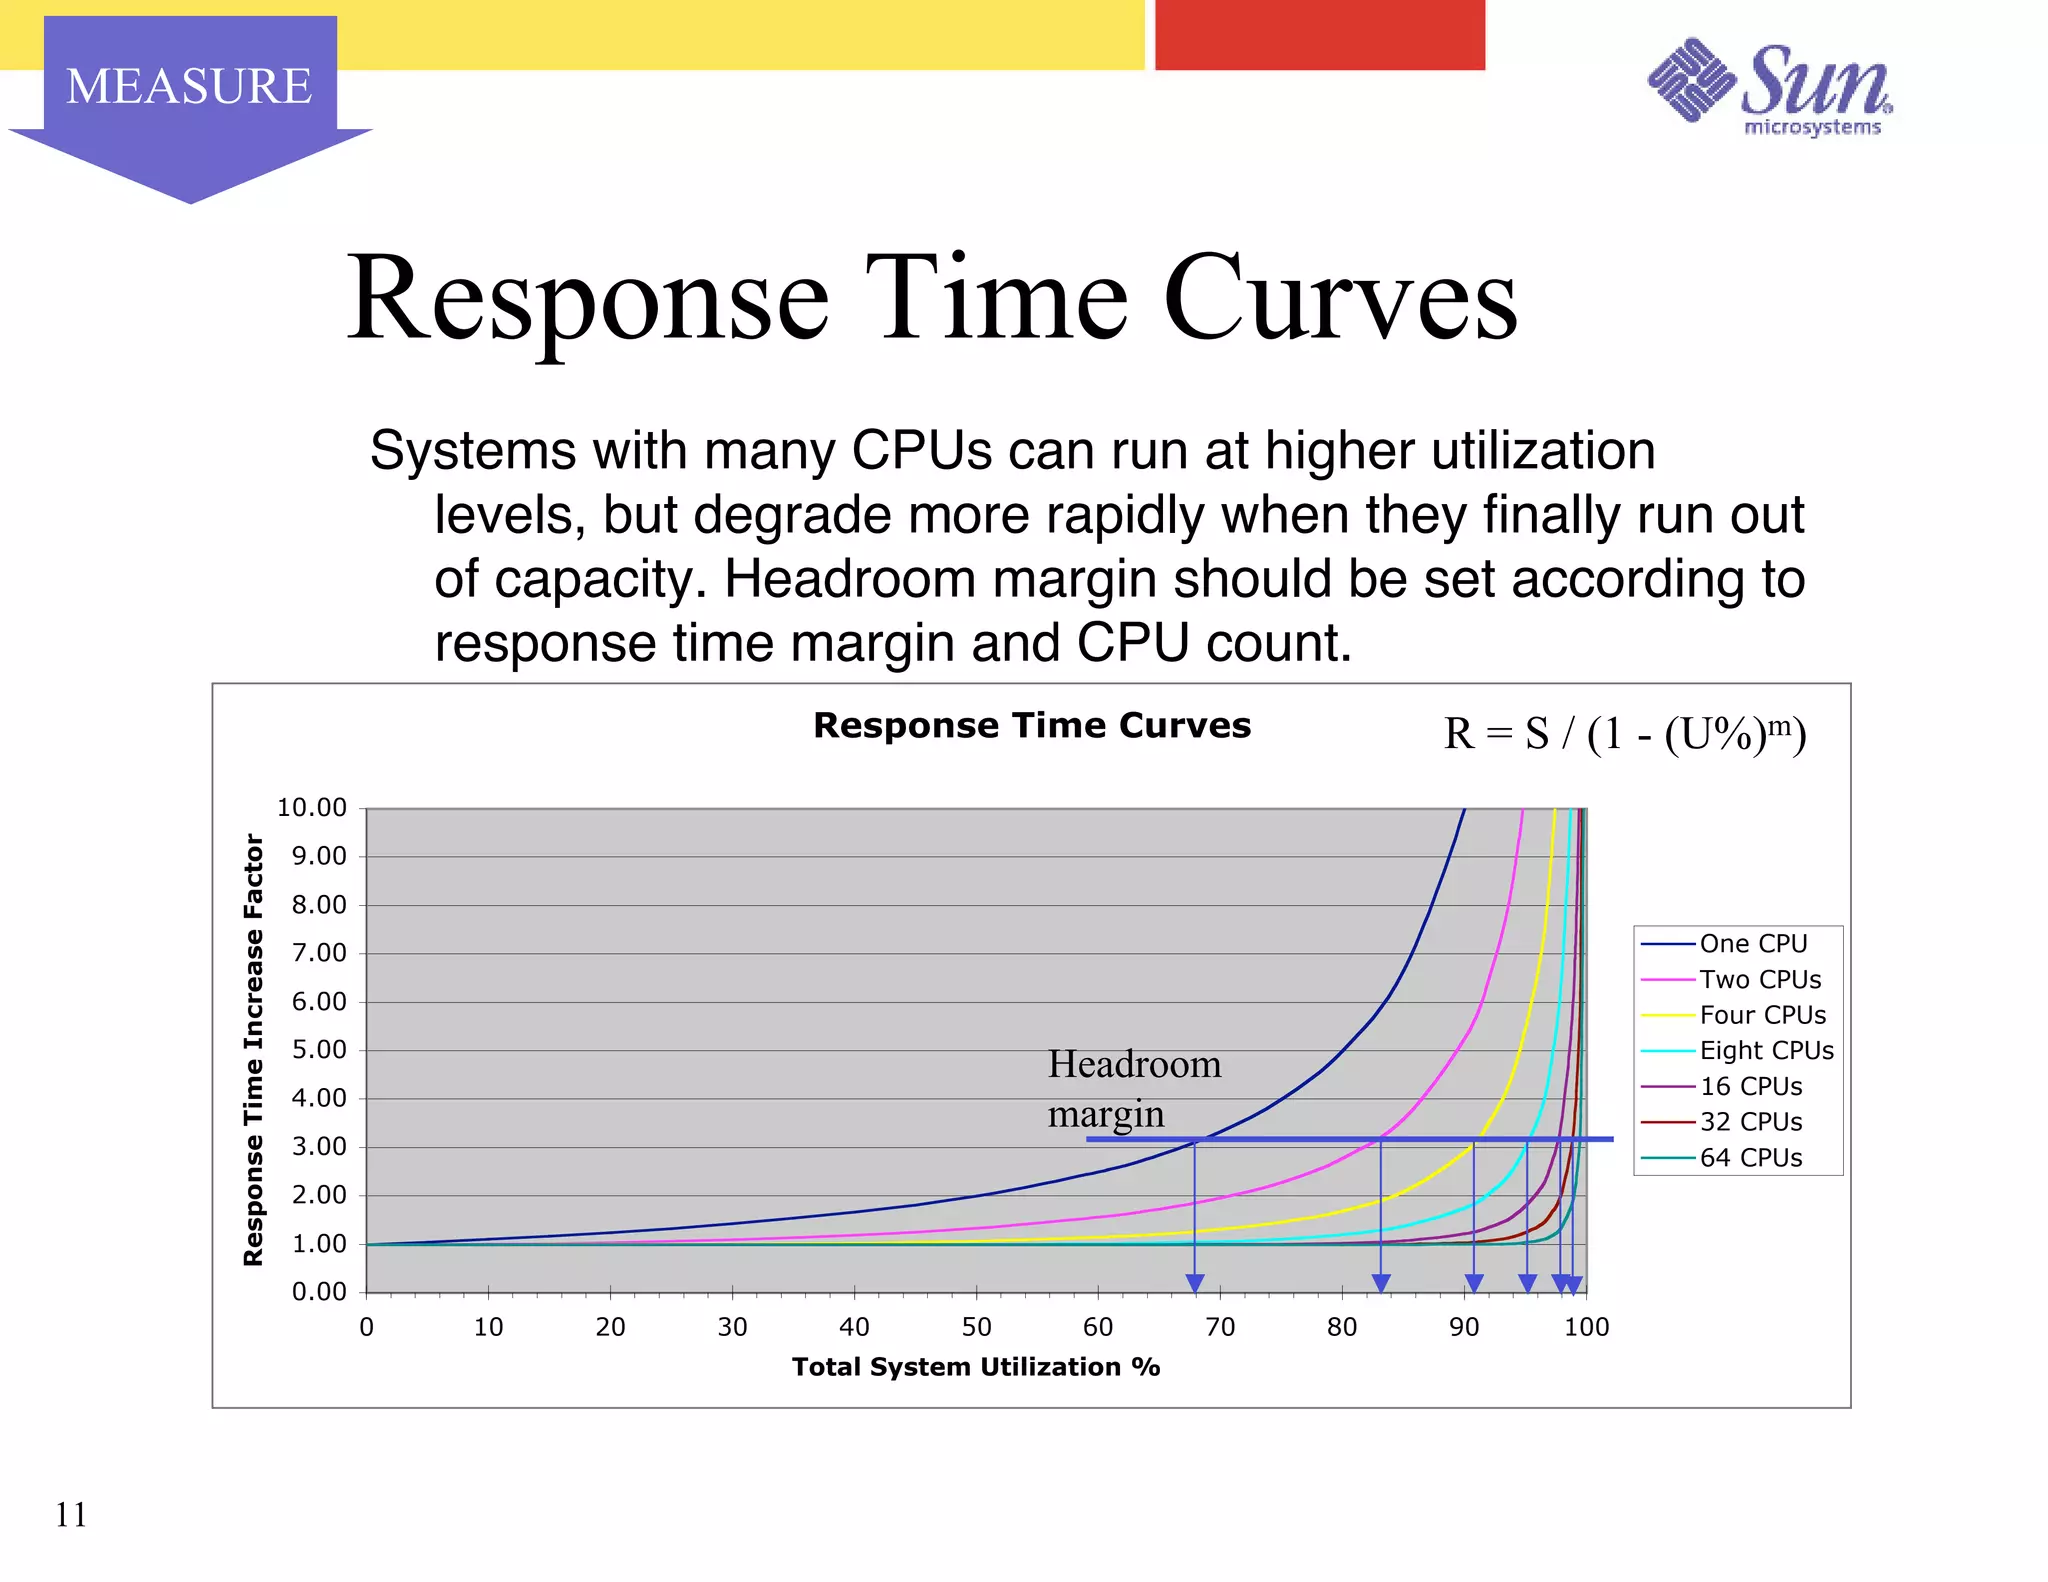
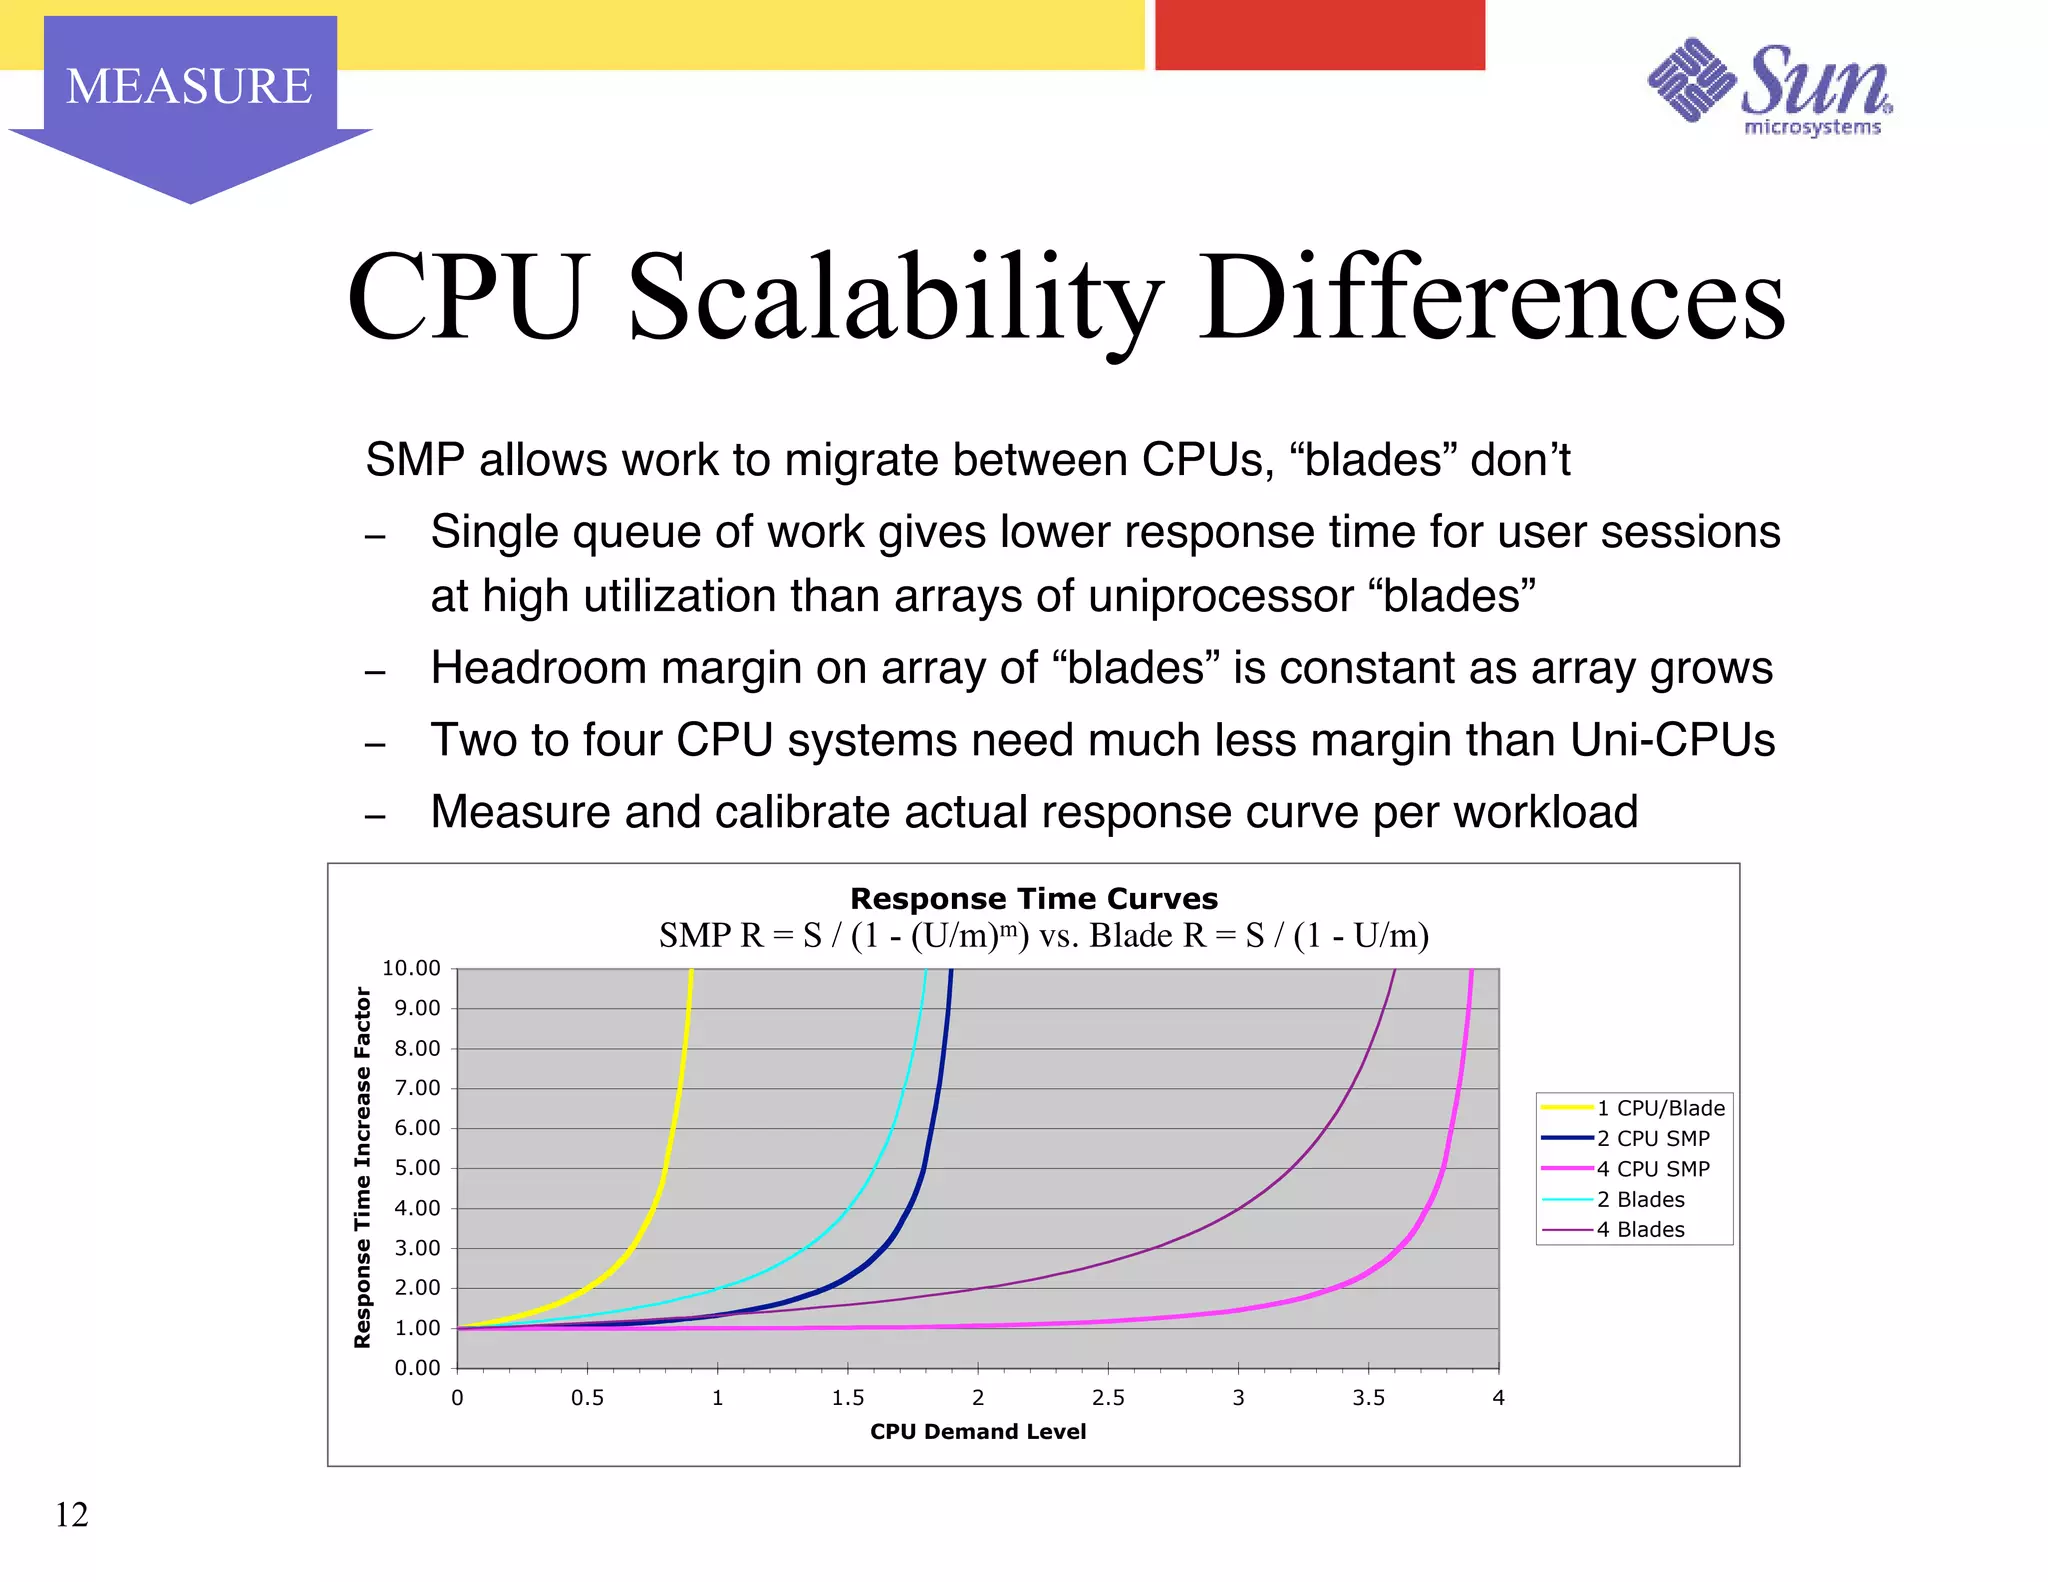
Download as PDF, PPTX

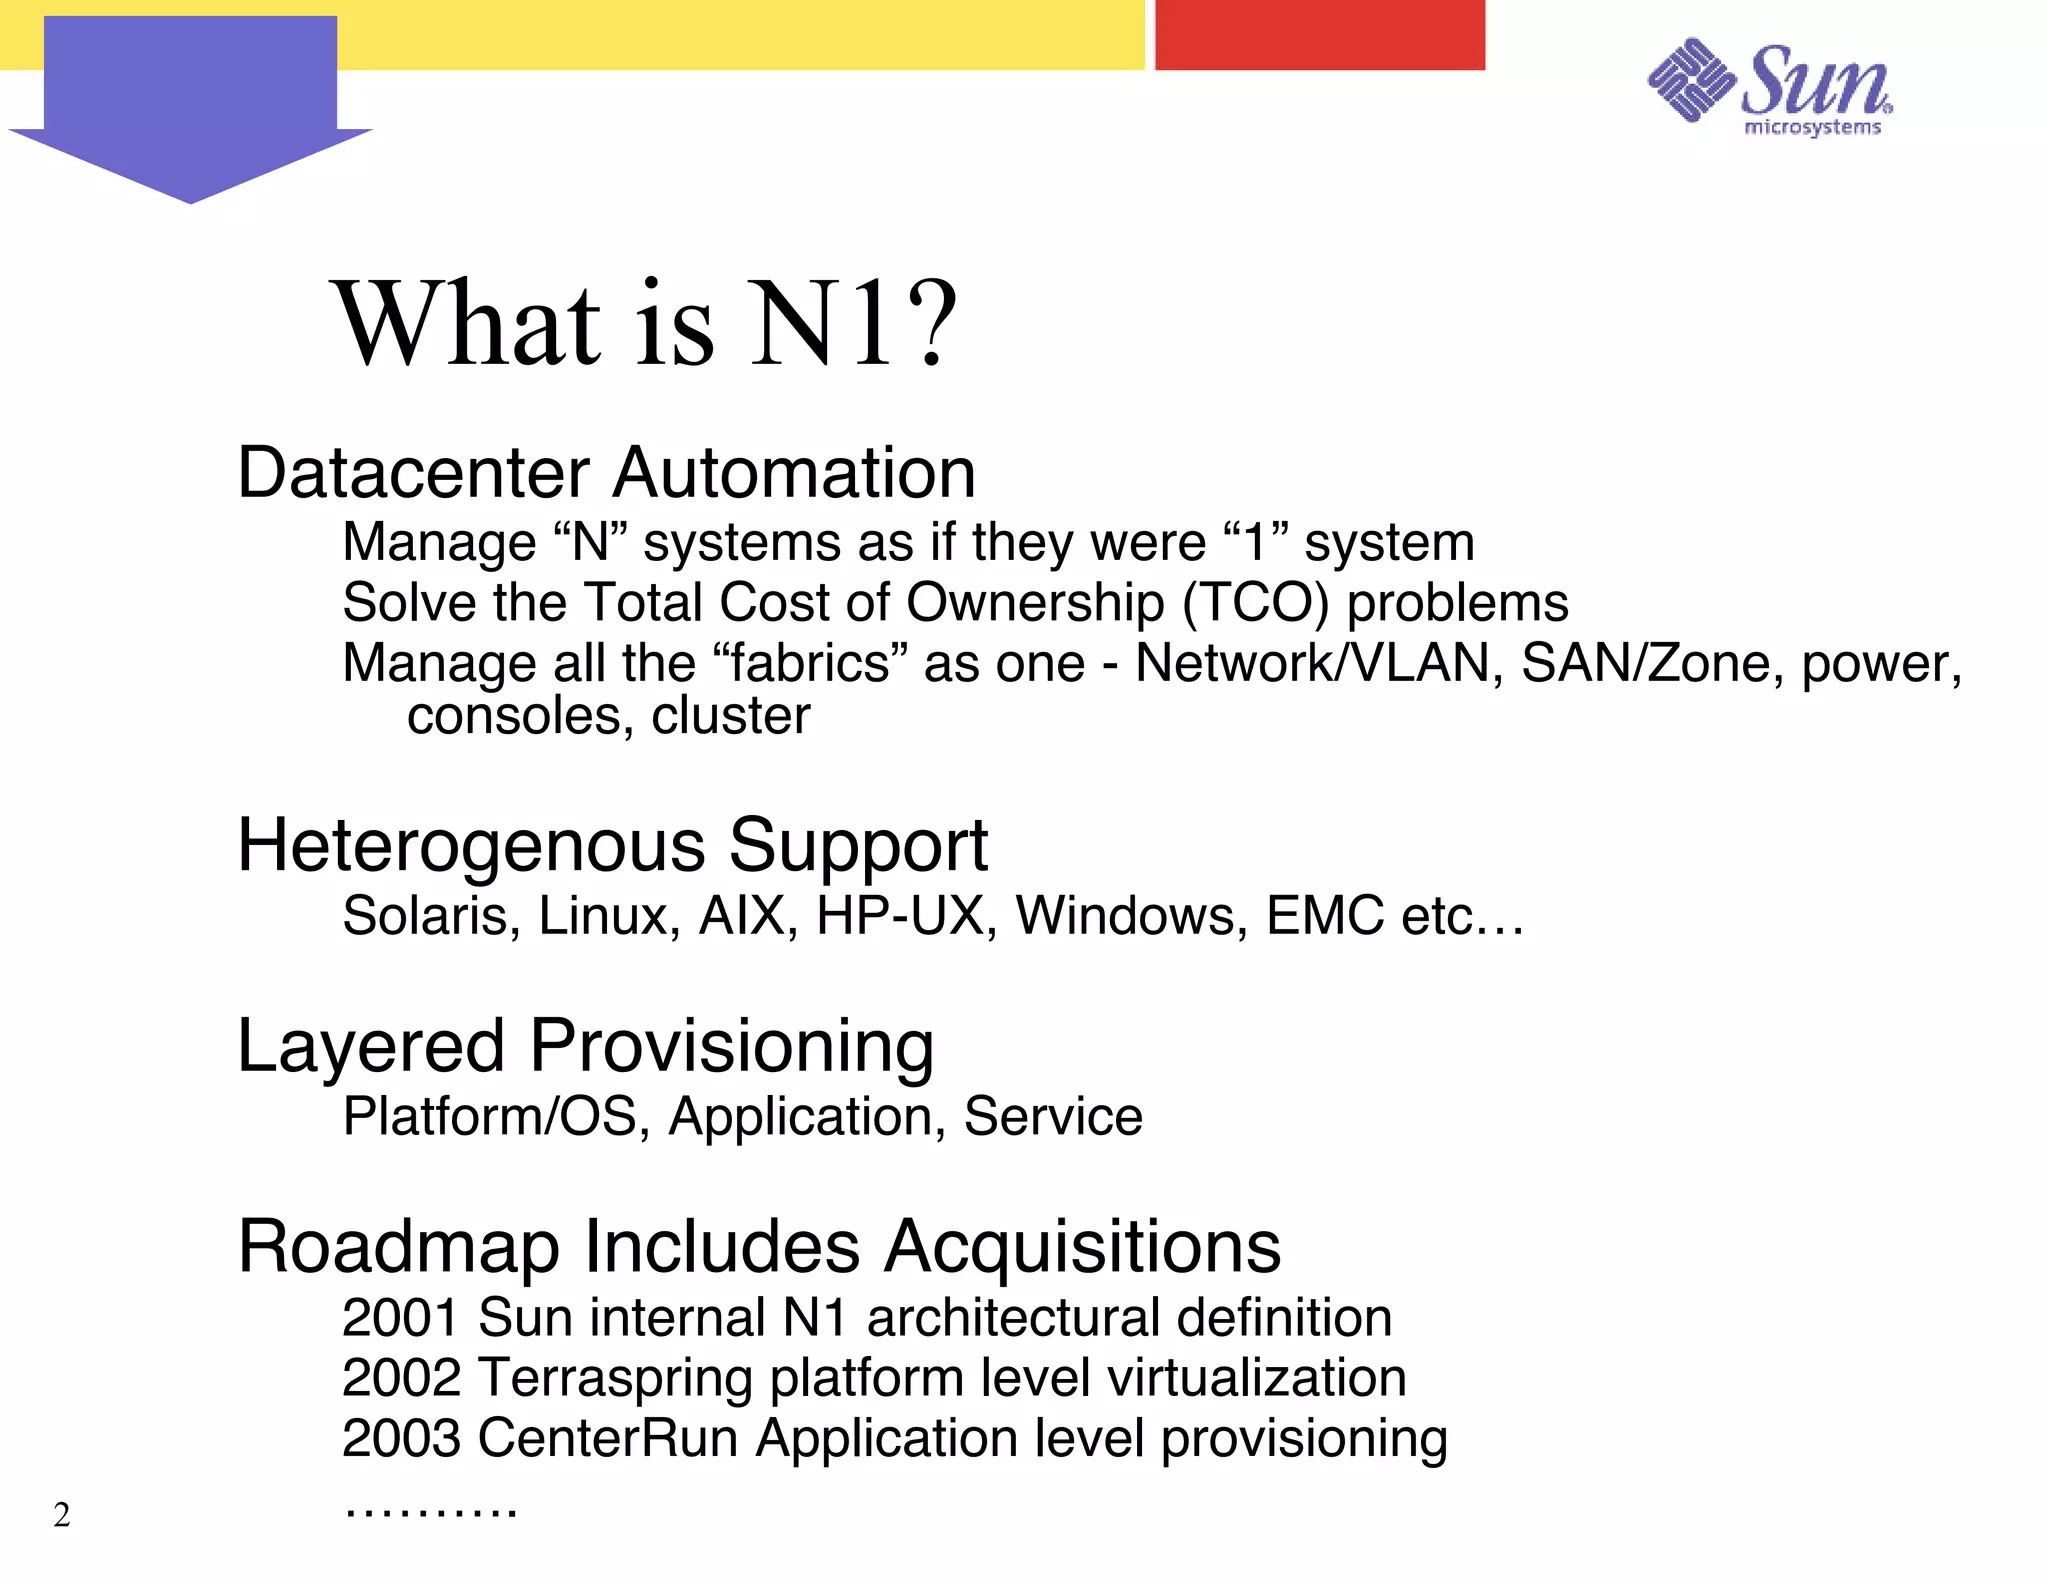
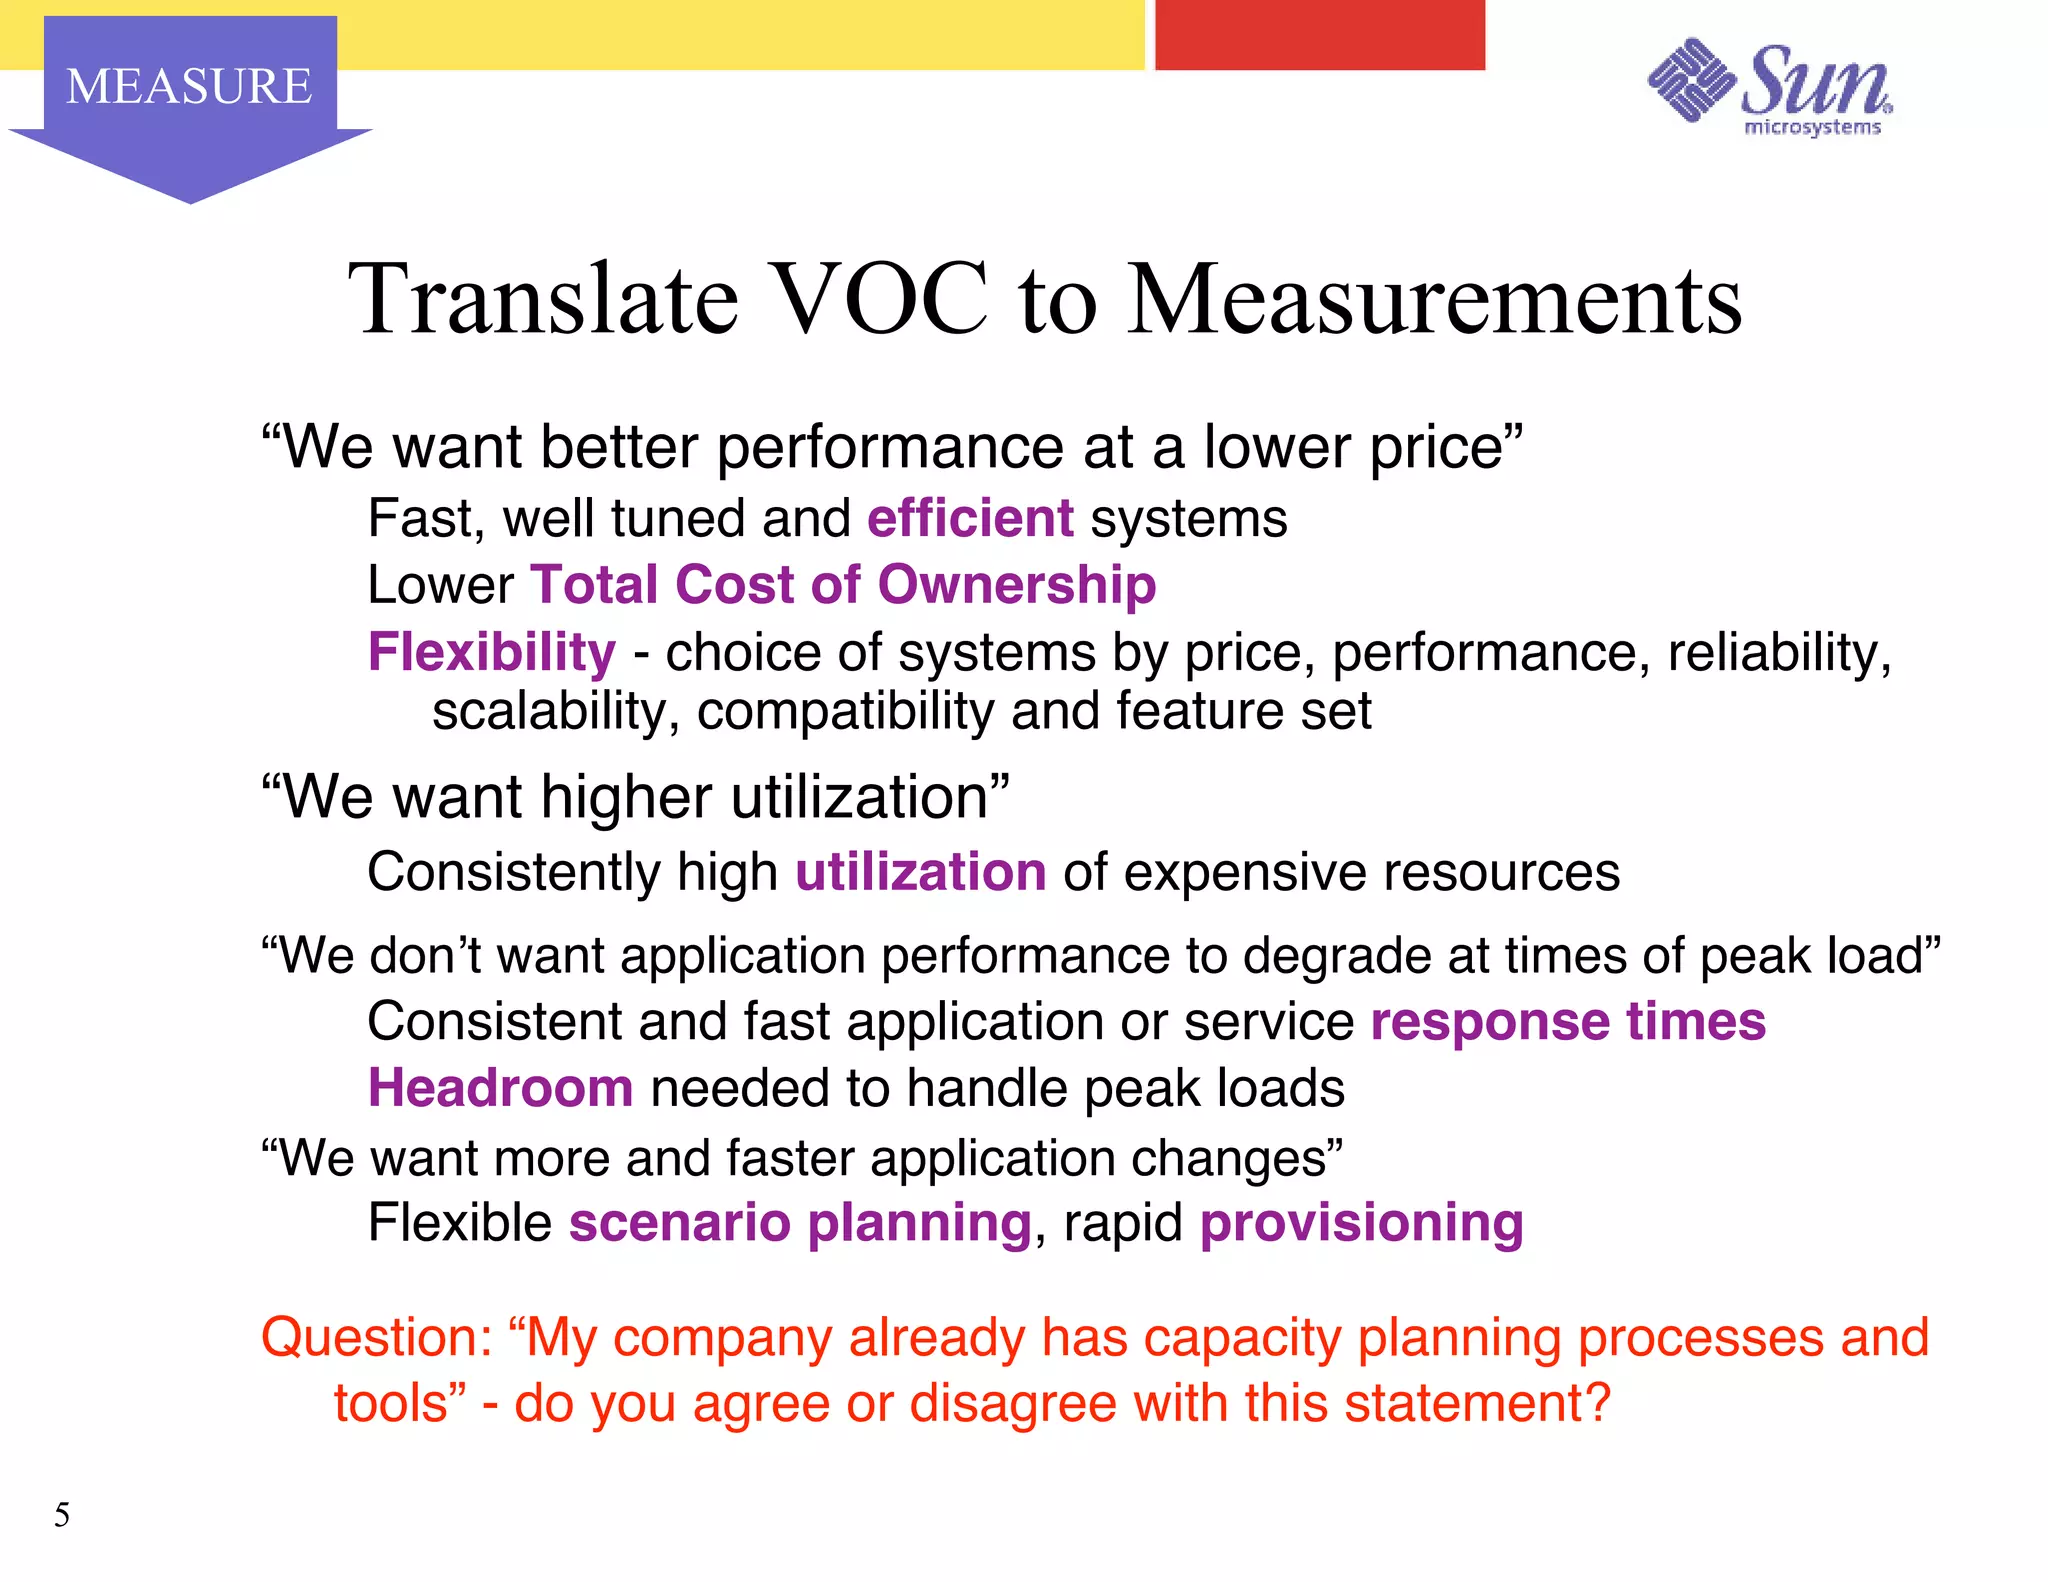
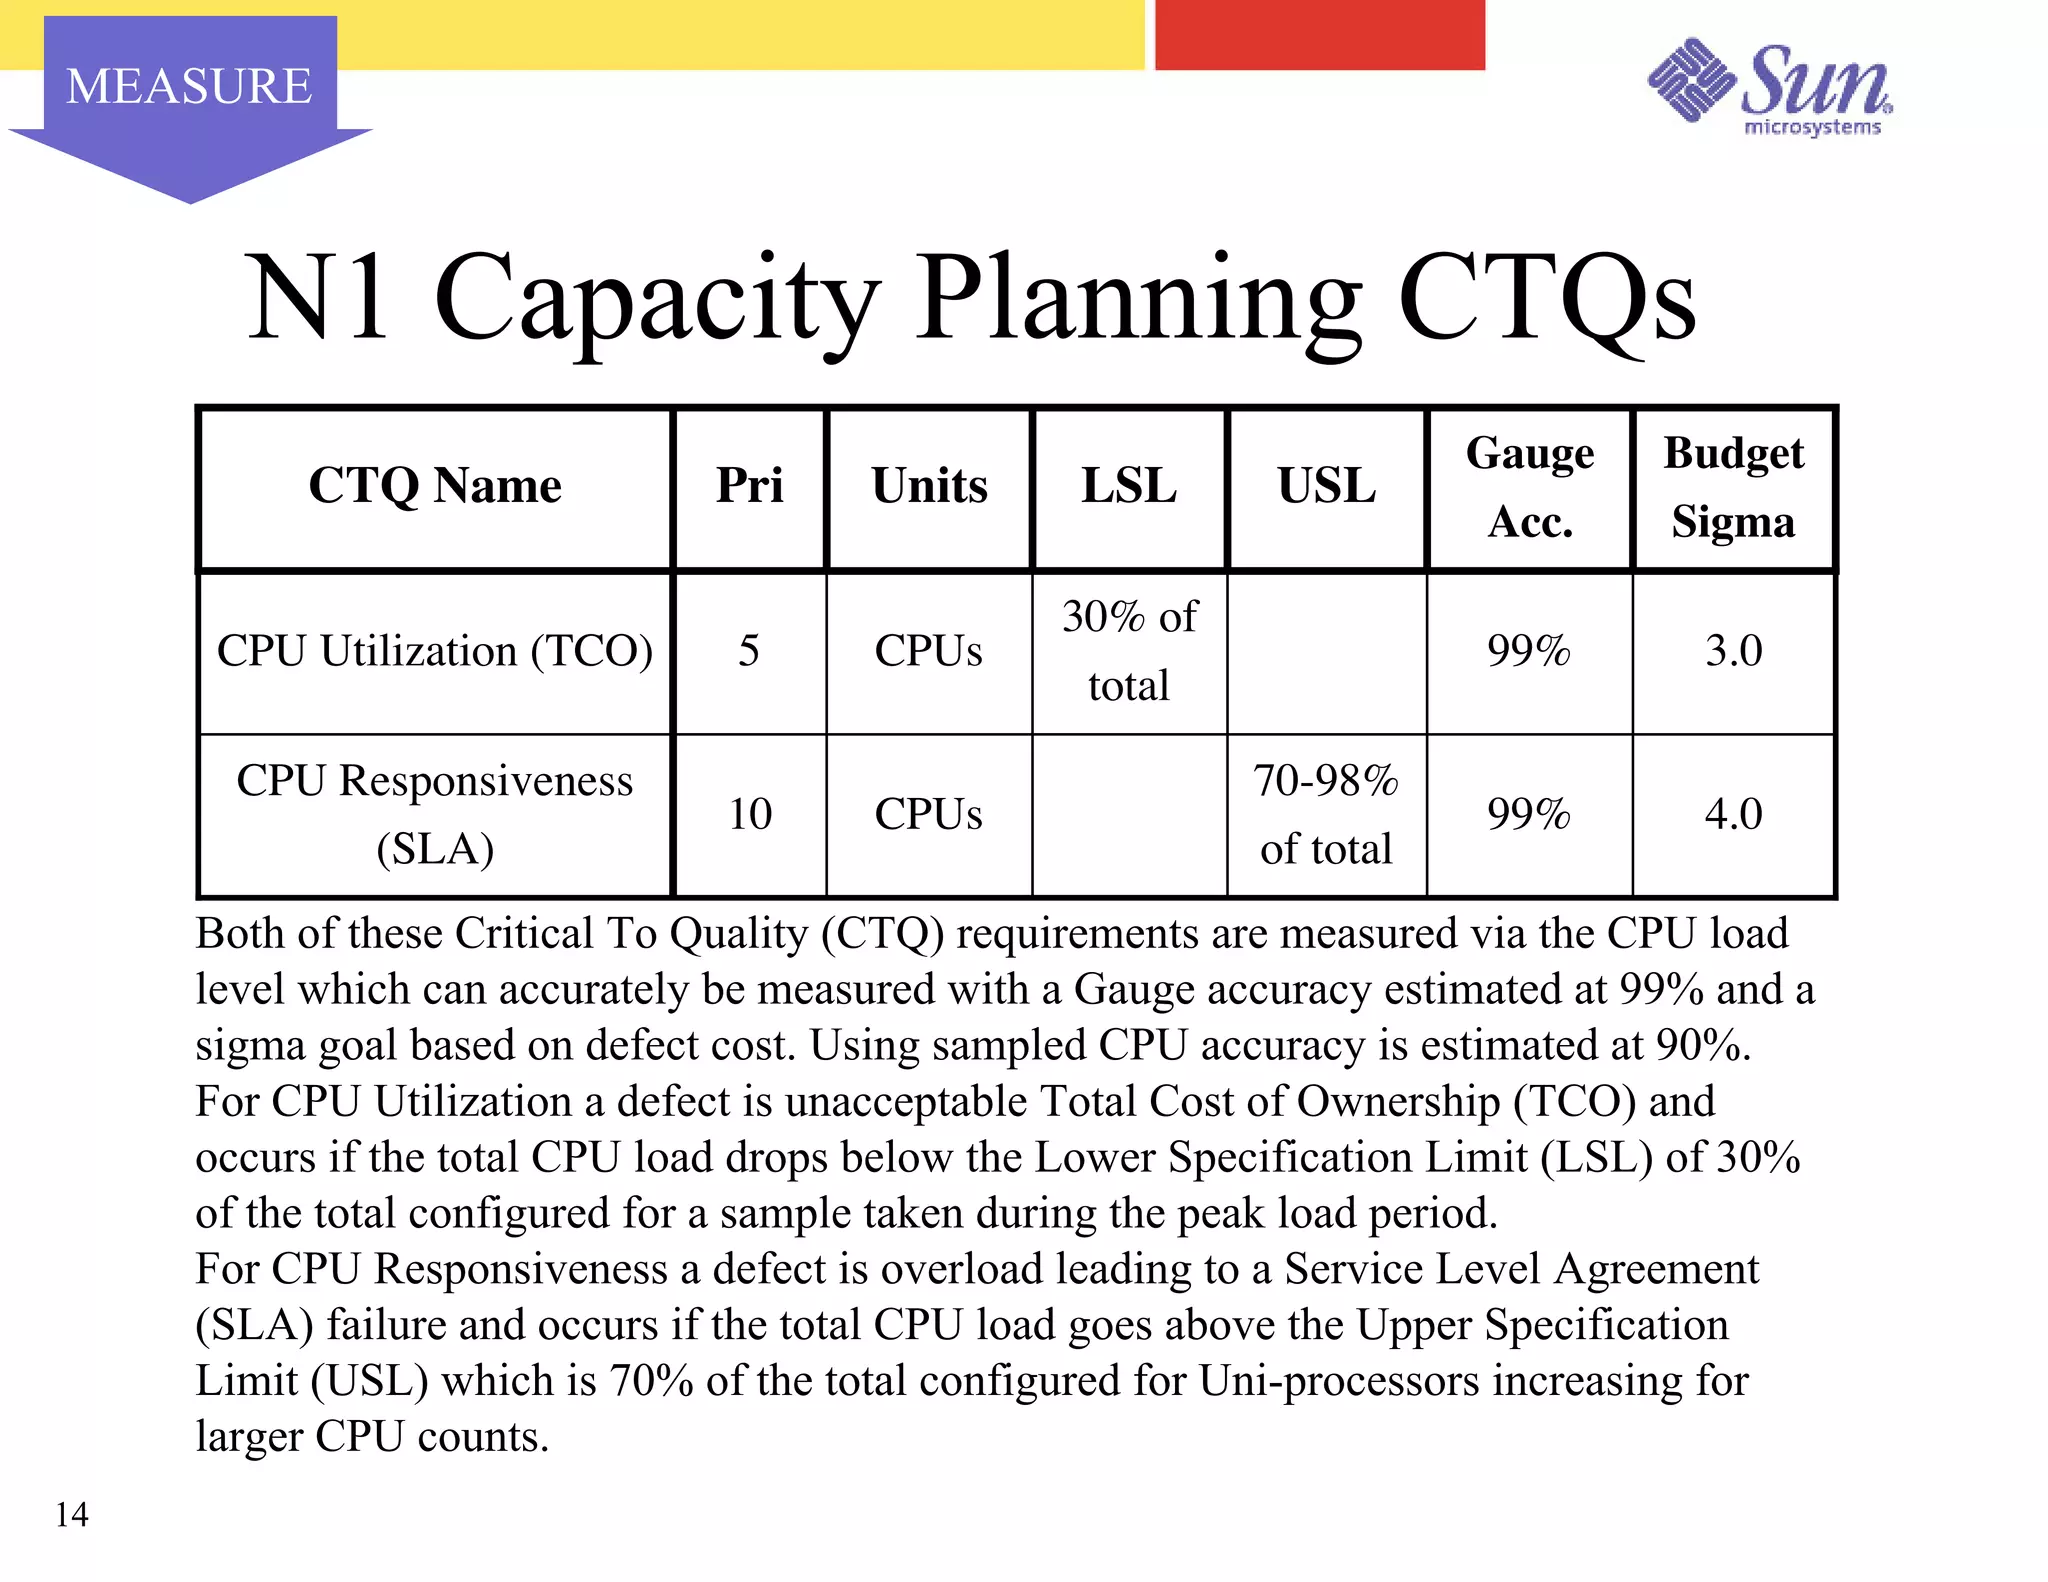
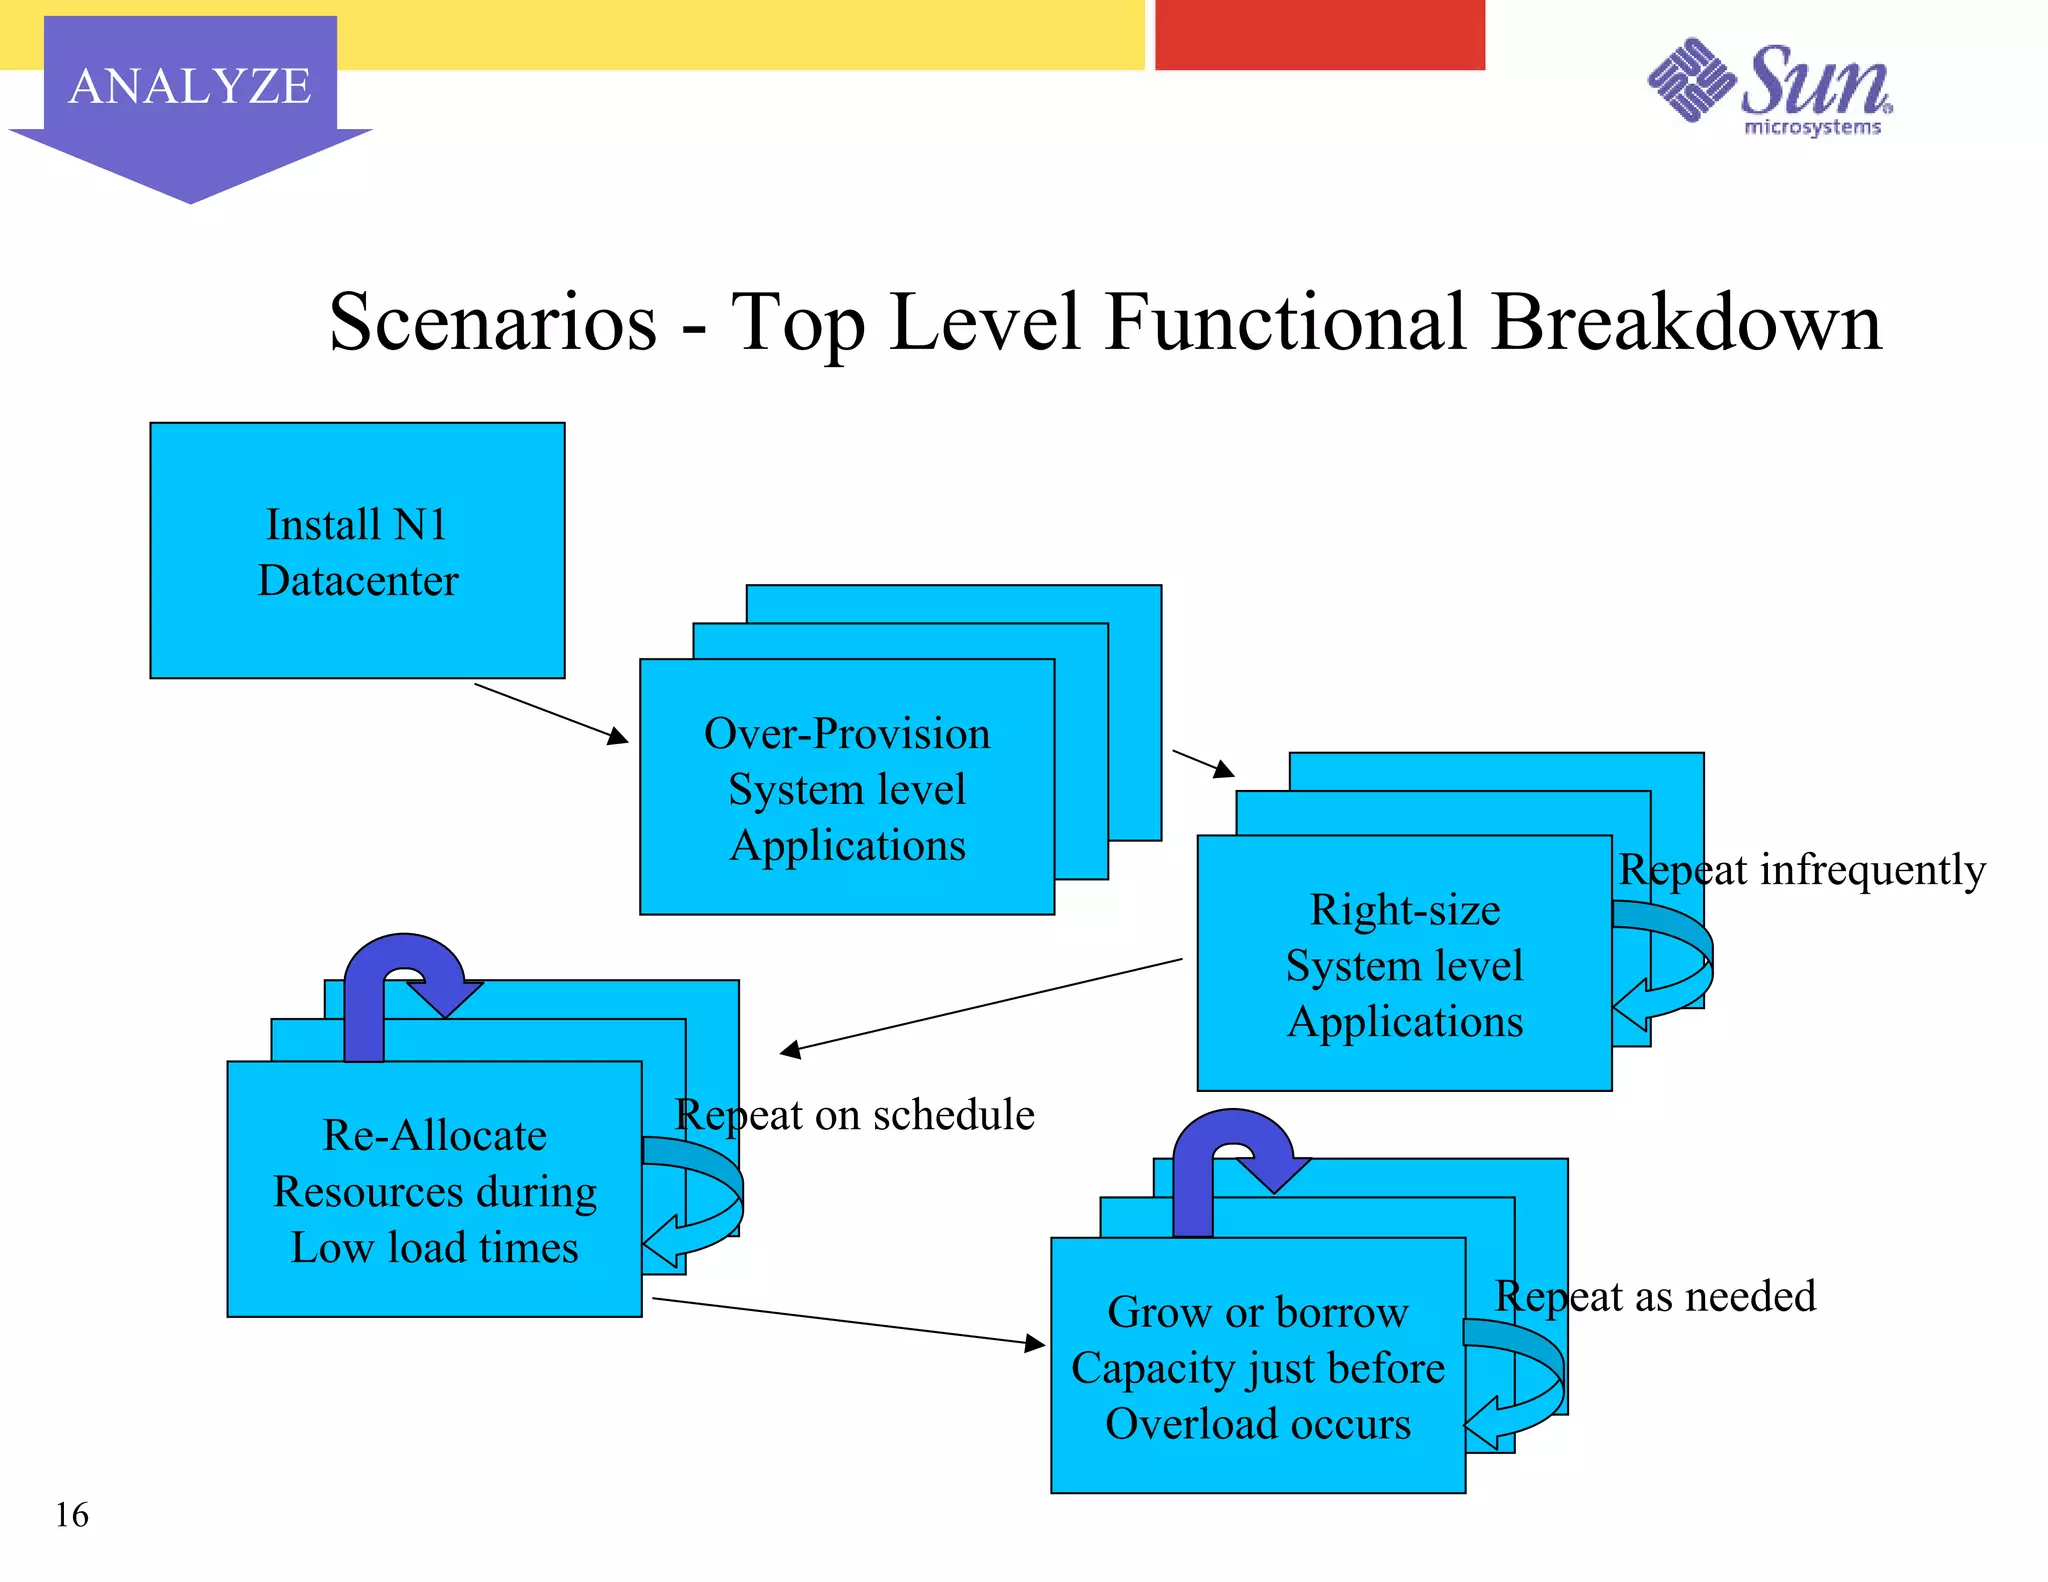
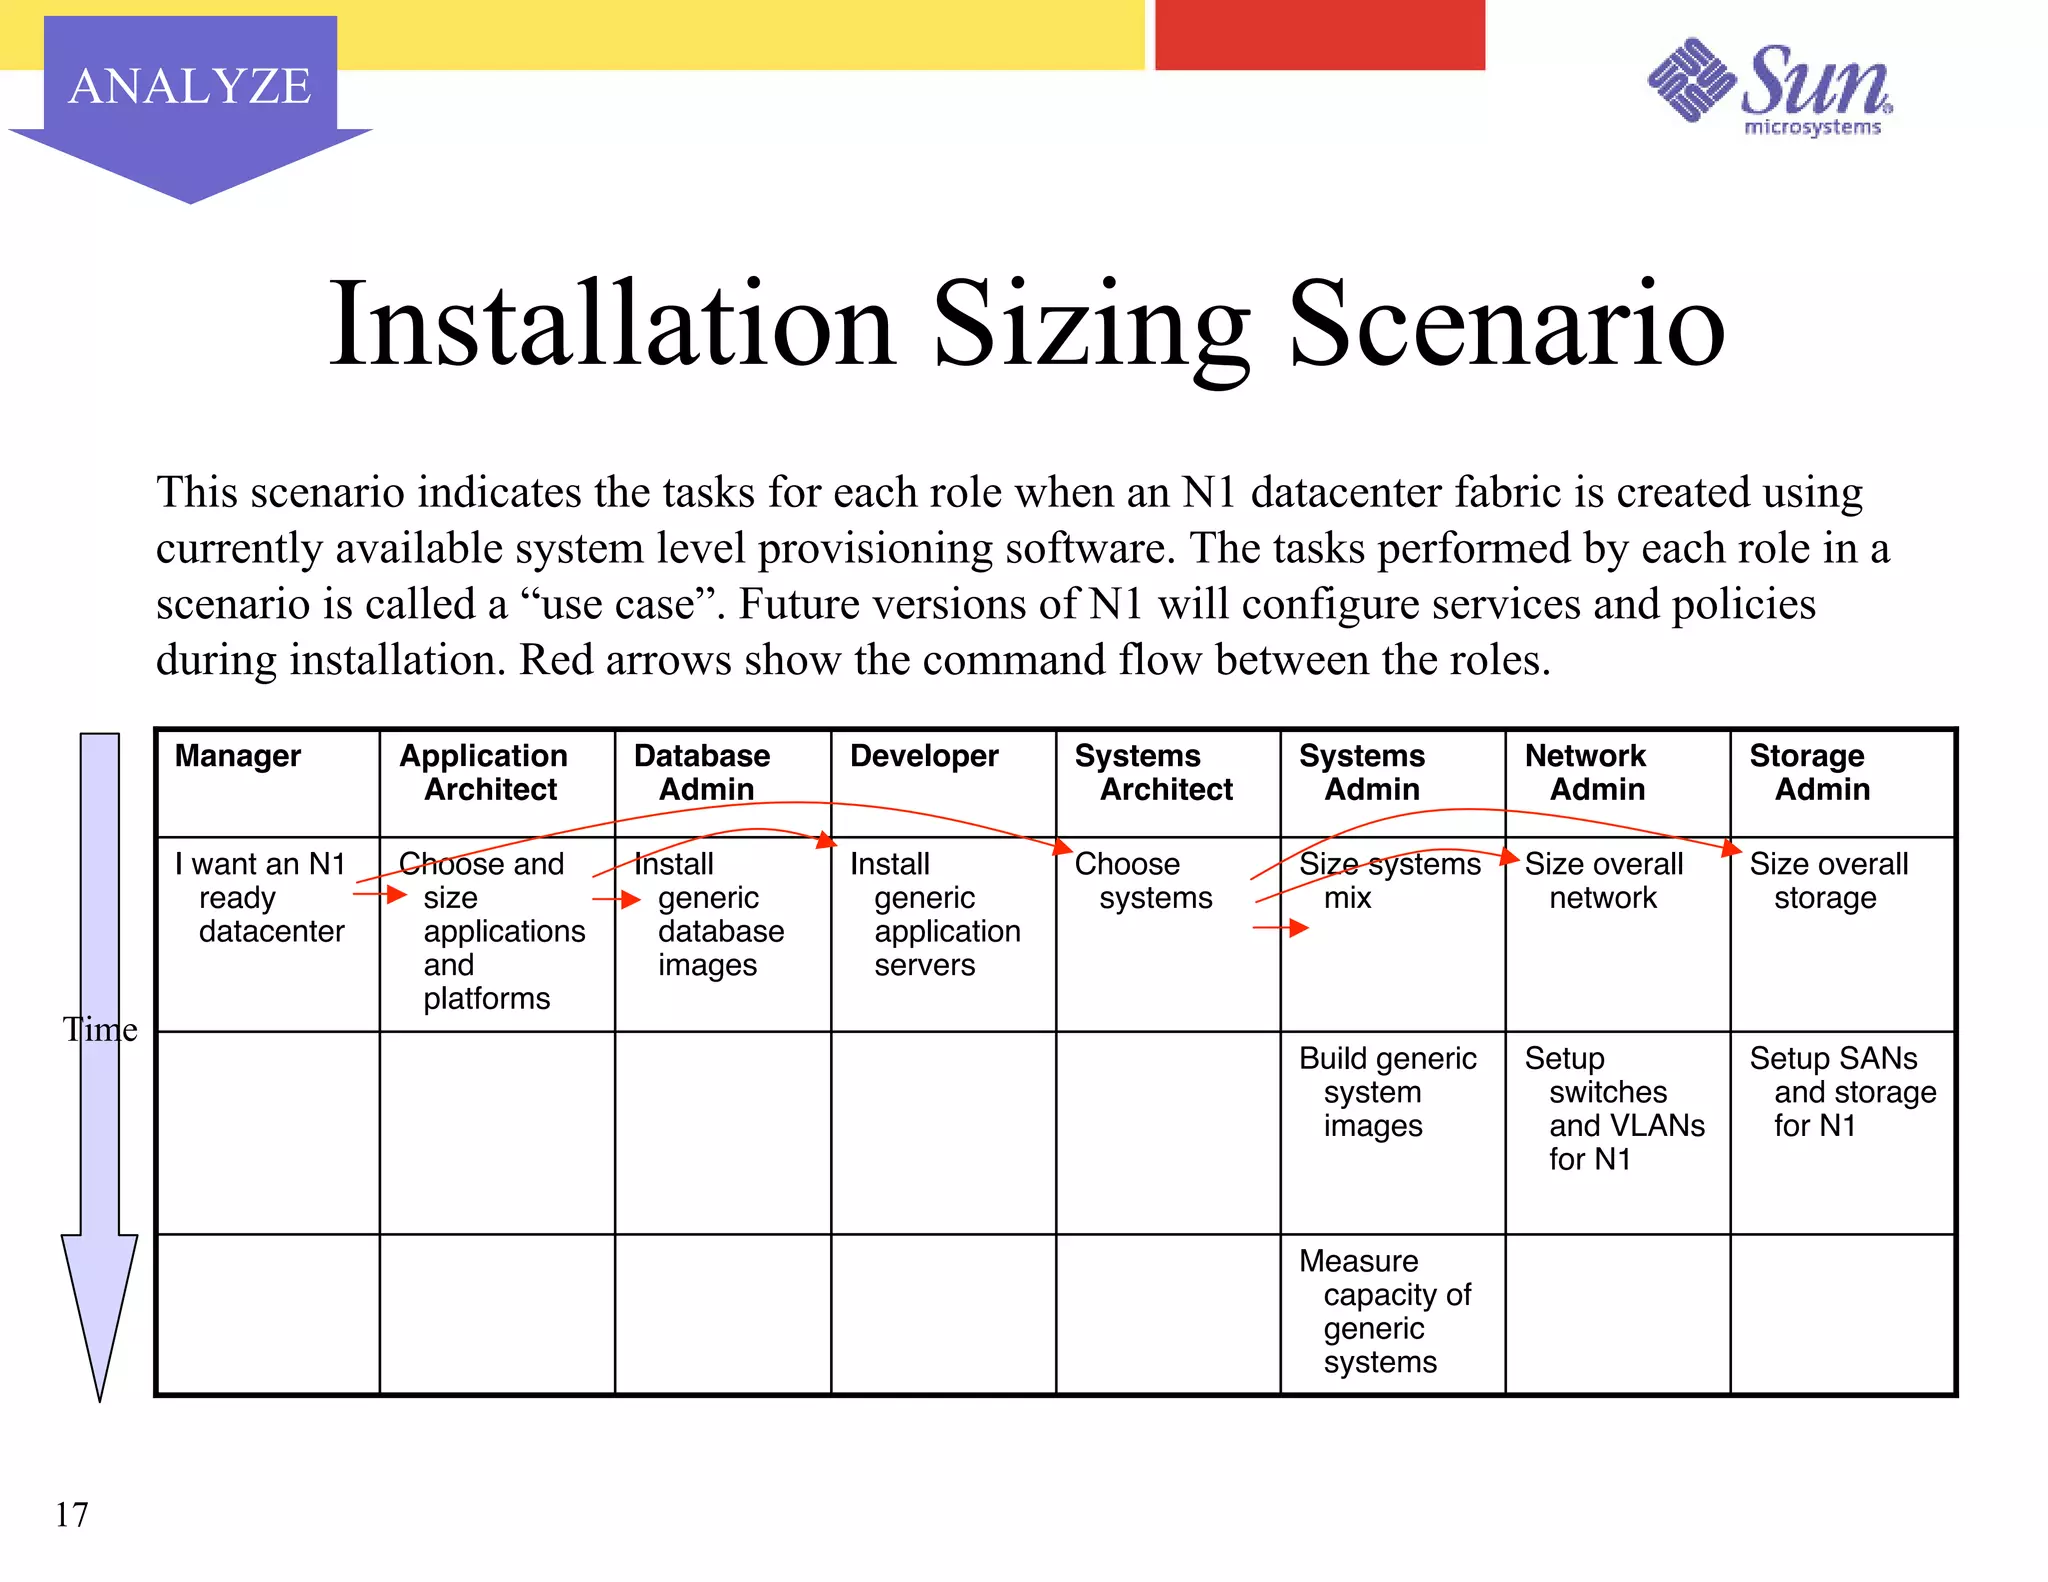
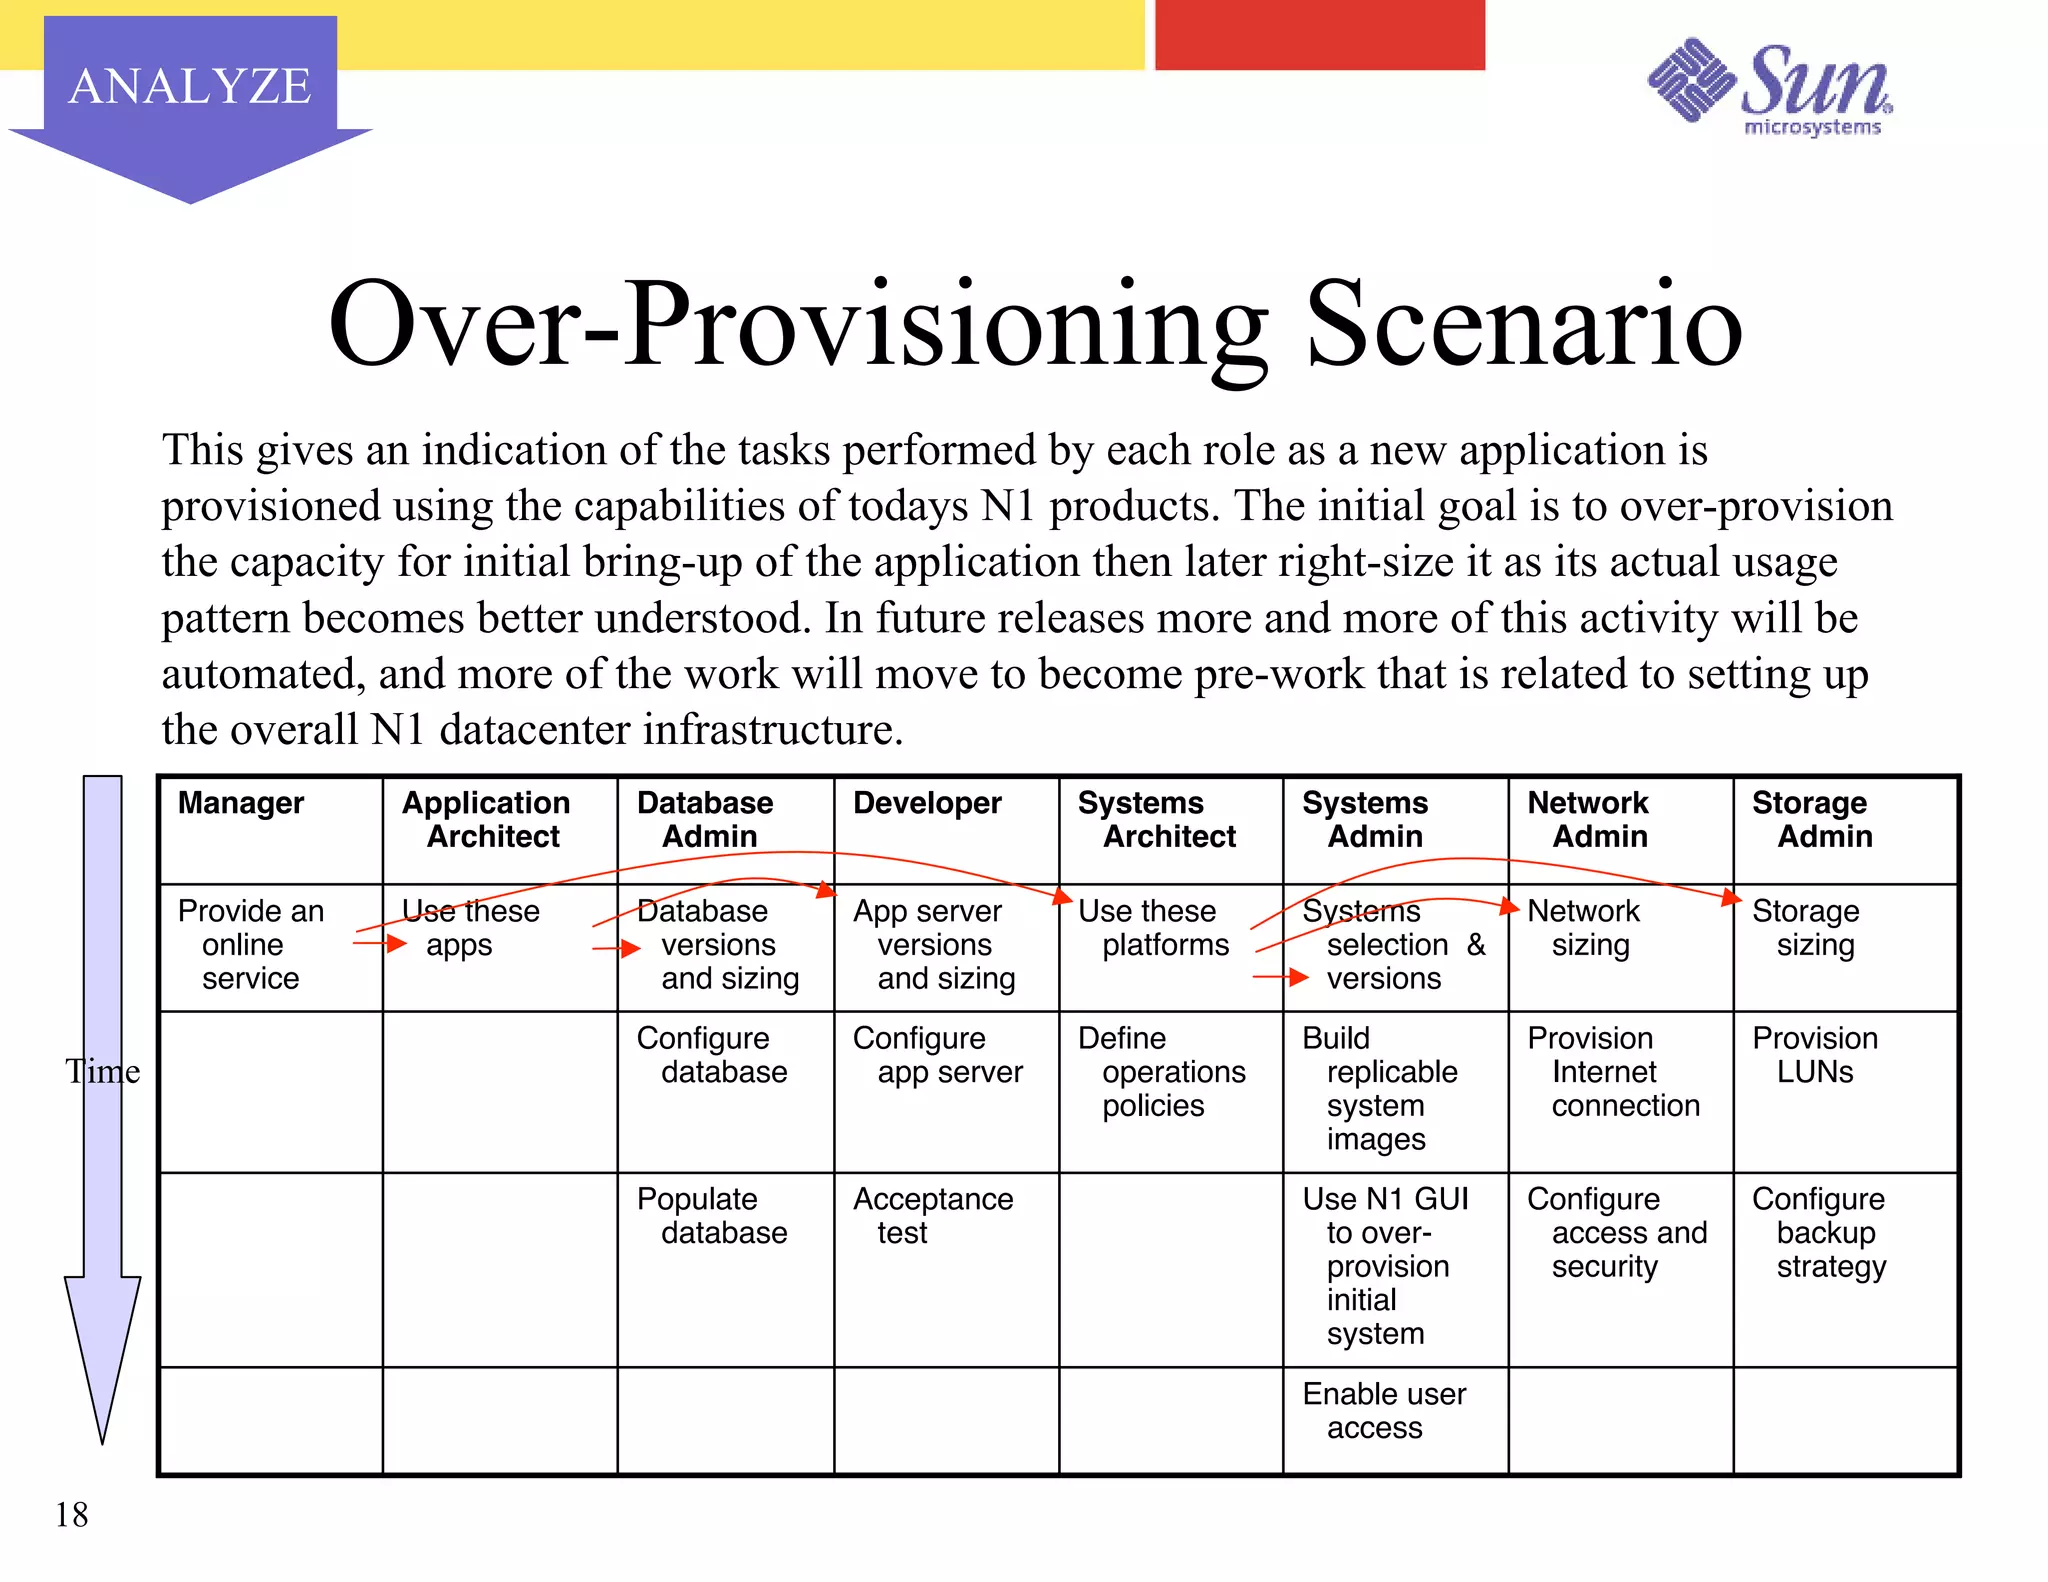
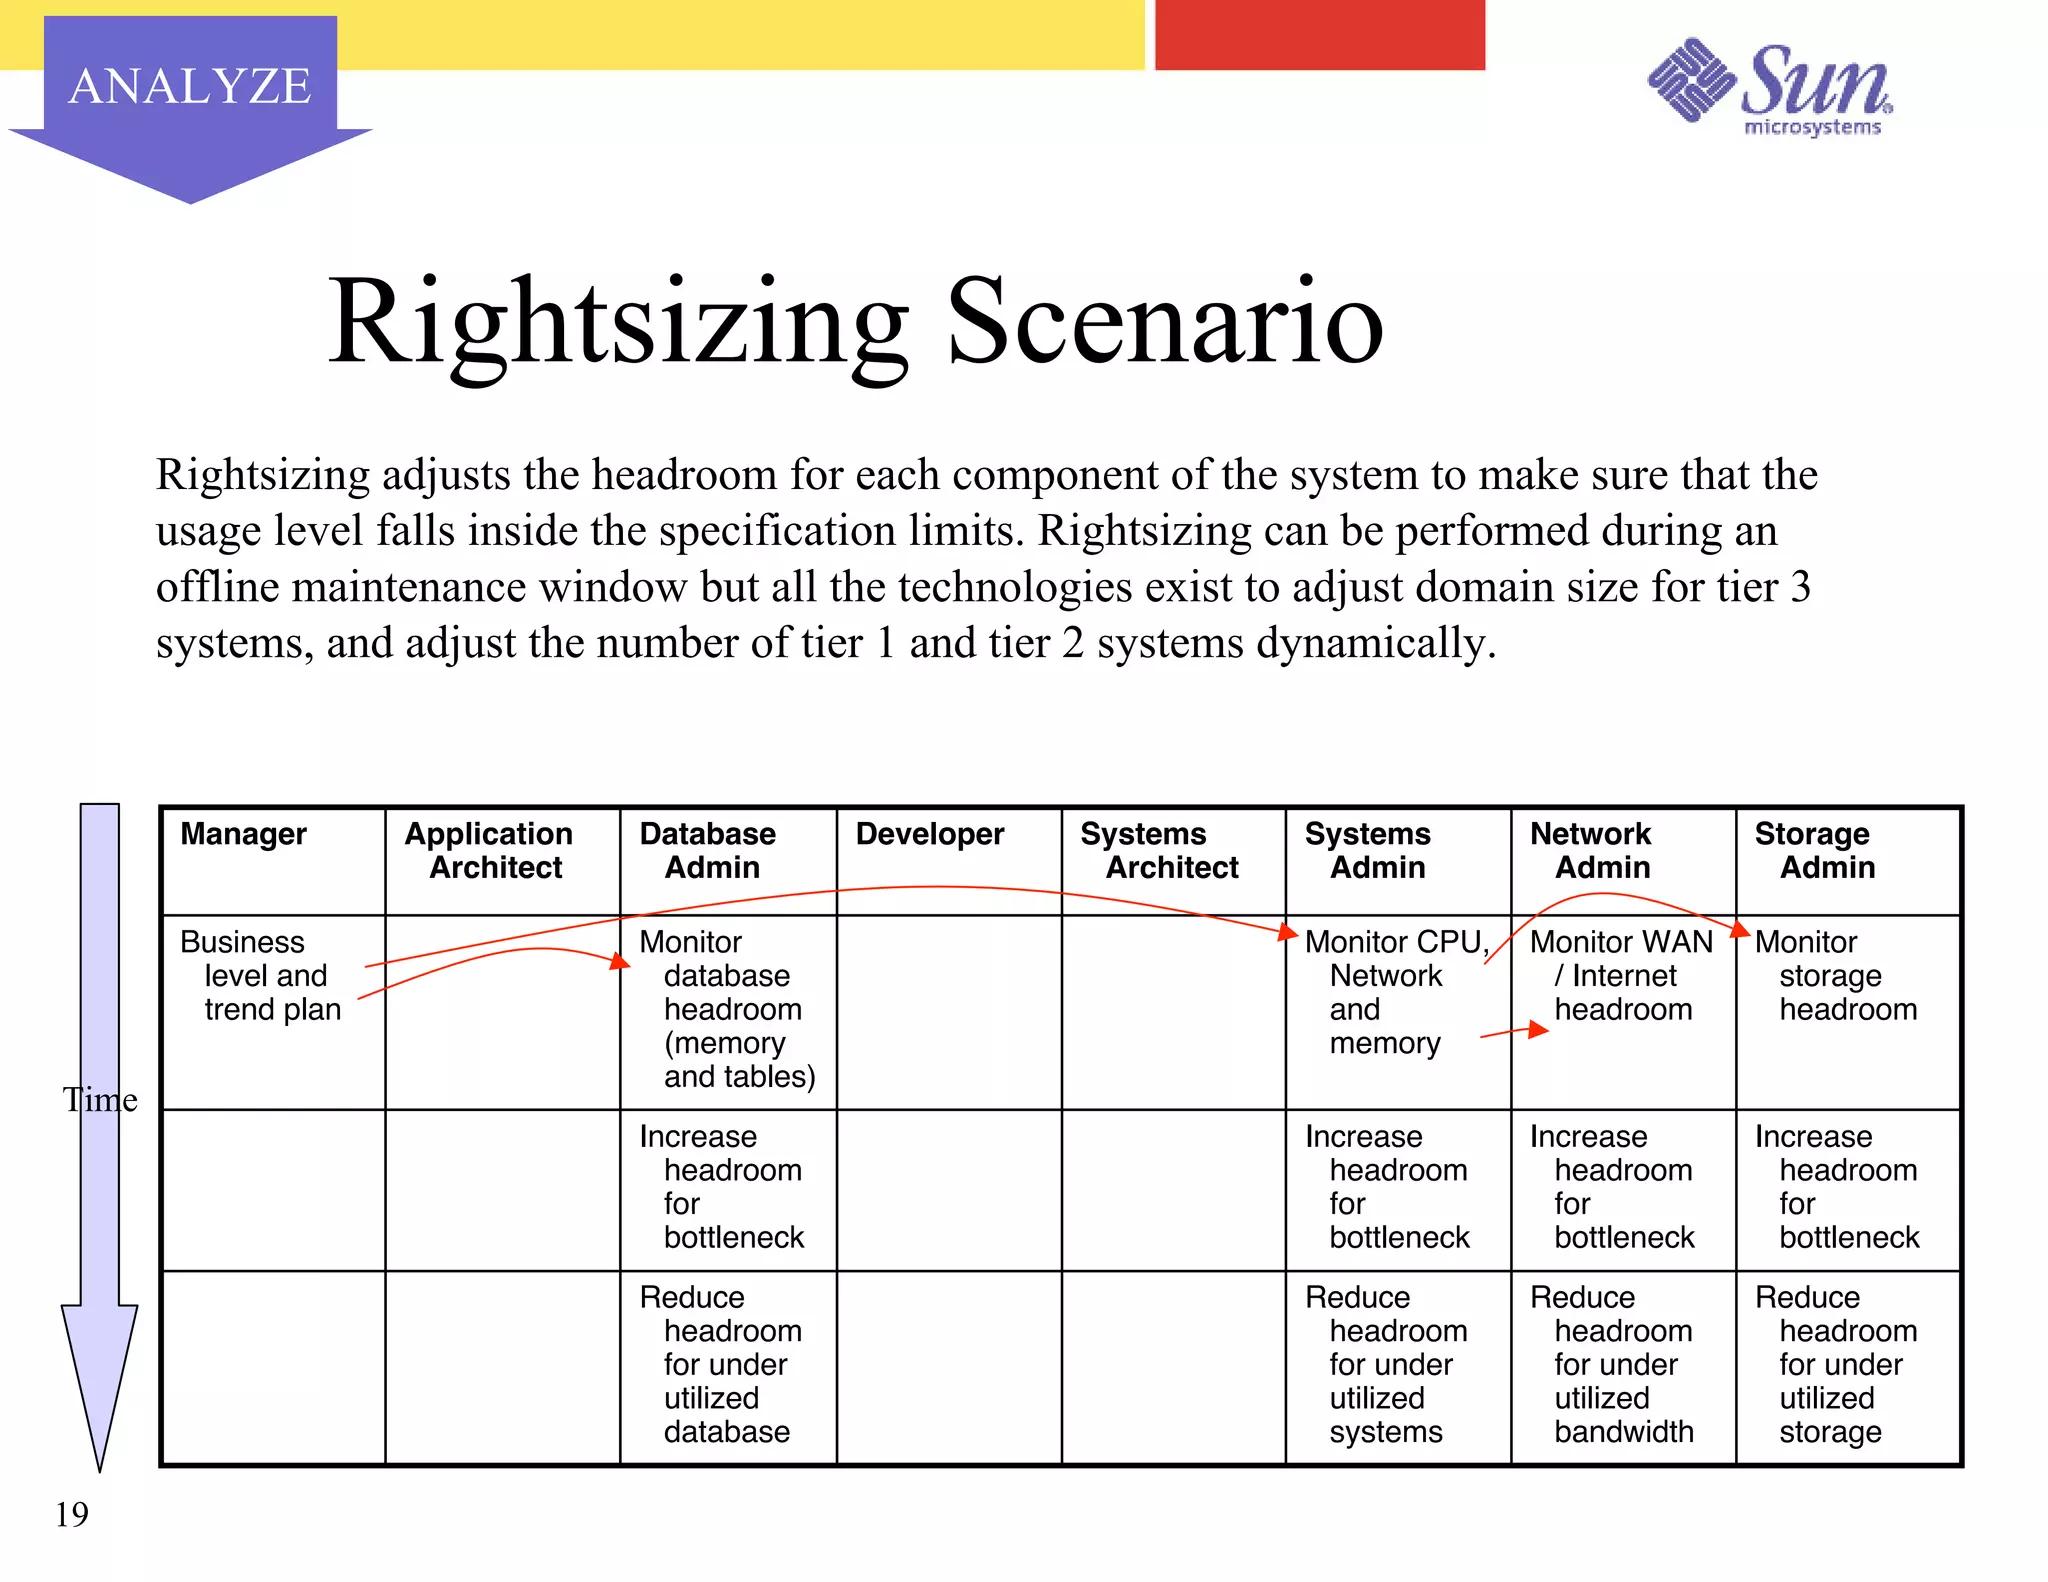
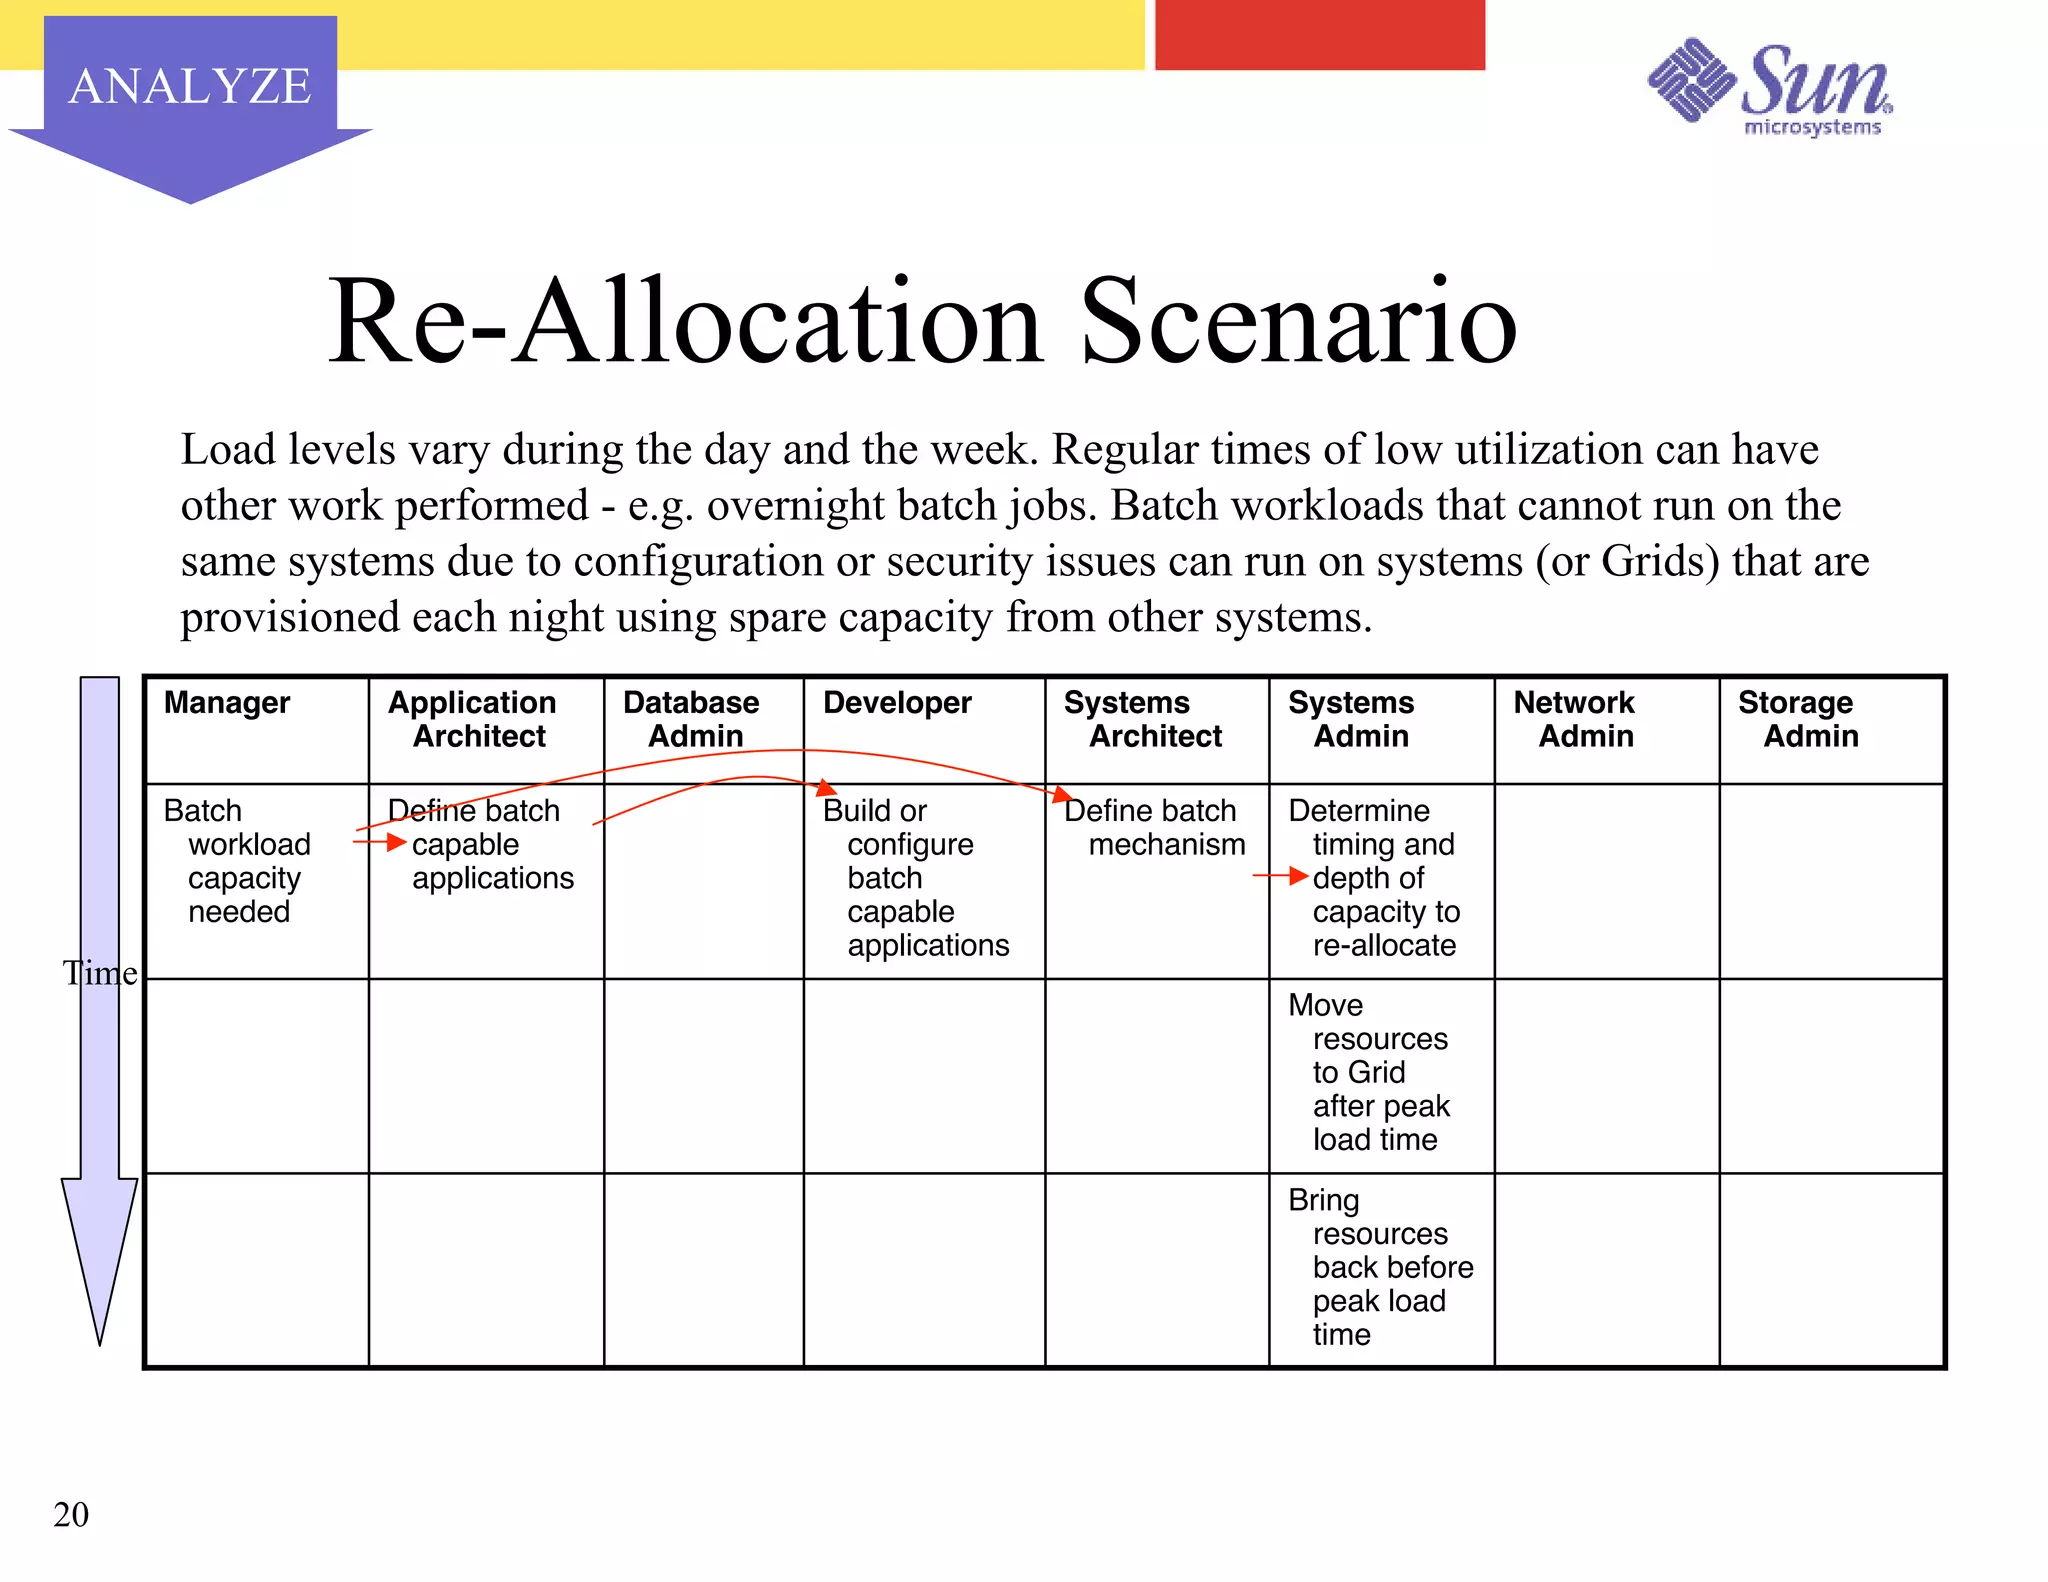
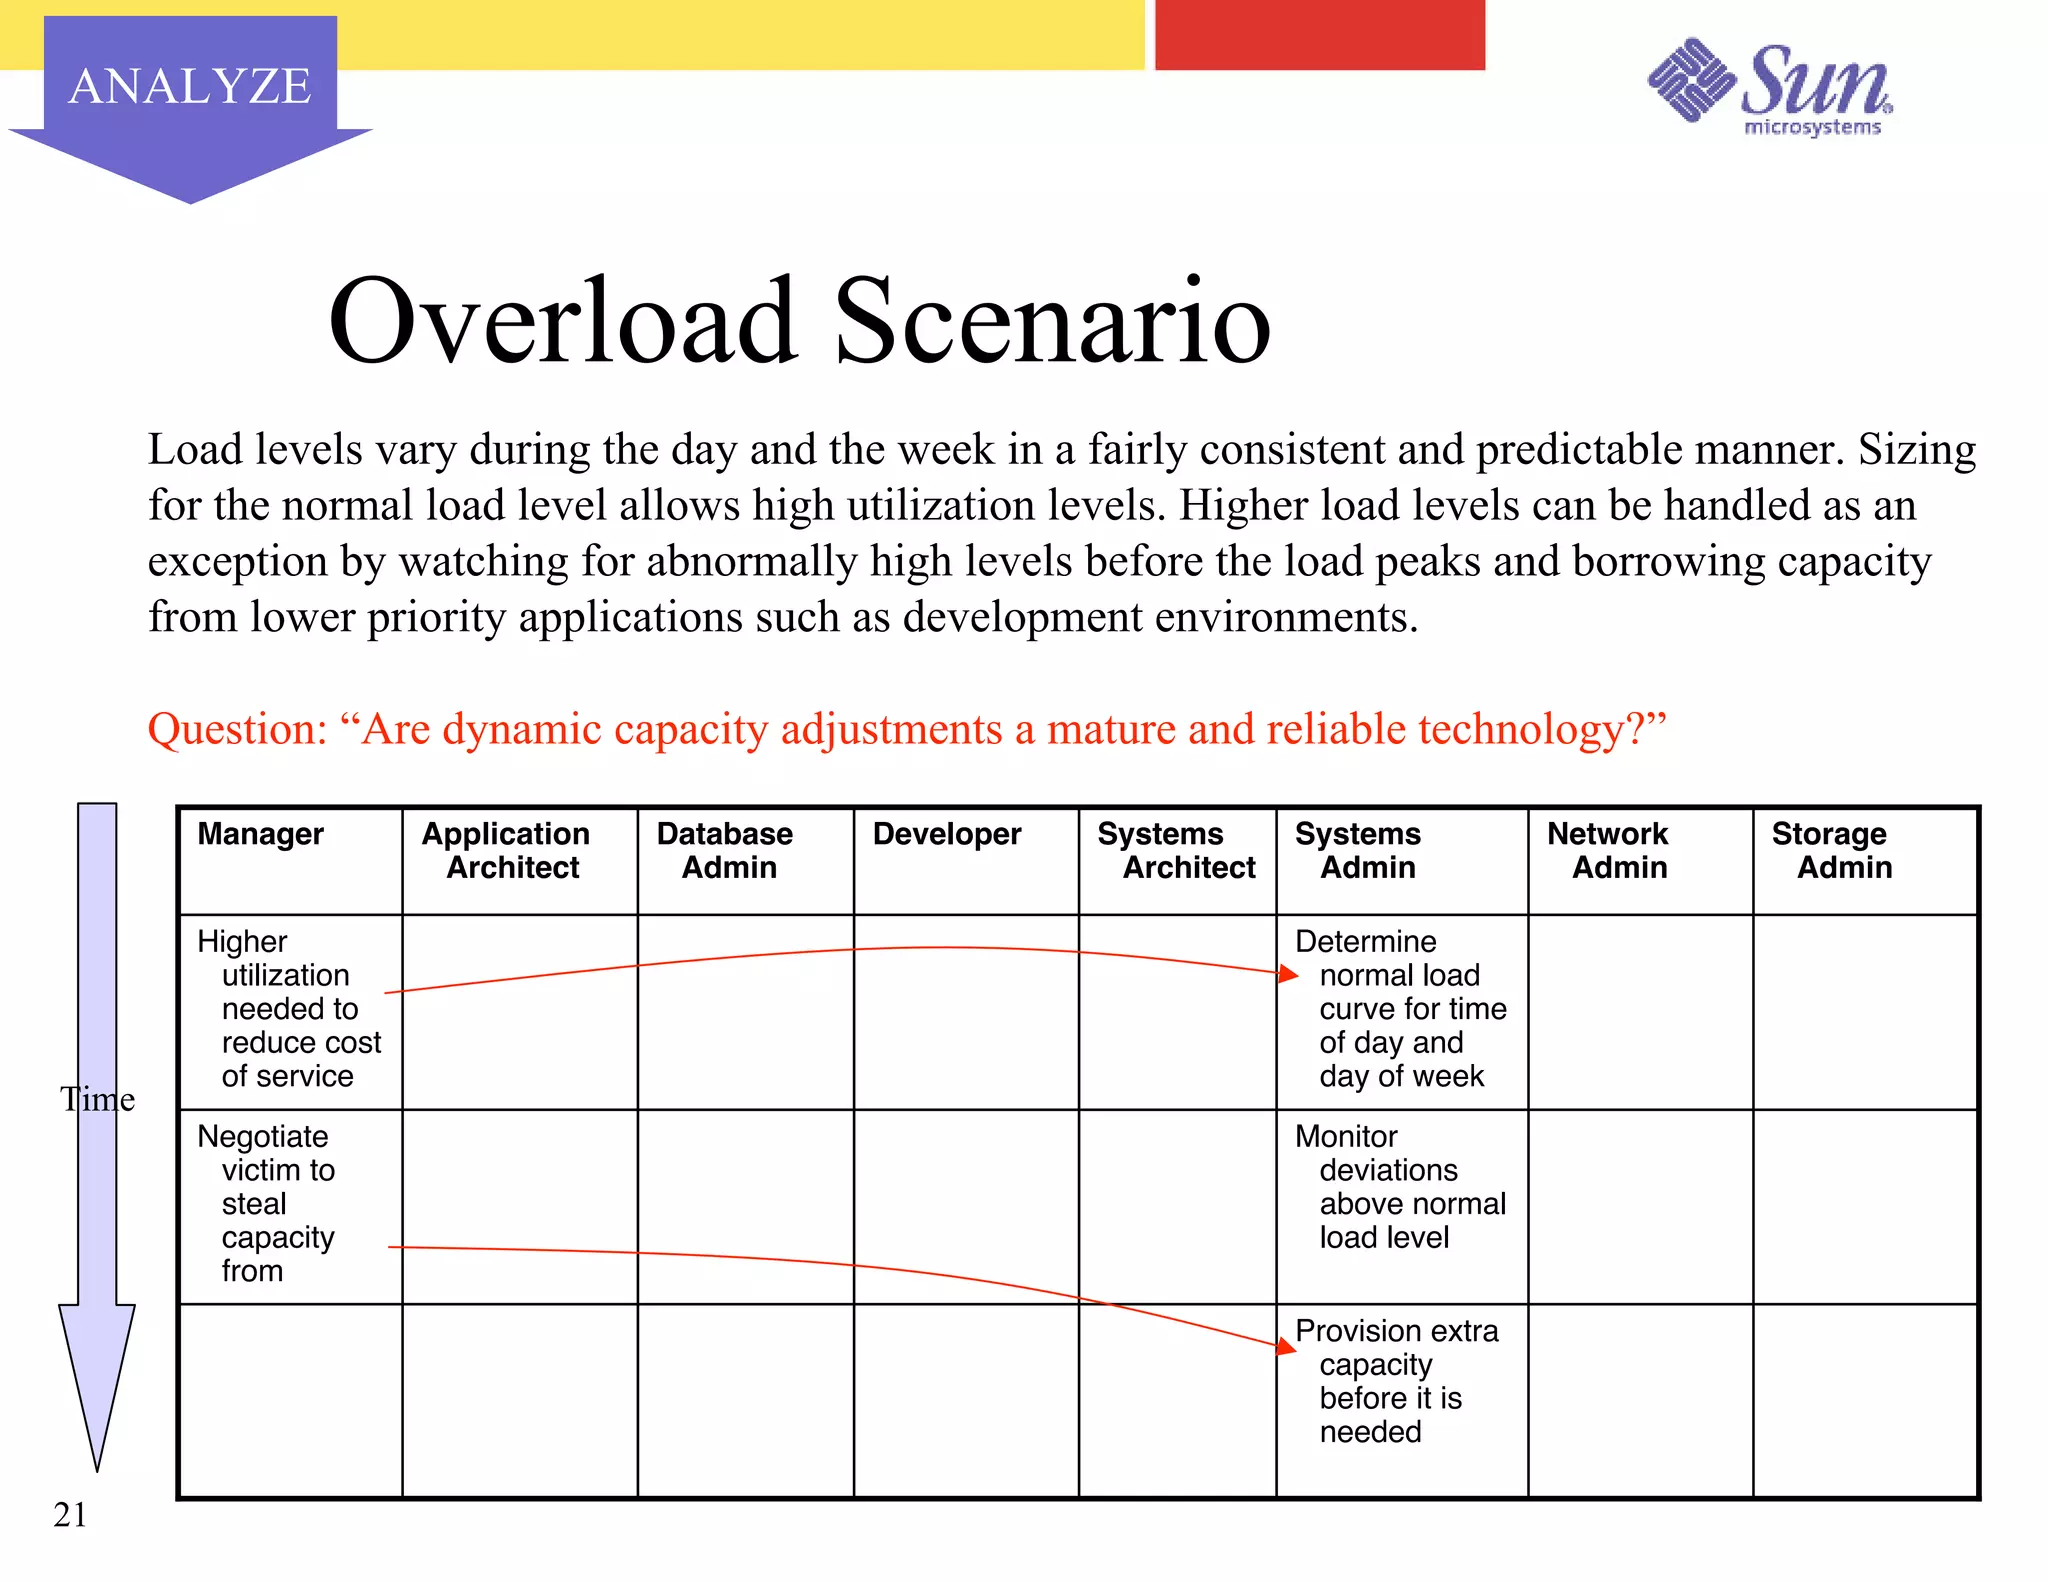
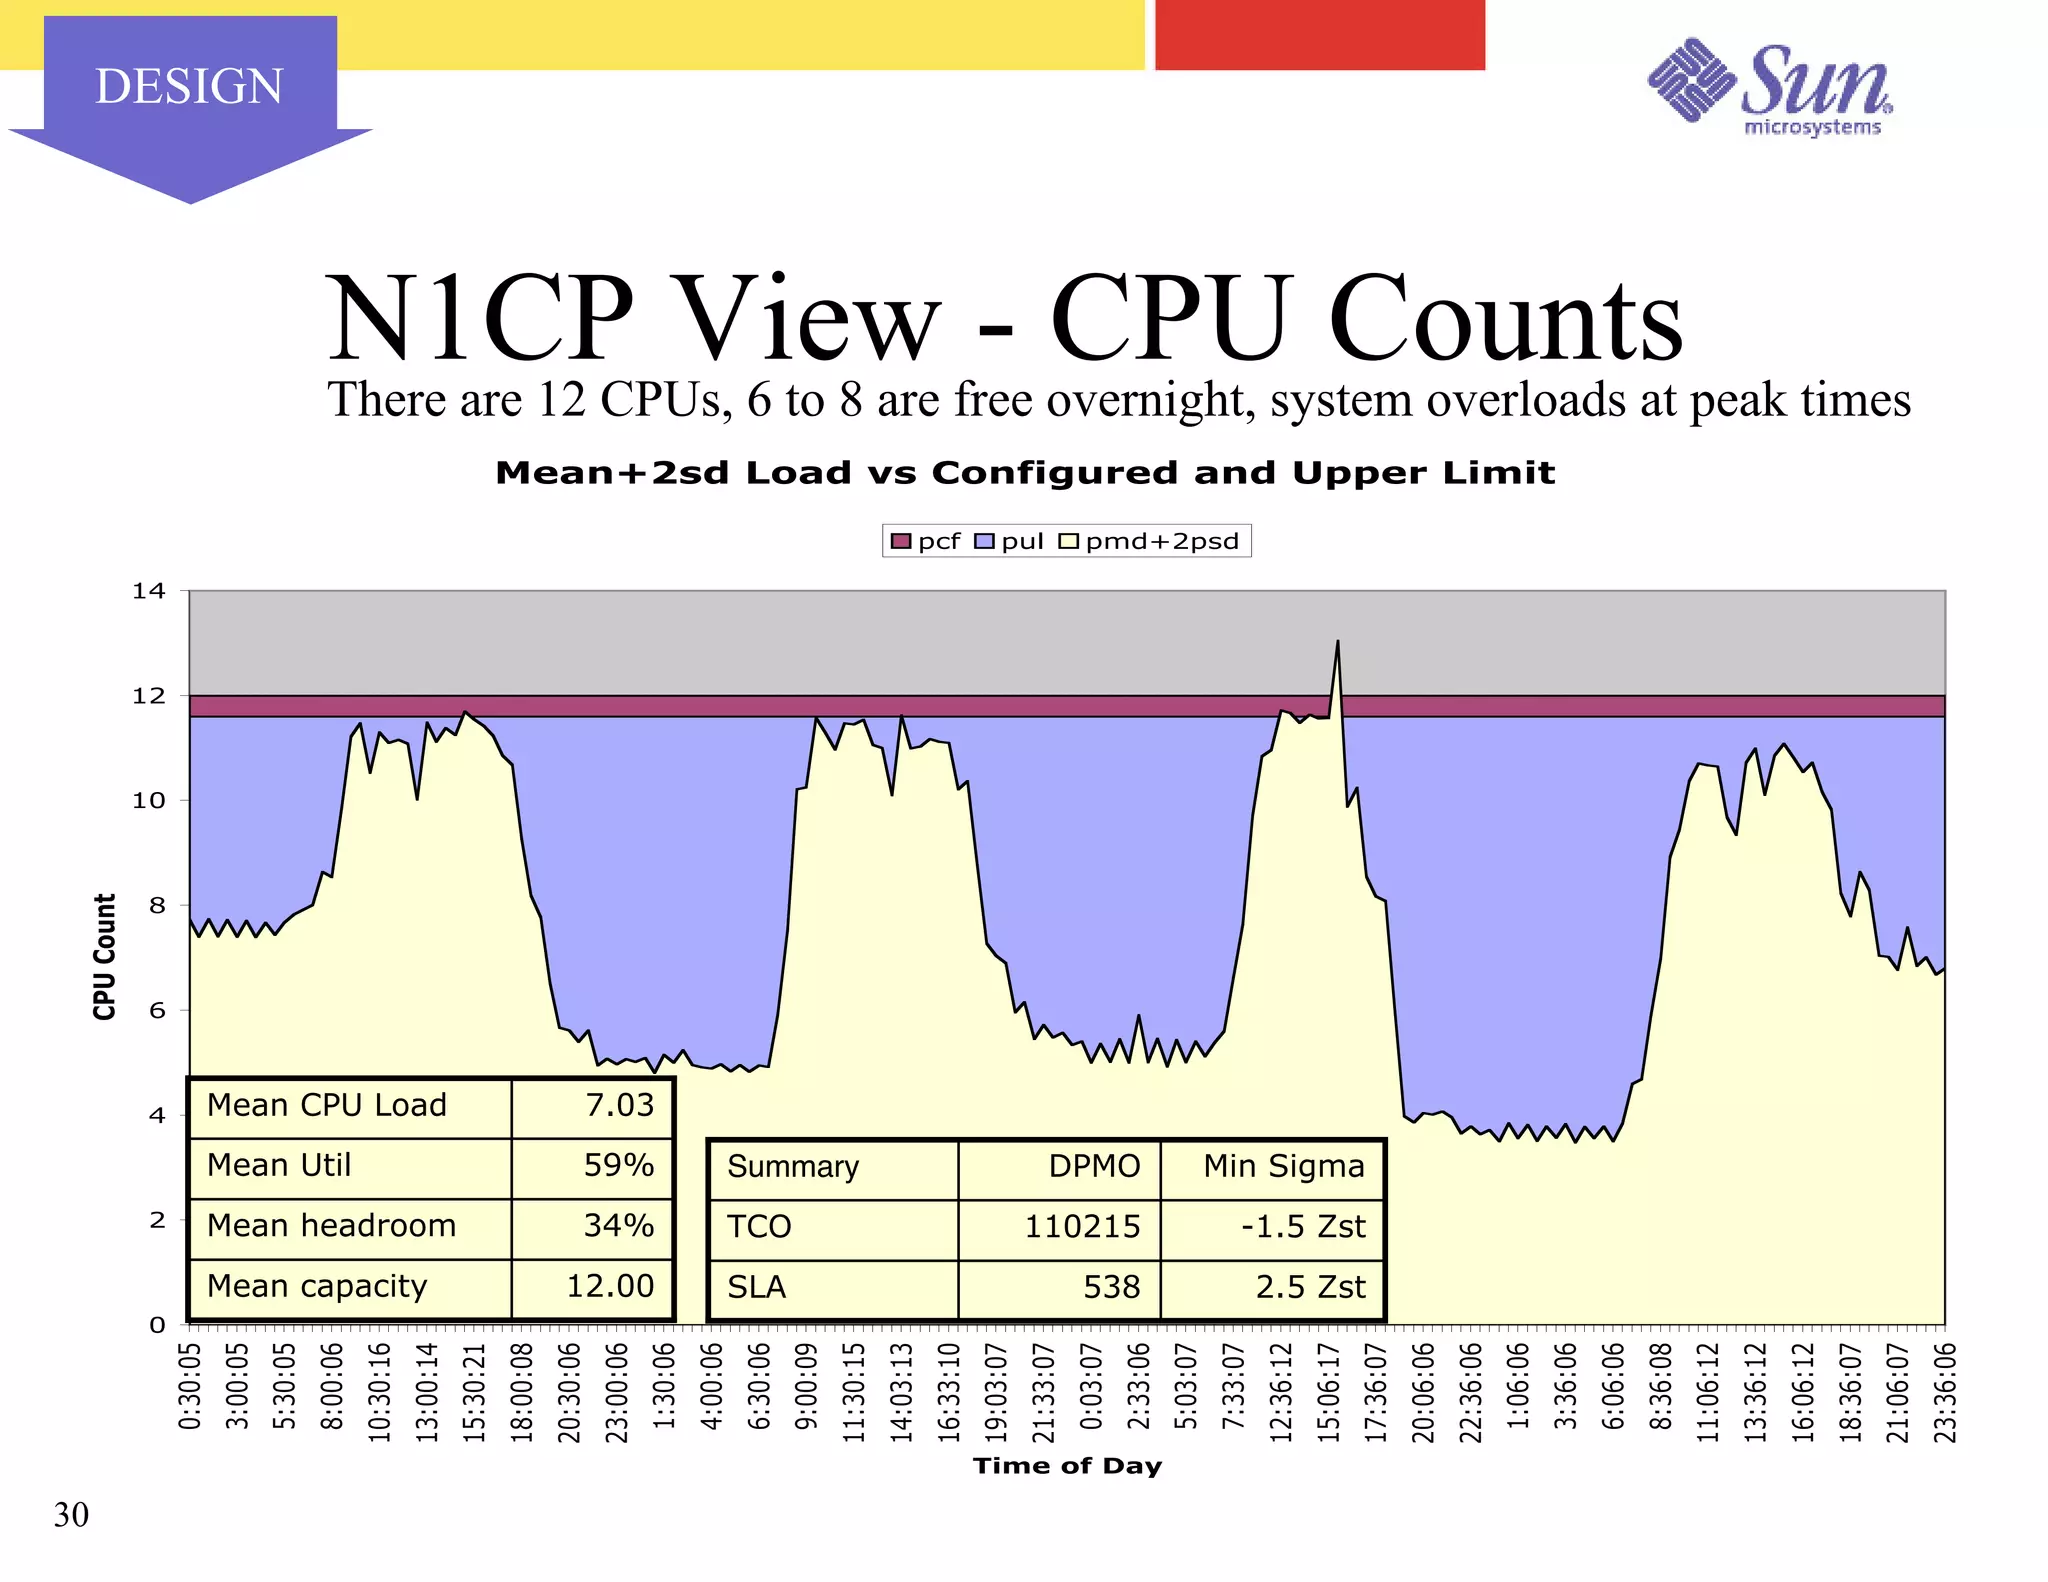
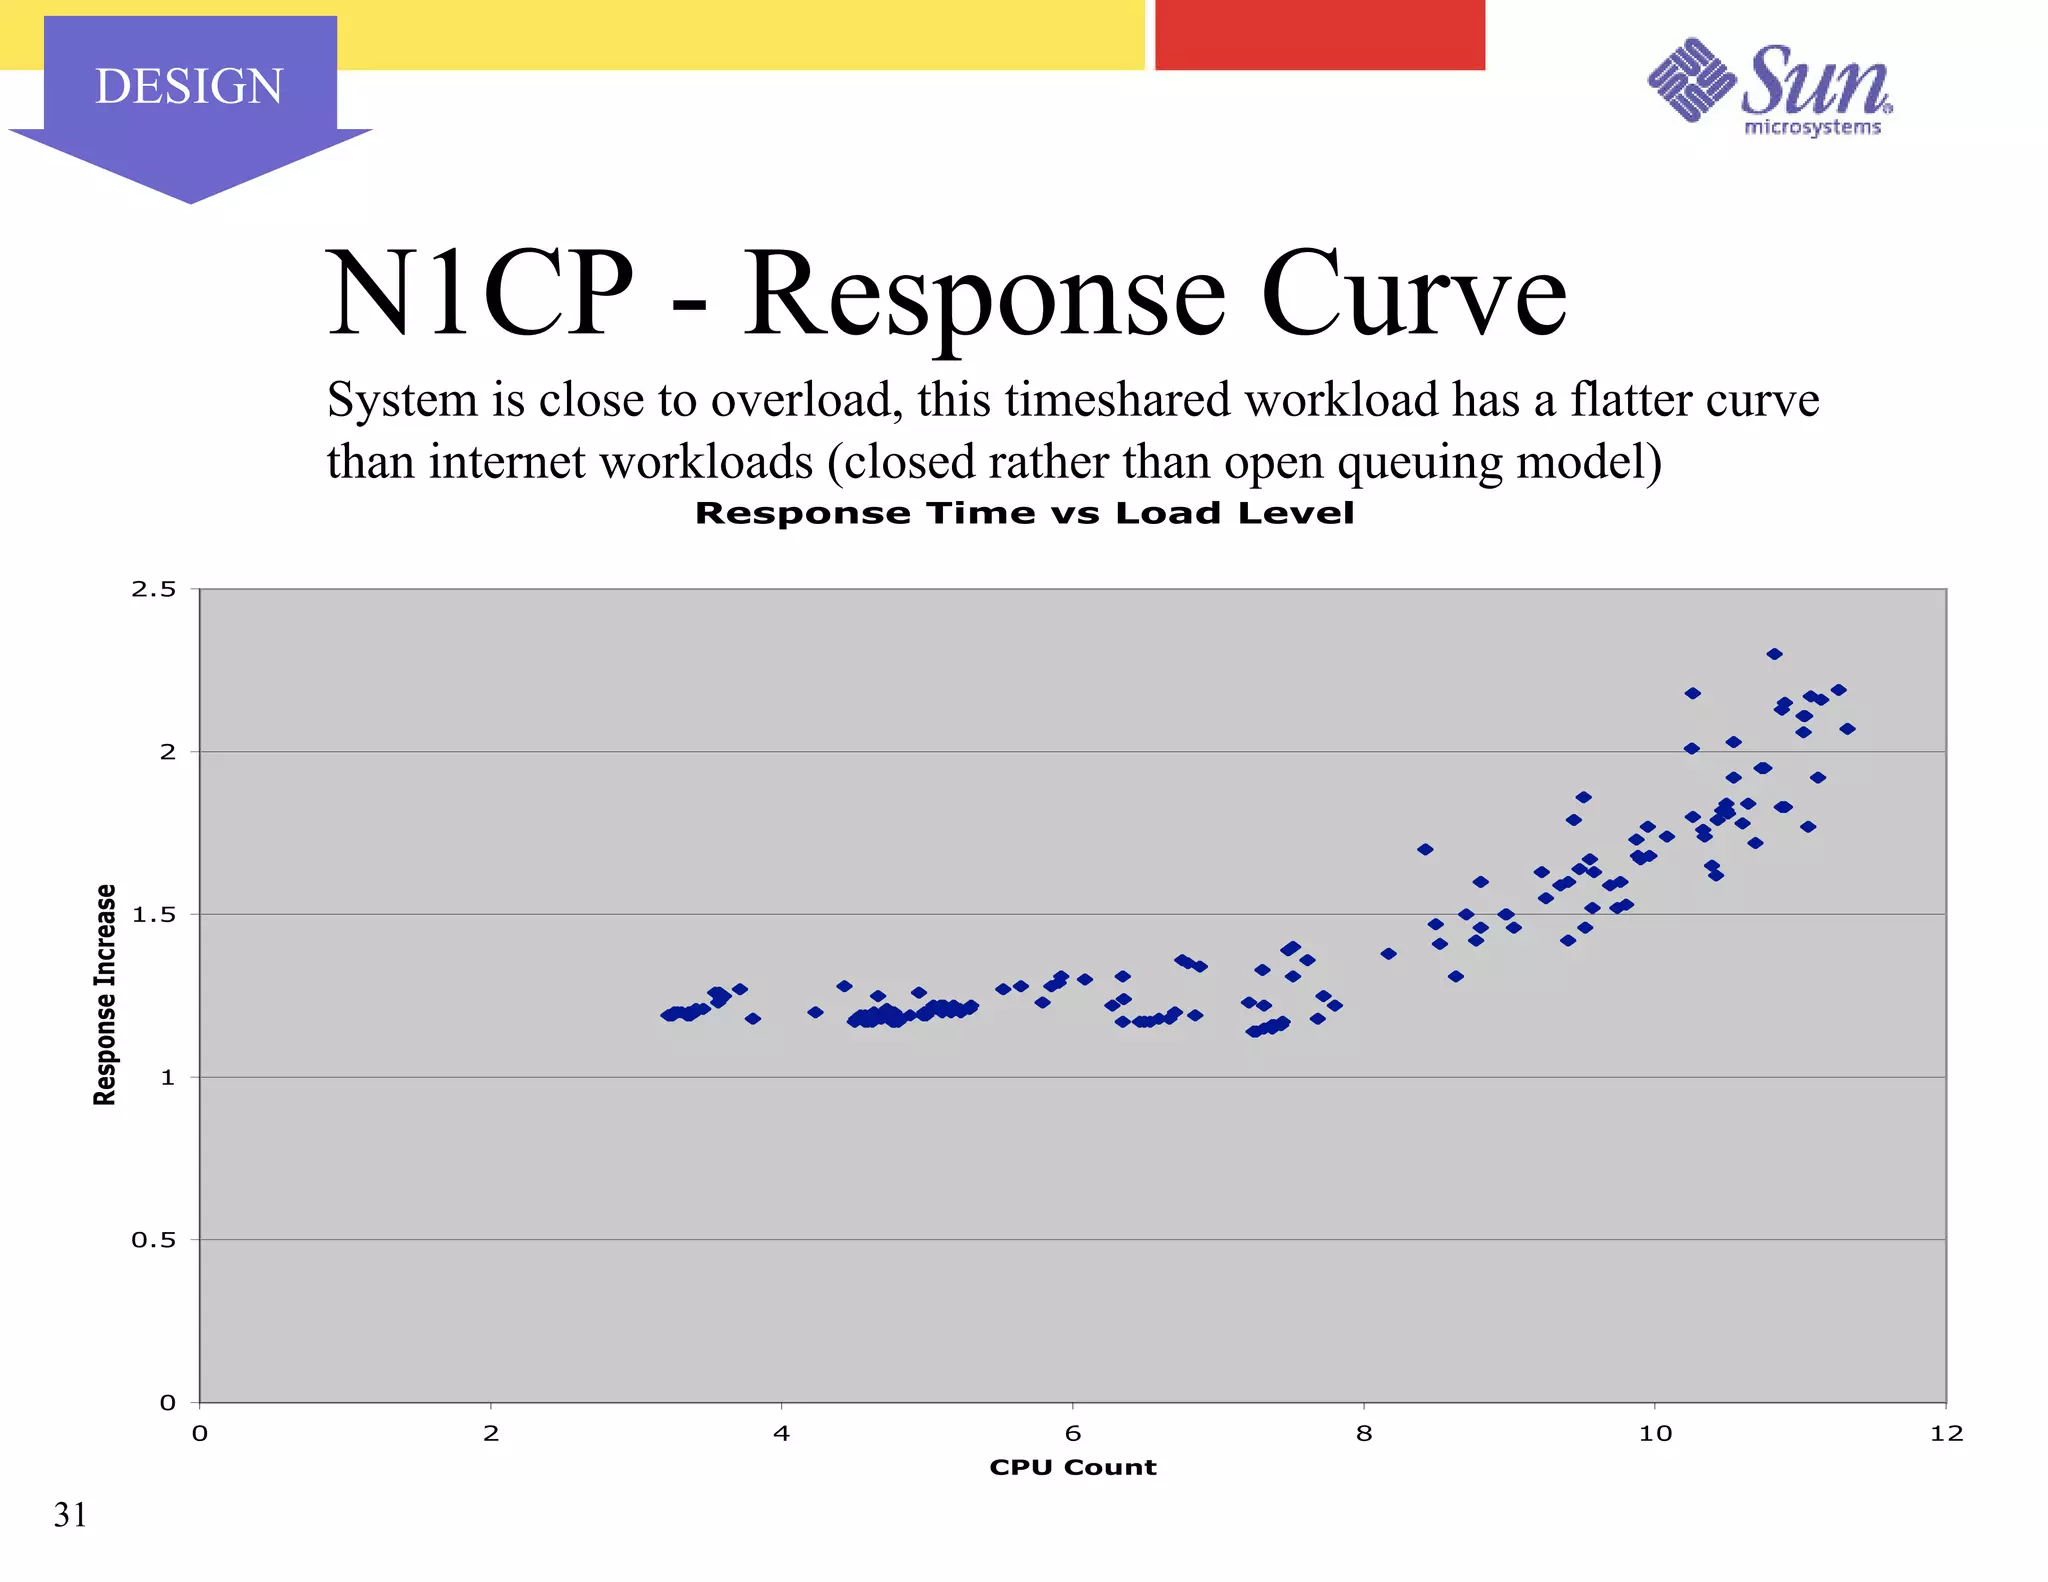
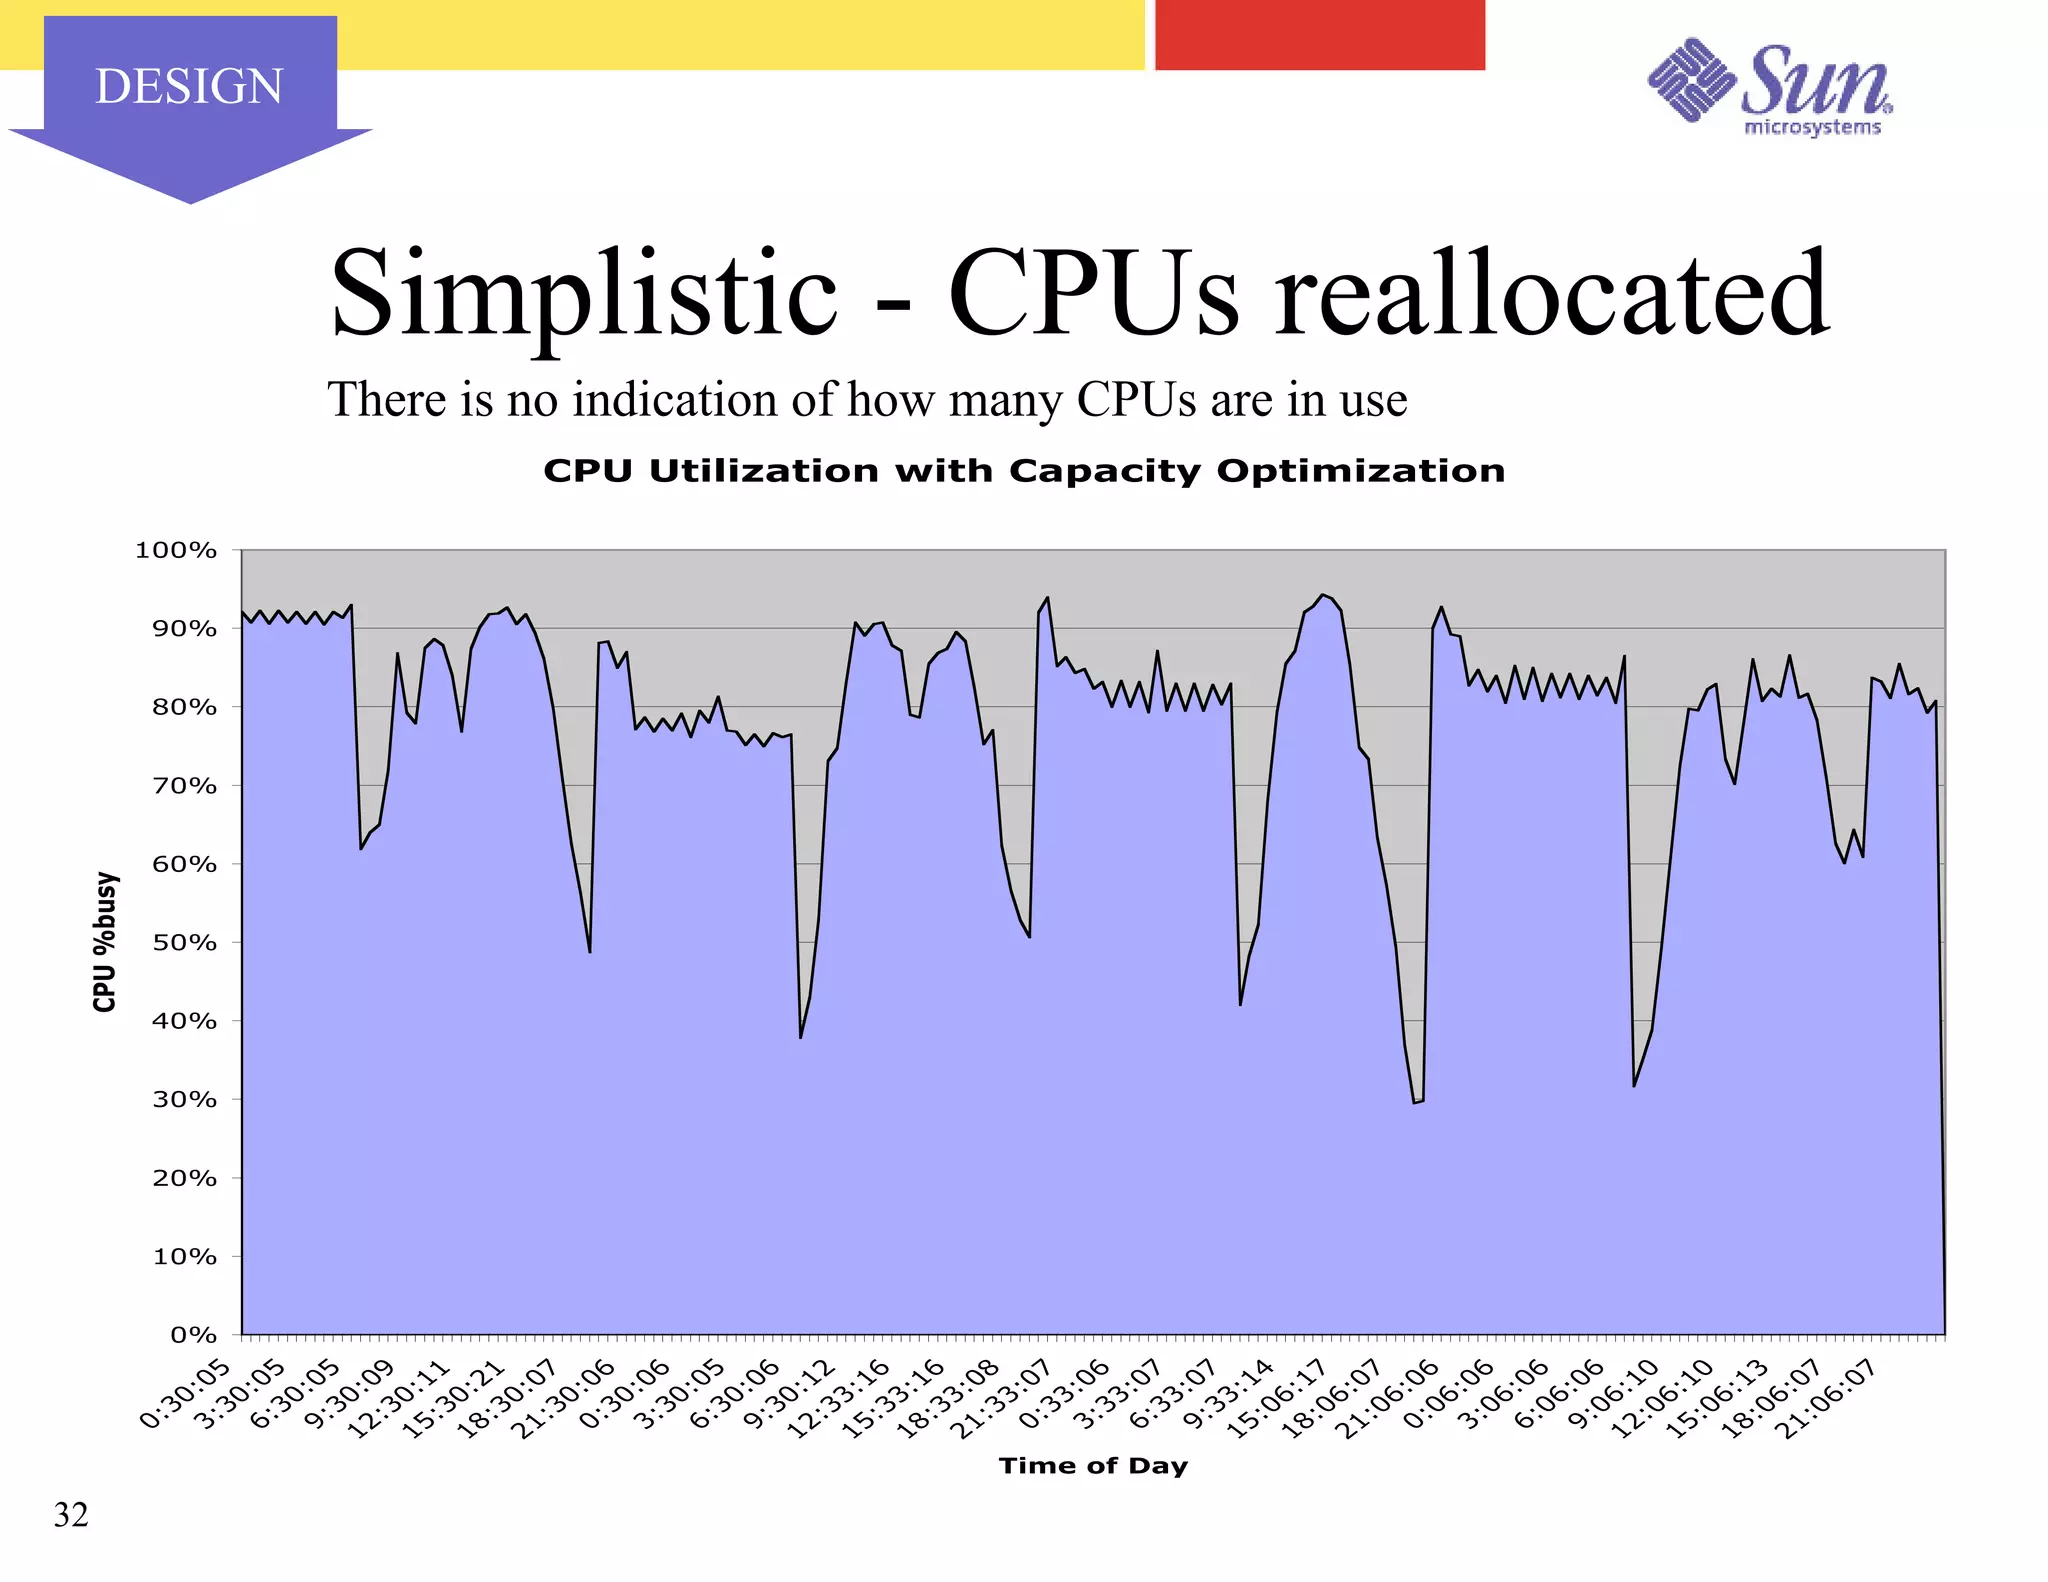
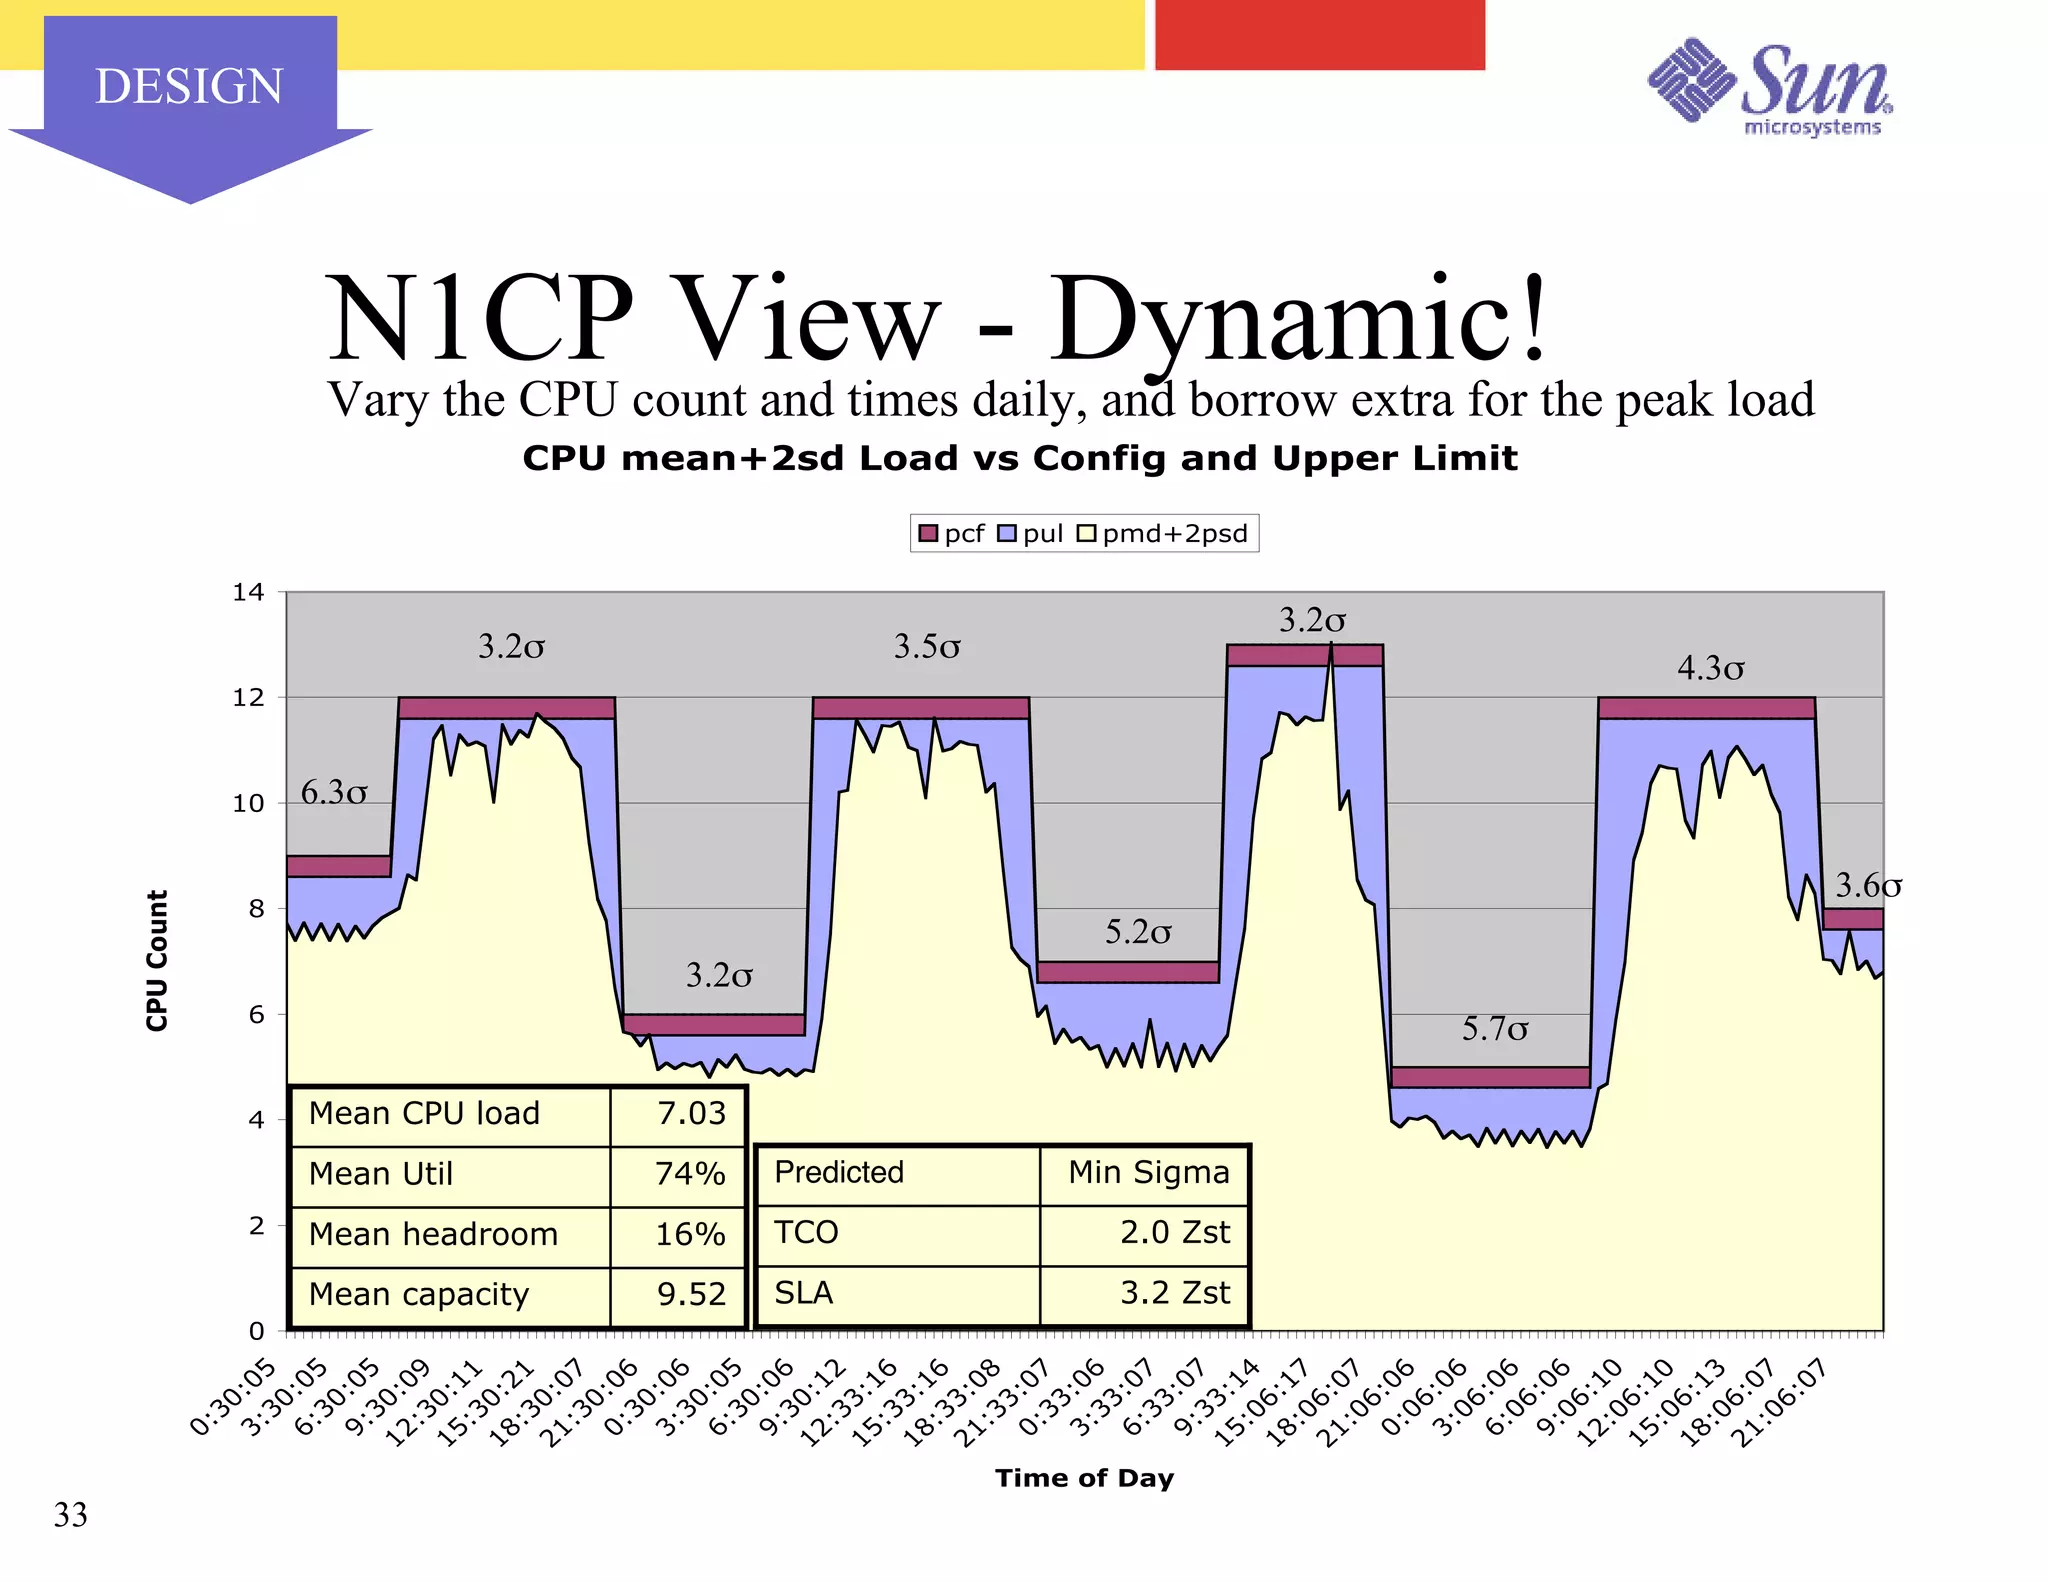
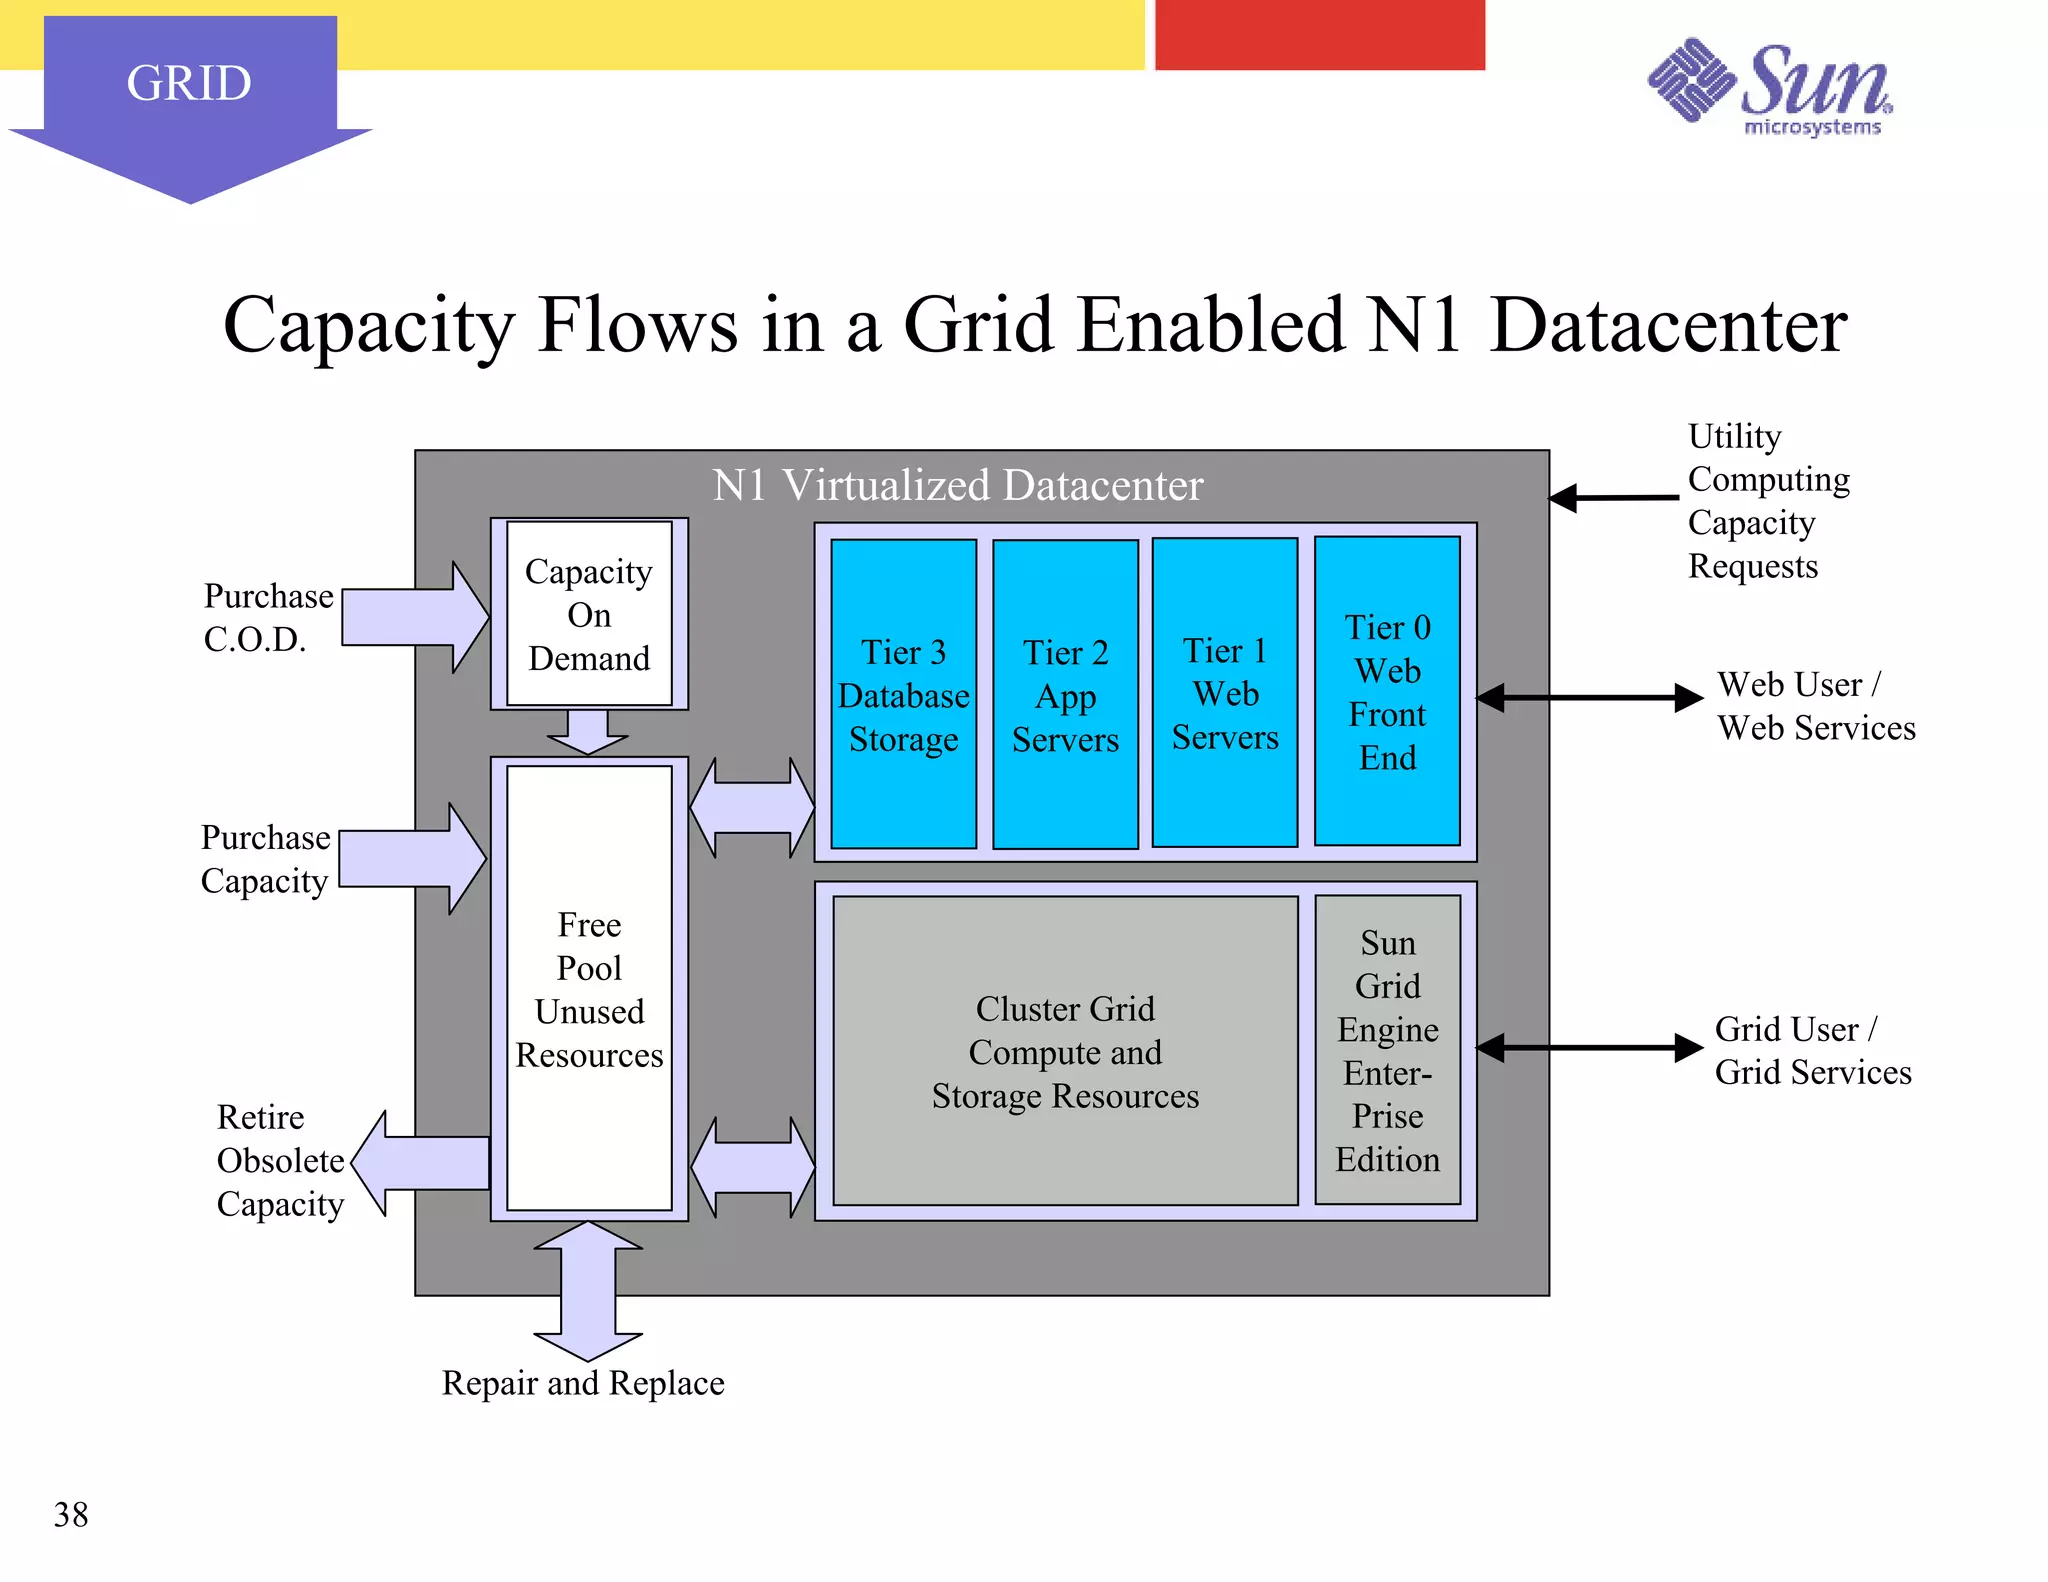


The document outlines a project on capacity planning for the N1 Sun Network, focusing on data center automation and managing multiple systems as a unified entity to optimize performance and lower total cost of ownership. It highlights the importance of translating customer needs into measurable performance metrics, including CPU utilization, application responsiveness, and resource headroom. Various scenarios for installation, over-provisioning, rightsizing, and load reallocation are discussed to ensure efficient resource management.


![Vibe Coding vs. Spec-Driven Development [Free Meetup]](https://cdn.slidesharecdn.com/ss_thumbnails/vibecodingvsspecdrivendevelopment-251209105622-43f455e7-thumbnail.jpg?width=640&height=640&fit=bounds)


