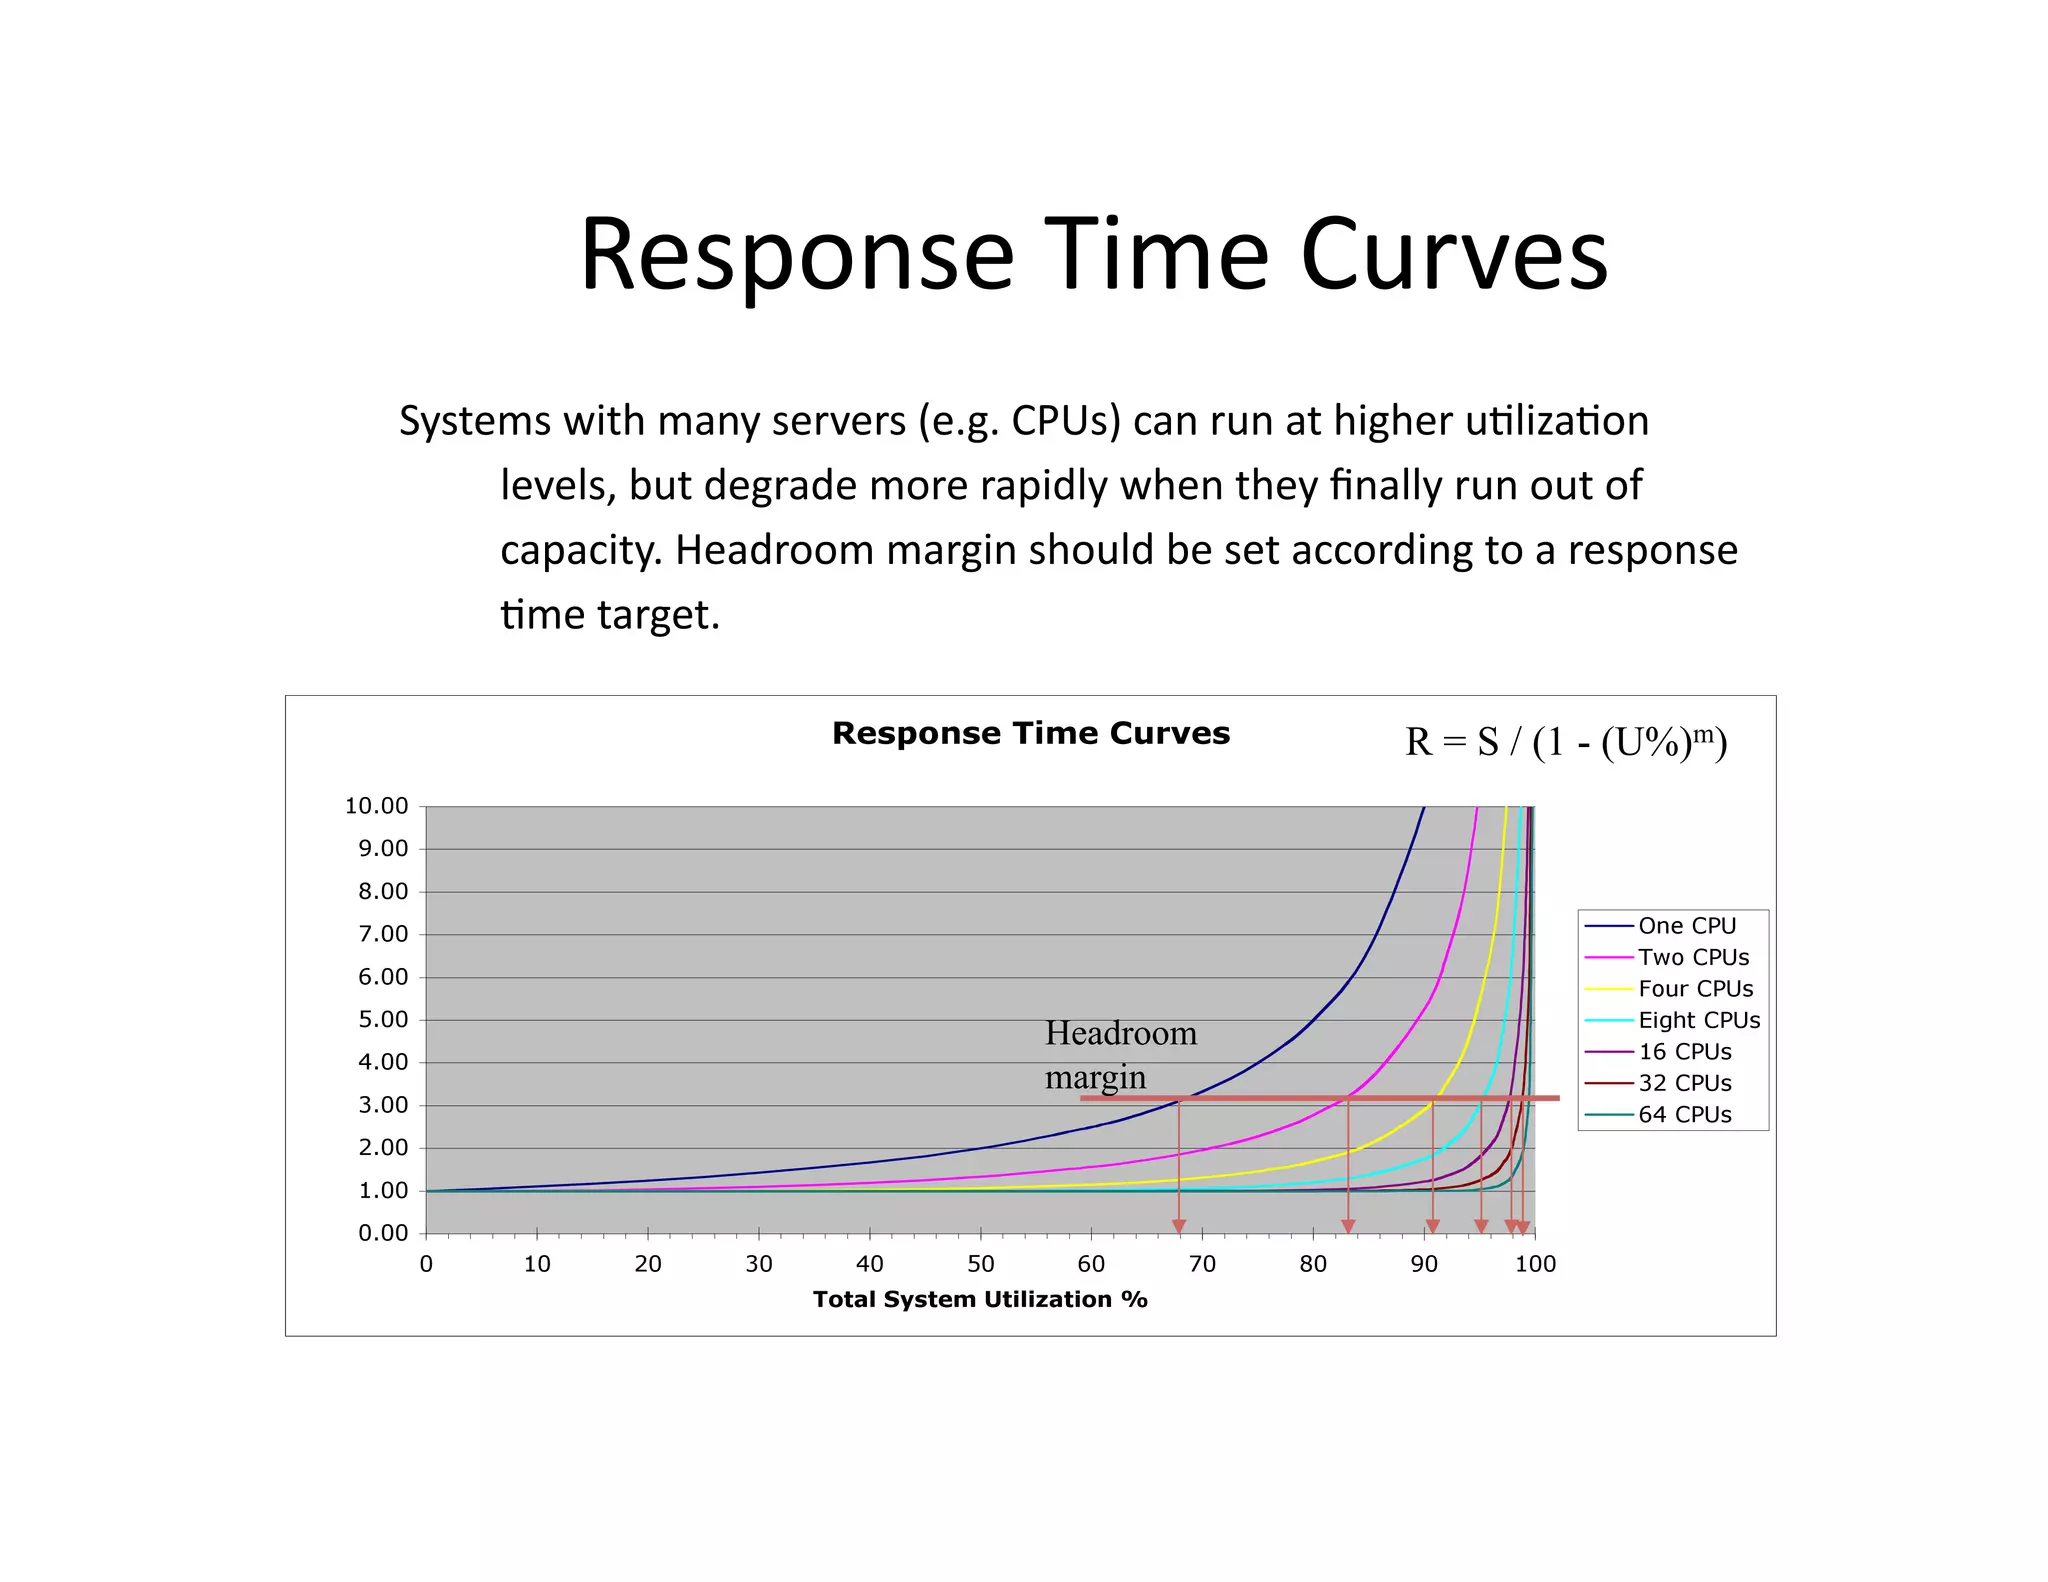
U"liza"on	
  is	
  Virtually	
  Useless	
  as	
  a	
  
                   Metric!	
  
      CMG	
  2006	
  -­‐	
  Reno	
  NV	
  
                  Adrian	
  Cockcro?	
  –	
  NeAlix	
  Inc.	
  
                   With	
  minor	
  updates	
  2010	
  
                (At	
  the	
  "me:	
  Dis"nguished	
  Engineer	
  
                   eBay	
  Research	
  Labs,	
  eBay	
  Inc.)	
  
Agenda	
  
•    Headroom	
  
•    U"liza"on	
  
•    Response	
  Time	
  
•    The	
  Many	
  Ways	
  In	
  Which	
  U"liza"on	
  Metrics	
  Are	
  Broken	
  
•    An	
  Alterna"ve	
  
•    eBay.com	
  Architecture,	
  Scale	
  and	
  Rate	
  of	
  Change	
  
•    Response	
  "mes	
  for	
  an	
  eBay.com	
  SOA	
  service	
  pool	
  
•    Conclusions	
  
Headroom	
  
•  Headroom	
  is	
  available	
  usable	
  resources	
  
    –  Total	
  Capacity	
  minus	
  Peak	
  U"liza"on	
  and	
  Margin	
  
    –  Applies	
  to	
  CPU,	
  RAM,	
  Net,	
  Disk	
  and	
  OS	


                                             Margin

                                             Headroom


                                      Utilization
U"liza"on	
  
•  U"liza"on	
  is	
  the	
  propor"on	
  of	
  busy	
  "me	
  
•  Always	
  defined	
  over	
  a	
  "me	
  interval	


                  Utilization
Response	
  Time	
  
•    Service	
  "me	
  occurs	
  while	
  using	
  a	
  resource	
  
•    Queue	
  "me	
  waits	
  for	
  access	
  to	
  a	
  resource	
  
•    Response	
  Time	
  =	
  Queue	
  "me	
  +	
  Service	
  "me	
  
•    Assump"ons	
  
       –    Steady	
  state	
  averages	
  
       –    Random	
  arrivals	
  
       –    Constant	
  service	
  "me	
  
       –    M	
  servers	
  processing	
  the	
  same	
  queue	
  
•  Approxima"ons	
  	
  
       –  Queue	
  length	
  =	
  Throughput	
  x	
  Response	
  Time	
  (Liale's	
  Law)	
  
       –  Response	
  Time	
  =	
  Service	
  Time	
  /	
  (Headroom	
  +	
  Margin)	
  
       –  Response	
  Time	
  =	
  Service	
  Time	
  /	
  (1	
  -­‐	
  U"liza"onM)	
  
Response	
  Time	
  Curves	
  
Systems	
  with	
  many	
  servers	
  (e.g.	
  CPUs)	
  can	
  run	
  at	
  higher	
  u"liza"on	
  
     levels,	
  but	
  degrade	
  more	
  rapidly	
  when	
  they	
  finally	
  run	
  out	
  of	
  
     capacity.	
  Headroom	
  margin	
  should	
  be	
  set	
  according	
  to	
  a	
  response	
  
     "me	
  target.	
  

                                                                         R = S / (1 - (U%)m)


                                               Headroom
                                               margin
So	
  what's	
  the	
  problem	
  with	
  
                            U"liza"on?	
  
•    Unsafe	
  assump"ons!	
  Complex	
  adap"ve	
  systems	
  have	
  replaced	
  simple	
  ones	
  
•    Random	
  arrivals?	
  
      –  Bursty	
  traffic	
  with	
  long	
  tail	
  arrival	
  rate	
  distribu"on	
  

•    Constant	
  service	
  "me?	
  
      –  Variable	
  clock	
  rate	
  CPUs,	
  inverse	
  load	
  dependent	
  service	
  "me	
  

      –  Complex	
  transac"ons,	
  request	
  and	
  response	
  dependent	
  

•    M	
  servers	
  processing	
  the	
  same	
  queue?	
  
      –  Virtual	
  servers	
  with	
  varying	
  non-­‐integral	
  concurrency	
  

      –  Non-­‐iden"cal	
  servers	
  or	
  CPUs,	
  Hyperthreading,	
  Mul"core,	
  NUMA	
  

•    Measurement	
  Errors?	
  
      –  Measurement	
  mechanisms	
  with	
  built	
  in	
  bias,	
  e.g.	
  sampling	
  from	
  the	
  scheduler	
  clock	
  

      –  PlaAorm	
  specific	
  and	
  release	
  specific	
  systemic	
  changes	
  in	
  the	
  accoun"ng	
  of	
  interrupt	
  "me	
  
Storage	
  U"liza"on 	
  	
  
•  Storage	
  virtualiza"on	
  broke	
  u"liza"on	
  metrics	
  a	
  long	
  
   "me	
  ago	
  
•  Host	
  server	
  measures	
  busy	
  "me	
  on	
  a	
  "disk"	
  
    –  Simple	
  disk,	
  "single	
  server"	
  response	
  "me	
  gets	
  high	
  near	
  
       100%	
  u"liza"on	
  
    –  Cached	
  RAID	
  LUN,	
  one	
  I/O	
  stream	
  can	
  report	
  100%	
  
       u"liza"on,	
  but	
  full	
  capacity	
  supports	
  many	
  threads	
  of	
  I/O	
  
       since	
  there	
  are	
  many	
  disks	
  and	
  RAM	
  buffering	
  
•  New	
  metric	
  -­‐	
  "Capability	
  U"liza"on"	
  
    –  Adjusted	
  to	
  report	
  propor"on	
  of	
  actual	
  capacity	
  for	
  
       current	
  workload	
  mix	
  
    –  Measured	
  by	
  tools	
  such	
  as	
  Ortera	
  Atlas	
  (hap://
       www.ortera.com)	
  
Threaded	
  CPU	
  Pipelines	
  
•  CPU	
  microarchitecture	
  op"miza"ons	
  
     –  Extra	
  register	
  sets	
  working	
  with	
  the	
  exis"ng	
  arithme"c	
  and	
  floa"ng	
  point	
  units	
  
     –  When	
  the	
  CPU	
  stalls	
  on	
  a	
  memory	
  read,	
  it	
  switches	
  registers/threads	
  
     –  Opera"ng	
  system	
  sees	
  mul"ple	
  schedulable	
  en""es	
  (CPUs)	
  
•  Intel	
  Hyperthreading	
  
     –    Each	
  CPU	
  core	
  has	
  an	
  extra	
  thread	
  to	
  use	
  spare	
  cycles	
  
     –    Typical	
  benefit	
  is	
  20%,	
  so	
  total	
  capacity	
  is	
  1.2	
  CPUs	
  
     –    Second	
  thread	
  much	
  slower	
  when	
  first	
  thread	
  is	
  busy	
  
     –    Hyperthreading	
  aware	
  op"miza"ons	
  in	
  recent	
  opera"ng	
  systems	
  
•  Sun	
  CoolThreads	
  
     –    "Niagara"	
  SPARC	
  CPU	
  has	
  eight	
  cores,	
  one	
  shared	
  floa"ng	
  point	
  unit	
  
     –    Each	
  CPU	
  core	
  has	
  four	
  threads,	
  but	
  each	
  core	
  is	
  a	
  very	
  simple	
  design	
  
     –    Behaves	
  like	
  32	
  slow	
  CPUs	
  for	
  integer,	
  snail	
  like	
  uniprocessor	
  for	
  FP	
  
     –    Overall	
  throughput	
  is	
  very	
  high,	
  performance	
  per	
  waa	
  is	
  excep"onal	
  
•  Hyperformix	
  have	
  performance	
  modeling	
  of	
  Hyperthreads	
  and	
  Niagara	
  
Variable	
  Clock	
  Rate	
  CPUs	
  
•    Laptop	
  and	
  other	
  low	
  power	
  devices	
  do	
  this	
  all	
  the	
  "me	
  
       –  Watch	
  CPU	
  usage	
  of	
  a	
  video	
  playback	
  applica"on	
  and	
  toggle	
  mains/baaery	
  power….	
  
•    Next	
  Genera"on	
  Server	
  CPU	
  Power	
  Op"miza"on	
  -­‐	
  AMD	
  PowerNow!™	
  
       –    AMD	
  Opteron	
  x64	
  server	
  CPU	
  detects	
  overall	
  u"liza"on	
  and	
  reduces	
  clock	
  rate	
  
       –    Actual	
  speeds	
  vary,	
  but	
  for	
  example	
  could	
  reduce	
  from	
  2.6GHz	
  to	
  1.2GHz	
  
       –    Speed	
  varies	
  per	
  socket,	
  so	
  pairs	
  of	
  CPU	
  cores	
  vary	
  together	
  
       –    Changes	
  are	
  not	
  currently	
  understood	
  or	
  reported	
  by	
  opera"ng	
  system	
  metrics	
  
       –    Speed	
  changes	
  can	
  occur	
  every	
  few	
  milliseconds	
  
•    Possible	
  scenario:	
  
       –  You	
  es"mate	
  20%	
  u"liza"on	
  at	
  2.6GHz	
  and	
  see	
  45%	
  reported	
  in	
  prac"ce	
  (at	
  1.2GHz)	
  
       –  Load	
  doubles,	
  reported	
  u"liza"on	
  drops	
  to	
  40%	
  (at	
  2.6GHz)	
  
       –  Actual	
  mapping	
  of	
  u"liza"on	
  to	
  clock	
  rate	
  is	
  unknown	
  at	
  this	
  point	
  
•    Older	
  Opterons,	
  and	
  "low	
  power"	
  versions	
  used	
  in	
  blades	
  do	
  not	
  vary	
  clock	
  rate	
  
•    Disaster	
  scenario	
  -­‐	
  you	
  get	
  a	
  capacity	
  surge	
  and	
  the	
  datacenter	
  power	
  and	
  cooling	
  can't	
  cope	
  
     with	
  all	
  the	
  systems	
  at	
  the	
  high	
  clock	
  rate!	
  
Virtual	
  Machine	
  Monitors	
  
•  VMware,	
  Xen,	
  and	
  good	
  old	
  mainframe	
  LPARs	
  etc.	
  
    –  Non-­‐integral	
  and	
  non-­‐constant	
  frac"ons	
  of	
  a	
  machine	
  
    –  Naiive	
  opera"ng	
  systems	
  and	
  applica"ons	
  that	
  don't	
  
       expect	
  this	
  behavior	
  
    –  However,	
  lots	
  of	
  recent	
  tools	
  development	
  from	
  vendors	
  
       (BMC,	
  Teamquest	
  etc.)	
  

•  Average	
  CPU	
  count	
  must	
  be	
  reported	
  for	
  each	
  
   measurement	
  interval	
  

•  VMM	
  overhead	
  varies,	
  applica"on	
  scaling	
  
   characteris"cs	
  may	
  be	
  affected	
  
Whats	
  My	
  Headroom?	
  How	
  to	
  plot	
  it?	
  
•  Measure	
  and	
  report	
  absolute	
  CPU	
  power	
  if	
  you	
  can	
  get	
  it…	
  
•  Plot	
  shows	
  headroom	
  in	
  blue,	
  margin	
  in	
  red,	
  total	
  power	
  tracking,	
  day/
   night	
  workload	
  varia"on,	
  ploaed	
  as	
  mean	
  +	
  two	
  standard	
  devia"ons.	
  
Cockcro?	
  Headroom	
  Plot	
  
•  Scaaer	
  plot	
  of	
  disk	
  
   response	
  "me	
  (ms)	
  vs.	
  
   Throughput	
  (KB)	
  
•  Histograms	
  on	
  axes	
  
•  Throughput	
  "me	
  series	
  
   plot	
  
•  Shows	
  distribu"ons	
  and	
  
   shape	
  of	
  response	
  "me	
  
•  Fits	
  throughput	
  weighted	
  
   inverse	
  gaussian	
  curve	
  
•  Coded	
  using	
  "R"	
  sta"s"cs	
  
   package	
  
•  Blogged	
  development	
  at	
  
   hap://
   perfcap.blogspot.com	
  
Thread	
  Limited	
  Response	
  Time	
  
•    Thread-­‐limited	
  responses	
  
•    Mixture	
  of	
  fast	
  and	
  slow	
  requests	
  
•    Oscilla"ng	
  behaviors	
  
•    Distribu"ons	
  are	
  long	
  tail	
  
•    Workload	
  behaves	
  a	
  bit	
  like	
  adhoc	
  
     queries	
  to	
  a	
  DSS	
  perhaps?	
  
•    Measurements	
  are	
  of	
  a	
  single	
  SOA	
  
     service	
  pool	
  
•    Response	
  is	
  in	
  milliseconds	
  
•    Throughput	
  is	
  execu"ons/s	
  

Exec                        Resp
Min.   :    1.00            Min.   :    0.0
1st Qu.:    2.00            1st Qu.: 150.0
Median :    8.00            Median : 361.0
Mean   :   64.68            Mean   : 533.5
3rd Qu.:   45.00            3rd Qu.: 771.9
Max.   :10795.00            Max.   :19205.0
Conclusion	
  
•  Check	
  your	
  assump"ons…	
  
•  Record	
  and	
  plot	
  absolute	
  capacity	
  for	
  each	
  
   measurement	
  interval	
  
•  Plot	
  response	
  "me	
  as	
  a	
  func"on	
  of	
  throughput,	
  not	
  
   just	
  u"liza"on	
  
•  SOA	
  response	
  characteris"cs	
  are	
  complicated	
  and	
  not	
  
   well	
  understood….	
  

                               Ques"ons?	
  
                         (Now	
  acockcro?@neAlix.com)	
  
                          hap://perfcap.blogspot.com	
  

Cmg06 utilization is useless

  • 1.
    U"liza"on  is  Virtually  Useless  as  a   Metric!   CMG  2006  -­‐  Reno  NV   Adrian  Cockcro?  –  NeAlix  Inc.   With  minor  updates  2010   (At  the  "me:  Dis"nguished  Engineer   eBay  Research  Labs,  eBay  Inc.)  
  • 2.
    Agenda   •  Headroom   •  U"liza"on   •  Response  Time   •  The  Many  Ways  In  Which  U"liza"on  Metrics  Are  Broken   •  An  Alterna"ve   •  eBay.com  Architecture,  Scale  and  Rate  of  Change   •  Response  "mes  for  an  eBay.com  SOA  service  pool   •  Conclusions  
  • 3.
    Headroom   •  Headroom  is  available  usable  resources   –  Total  Capacity  minus  Peak  U"liza"on  and  Margin   –  Applies  to  CPU,  RAM,  Net,  Disk  and  OS   Margin Headroom Utilization
  • 4.
    U"liza"on   •  U"liza"on  is  the  propor"on  of  busy  "me   •  Always  defined  over  a  "me  interval   Utilization
  • 5.
    Response  Time   •  Service  "me  occurs  while  using  a  resource   •  Queue  "me  waits  for  access  to  a  resource   •  Response  Time  =  Queue  "me  +  Service  "me   •  Assump"ons   –  Steady  state  averages   –  Random  arrivals   –  Constant  service  "me   –  M  servers  processing  the  same  queue   •  Approxima"ons     –  Queue  length  =  Throughput  x  Response  Time  (Liale's  Law)   –  Response  Time  =  Service  Time  /  (Headroom  +  Margin)   –  Response  Time  =  Service  Time  /  (1  -­‐  U"liza"onM)  
  • 6.
    Response  Time  Curves   Systems  with  many  servers  (e.g.  CPUs)  can  run  at  higher  u"liza"on   levels,  but  degrade  more  rapidly  when  they  finally  run  out  of   capacity.  Headroom  margin  should  be  set  according  to  a  response   "me  target.   R = S / (1 - (U%)m) Headroom margin
  • 7.
    So  what's  the  problem  with   U"liza"on?   •  Unsafe  assump"ons!  Complex  adap"ve  systems  have  replaced  simple  ones   •  Random  arrivals?   –  Bursty  traffic  with  long  tail  arrival  rate  distribu"on   •  Constant  service  "me?   –  Variable  clock  rate  CPUs,  inverse  load  dependent  service  "me   –  Complex  transac"ons,  request  and  response  dependent   •  M  servers  processing  the  same  queue?   –  Virtual  servers  with  varying  non-­‐integral  concurrency   –  Non-­‐iden"cal  servers  or  CPUs,  Hyperthreading,  Mul"core,  NUMA   •  Measurement  Errors?   –  Measurement  mechanisms  with  built  in  bias,  e.g.  sampling  from  the  scheduler  clock   –  PlaAorm  specific  and  release  specific  systemic  changes  in  the  accoun"ng  of  interrupt  "me  
  • 8.
    Storage  U"liza"on     •  Storage  virtualiza"on  broke  u"liza"on  metrics  a  long   "me  ago   •  Host  server  measures  busy  "me  on  a  "disk"   –  Simple  disk,  "single  server"  response  "me  gets  high  near   100%  u"liza"on   –  Cached  RAID  LUN,  one  I/O  stream  can  report  100%   u"liza"on,  but  full  capacity  supports  many  threads  of  I/O   since  there  are  many  disks  and  RAM  buffering   •  New  metric  -­‐  "Capability  U"liza"on"   –  Adjusted  to  report  propor"on  of  actual  capacity  for   current  workload  mix   –  Measured  by  tools  such  as  Ortera  Atlas  (hap:// www.ortera.com)  
  • 9.
    Threaded  CPU  Pipelines   •  CPU  microarchitecture  op"miza"ons   –  Extra  register  sets  working  with  the  exis"ng  arithme"c  and  floa"ng  point  units   –  When  the  CPU  stalls  on  a  memory  read,  it  switches  registers/threads   –  Opera"ng  system  sees  mul"ple  schedulable  en""es  (CPUs)   •  Intel  Hyperthreading   –  Each  CPU  core  has  an  extra  thread  to  use  spare  cycles   –  Typical  benefit  is  20%,  so  total  capacity  is  1.2  CPUs   –  Second  thread  much  slower  when  first  thread  is  busy   –  Hyperthreading  aware  op"miza"ons  in  recent  opera"ng  systems   •  Sun  CoolThreads   –  "Niagara"  SPARC  CPU  has  eight  cores,  one  shared  floa"ng  point  unit   –  Each  CPU  core  has  four  threads,  but  each  core  is  a  very  simple  design   –  Behaves  like  32  slow  CPUs  for  integer,  snail  like  uniprocessor  for  FP   –  Overall  throughput  is  very  high,  performance  per  waa  is  excep"onal   •  Hyperformix  have  performance  modeling  of  Hyperthreads  and  Niagara  
  • 10.
    Variable  Clock  Rate  CPUs   •  Laptop  and  other  low  power  devices  do  this  all  the  "me   –  Watch  CPU  usage  of  a  video  playback  applica"on  and  toggle  mains/baaery  power….   •  Next  Genera"on  Server  CPU  Power  Op"miza"on  -­‐  AMD  PowerNow!™   –  AMD  Opteron  x64  server  CPU  detects  overall  u"liza"on  and  reduces  clock  rate   –  Actual  speeds  vary,  but  for  example  could  reduce  from  2.6GHz  to  1.2GHz   –  Speed  varies  per  socket,  so  pairs  of  CPU  cores  vary  together   –  Changes  are  not  currently  understood  or  reported  by  opera"ng  system  metrics   –  Speed  changes  can  occur  every  few  milliseconds   •  Possible  scenario:   –  You  es"mate  20%  u"liza"on  at  2.6GHz  and  see  45%  reported  in  prac"ce  (at  1.2GHz)   –  Load  doubles,  reported  u"liza"on  drops  to  40%  (at  2.6GHz)   –  Actual  mapping  of  u"liza"on  to  clock  rate  is  unknown  at  this  point   •  Older  Opterons,  and  "low  power"  versions  used  in  blades  do  not  vary  clock  rate   •  Disaster  scenario  -­‐  you  get  a  capacity  surge  and  the  datacenter  power  and  cooling  can't  cope   with  all  the  systems  at  the  high  clock  rate!  
  • 11.
    Virtual  Machine  Monitors   •  VMware,  Xen,  and  good  old  mainframe  LPARs  etc.   –  Non-­‐integral  and  non-­‐constant  frac"ons  of  a  machine   –  Naiive  opera"ng  systems  and  applica"ons  that  don't   expect  this  behavior   –  However,  lots  of  recent  tools  development  from  vendors   (BMC,  Teamquest  etc.)   •  Average  CPU  count  must  be  reported  for  each   measurement  interval   •  VMM  overhead  varies,  applica"on  scaling   characteris"cs  may  be  affected  
  • 12.
    Whats  My  Headroom?  How  to  plot  it?   •  Measure  and  report  absolute  CPU  power  if  you  can  get  it…   •  Plot  shows  headroom  in  blue,  margin  in  red,  total  power  tracking,  day/ night  workload  varia"on,  ploaed  as  mean  +  two  standard  devia"ons.  
  • 13.
    Cockcro?  Headroom  Plot   •  Scaaer  plot  of  disk   response  "me  (ms)  vs.   Throughput  (KB)   •  Histograms  on  axes   •  Throughput  "me  series   plot   •  Shows  distribu"ons  and   shape  of  response  "me   •  Fits  throughput  weighted   inverse  gaussian  curve   •  Coded  using  "R"  sta"s"cs   package   •  Blogged  development  at   hap:// perfcap.blogspot.com  
  • 14.
    Thread  Limited  Response  Time   •  Thread-­‐limited  responses   •  Mixture  of  fast  and  slow  requests   •  Oscilla"ng  behaviors   •  Distribu"ons  are  long  tail   •  Workload  behaves  a  bit  like  adhoc   queries  to  a  DSS  perhaps?   •  Measurements  are  of  a  single  SOA   service  pool   •  Response  is  in  milliseconds   •  Throughput  is  execu"ons/s   Exec Resp Min. : 1.00 Min. : 0.0 1st Qu.: 2.00 1st Qu.: 150.0 Median : 8.00 Median : 361.0 Mean : 64.68 Mean : 533.5 3rd Qu.: 45.00 3rd Qu.: 771.9 Max. :10795.00 Max. :19205.0
  • 15.
    Conclusion   •  Check  your  assump"ons…   •  Record  and  plot  absolute  capacity  for  each   measurement  interval   •  Plot  response  "me  as  a  func"on  of  throughput,  not   just  u"liza"on   •  SOA  response  characteris"cs  are  complicated  and  not   well  understood….   Ques"ons?   (Now  acockcro?@neAlix.com)   hap://perfcap.blogspot.com