Downloaded 490 times


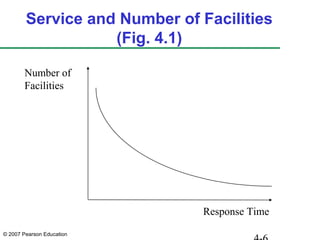
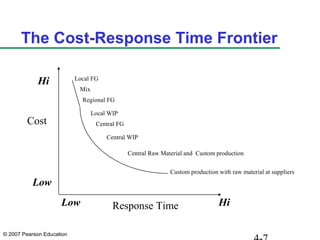
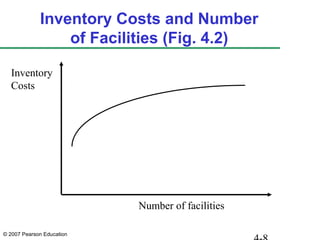
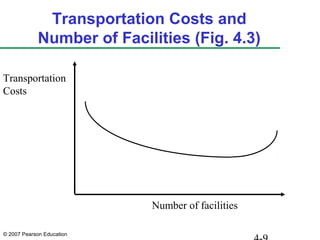
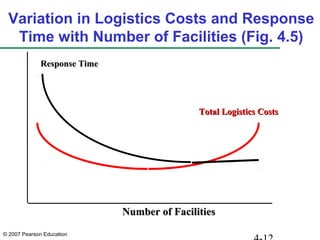
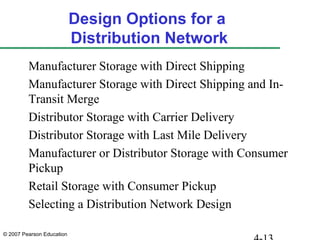
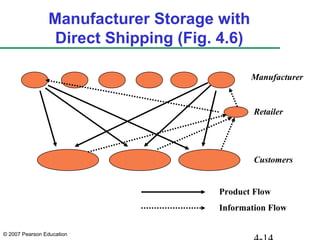
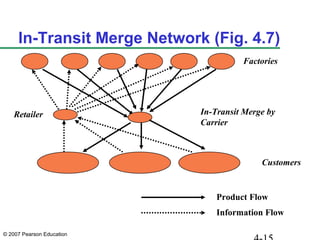
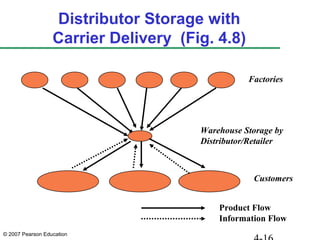
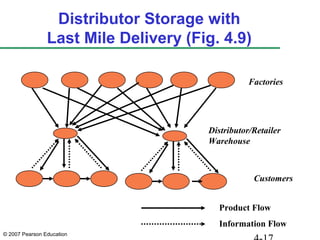

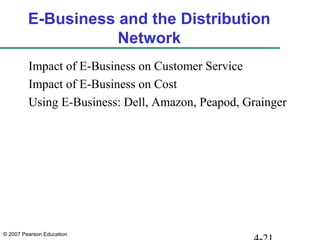
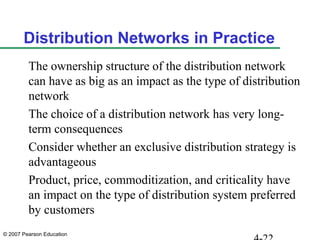


This document discusses factors that influence distribution network design, including customer needs, costs, and various design options. Distribution directly impacts costs and customer experience. The number of facilities in a network affects response time, inventory levels, transportation and facility costs. Design options include direct shipping from manufacturers, distributor warehouses, retail stores, and mixed approaches. E-business is changing distribution's impact on customer service and costs. The type of network chosen has long-term consequences for the supply chain.


