Downloaded 66 times


![Grab some data (using R)
beer <-
read.csv(url("http://staash.com/beer_operation
s.csv"))
response <- beer[,2]
plot(response, type="S",ylab=”response”)](https://image.slidesharecdn.com/bottleneckanalysisdod-130622100254-phpapp02/85/Bottleneck-analysis-Devopsdays-Silicon-Valley-2013-5-320.jpg)
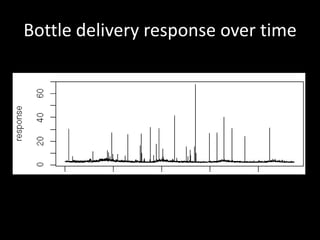
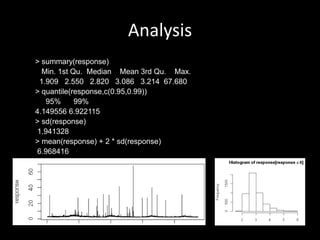
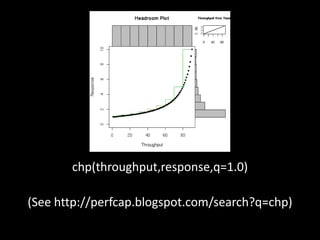


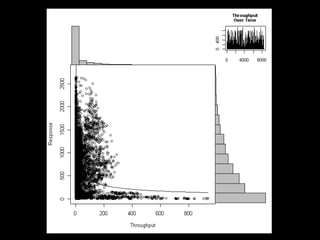
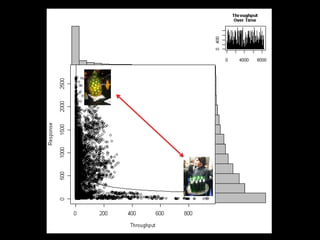
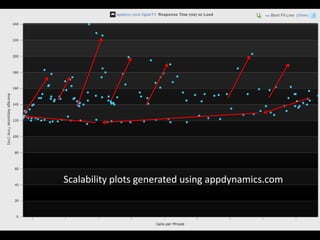

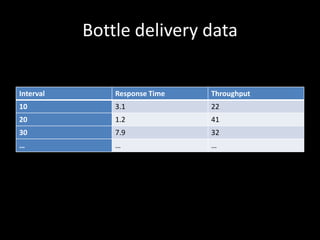
The document analyzes bottle delivery response time data over various intervals. Summary statistics show the response times have a mean of 3.086 seconds and standard deviation of 1.94 seconds. A chp analysis reveals the system is well-behaved with low lock contention.


![[OpenInfra Days Korea 2018] (Track 4) - Backend.AI: 오픈소스 머신러닝 인프라 프레임워크](https://cdn.slidesharecdn.com/ss_thumbnails/4420180628backend-180704055900-thumbnail.jpg?width=640&height=640&fit=bounds)


![Getting Started with Apache Spark: Big Data Made Simple [Free Meetup]](https://cdn.slidesharecdn.com/ss_thumbnails/apachesparkgettingstarted-260203175547-8361bcc3-thumbnail.jpg?width=640&height=640&fit=bounds)


