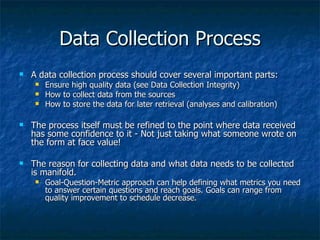
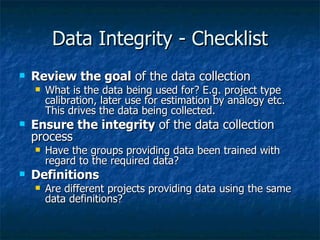
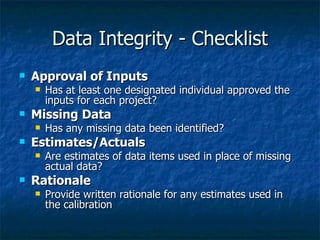
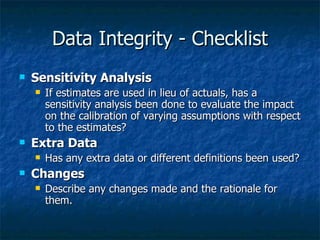
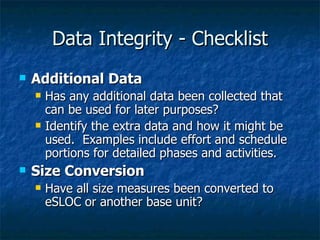
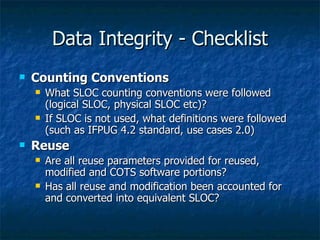
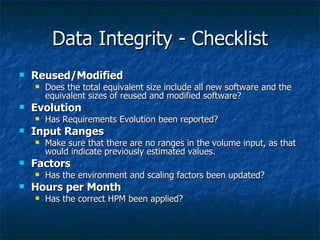
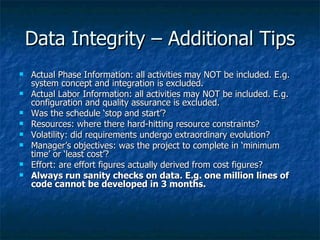
Statistical analysis, presentation on Data Analysis in Research.Leena Gauraha
presentation on Data Analysis in Research, Meaning of Data analysis, Objectives & Steps of Data analysis, Types of Data analysis, Benefits to Business from Data analysis, Data Interpretation Methods in Data analysis.
Statistical analysis, presentation on Data Analysis in Research.Leena Gauraha
presentation on Data Analysis in Research, Meaning of Data analysis, Objectives & Steps of Data analysis, Types of Data analysis, Benefits to Business from Data analysis, Data Interpretation Methods in Data analysis.
Data Analysis in Research: Descriptive Statistics & NormalityIkbal Ahmed
A Presentation on Data Analysis using descriptive statistics & normality. From this presentation you can know-
1) What is Data
2) Types of Data
3) What is Data analysis
4) Descriptive Statistics
5) Tools for assessing normality
Research Methodology: Questionnaire, Sampling, Data Preparationamitsethi21985
As per PTU's MBA Syllabus, Unit No. 2: Sources Of Data: Primary And Secondary; Data Collection Methods; Questionnaire Designing: Construction, Types And Developing A Good Questionnaire. Sampling Design and Techniques, Scaling Techniques, Meaning, Types, Data Processing Operations, Editing, Coding, Classification, Tabulation. Research Proposal/Synopsis Writing. Practical Framework
Types of Data, Difference between Primary and Secondary Data, Collection of Primary Data, Questionnaire, Schedules, Interview, Survey, Observation, Secondary Data, Sources of Secondary Data, Tabulation of Data – Meaning and Types
Business Research Method - Unit III, AKTU, Lucknow SyllabusKartikeya Singh
Business Research Method - Unit III, AKTU, Lucknow Syllabus,
Research Methodology - Topics Covered - Scaling & Measurement techniques: Concept of Measurement: Need of Measurement; Problems in measurement in management research – Validity and Reliability. Levels of measurement – Nominal, Ordinal, Interval, Ratio.
Attitude Scaling Techniques: Concept of Scale – Rating Scales viz. Likert Scales, Semantic Differential Scales, Constant Sum Scales, Graphic Rating Scales – Ranking Scales – Paired comparison & Forced Ranking – Concept and Application.
Types of research designs, Descriptive, exploratory, Causal designs. The differences and situation where these studies are being employed.. What should be the appropriate study in a given business situations.
Its a fully detailed topic about Editing , Coding, Tabulation o Data in research work.
The editing , coding , tabulation of data is been explained in this ppt.
Data and data collection in qualitative researchRizky Amelia
This is about data and data collection methods in qualitative research, including interviews, observations, introspective, think-aloud, retrospective, questionnaires, documents, and production task. completely great :)
Data collection is the process of gathering and measuring information on targeted variables in an established systematic fashion, which then enables one to answer relevant questions and evaluate outcomes.
Methods of data collection (research methodology)Muhammed Konari
Included all types of data collection.Includes primary data collection and secondary data collection. Described each and every classification of Data collections which are included in KTU Kerala.
Data collection - Statistical data are a numerical statement of aggregates. Data, generally, are obtained through properly organized statistical inquiries conducted by the investigators. Data can either be from primary or secondary sources.
Building a mind map for test data management.
Overview
1. Test data source
2. Extract or create data
3. Transform data
4. Provision
5. Target
Source: http://debasishbhadra.blogspot.com/2013/12/create-your-own-mindmap-for-test-data.html
Top 30 Data Analyst Interview Questions.pdfShaikSikindar1
Data Analytics has emerged has one of the central aspects of business operations. Consequently, the quest to grab professional positions within the Data Analytics domain has assumed unimaginable proportions. So if you too happen to be someone who is desirous of making through a Data Analyst .
Data science in demand planning - when the machine is not enoughTristan Wiggill
A presentation by Calven van der Byl BCom Economics and Statistics, BCom Honours Mathematical Statistics, Masters Mathematical Statistics, Inventory Optimization Demand Planning Manager, DSV, South Africa.
Delivered during SAPICS 2016, a leading event for supply chain professionals, held in Sun City, South Africa.
Demand Planning is a complex, yet often de-emphasized function in the supply chain planning function. The demand planning function is often characterized by an over-reliance on off the shelf software as well as a great deal of manual intervention. This presentation will outline the current developments and perspective in big data analytics and how they can be leveraged with the demand planning function to improve forecasting agility and efficiency. A simulation study will be presented in order to illustrate these principles in practice.
You have started your asset finance systems implementation. What are the typical pain points ahead? In this third of three articles. Richmond Consulting Group looks at three areas that will need attention if the journey is to be a smooth one!
We welcome comments and would be happy to help you get your project off to a good start.
Traditional operational views of capacity planning is not the same as BI Capacity planning. I created this presentation to help establish a BI Infrastructure Capacity planning process.
ATAGTR2017 Performance Testing and Non-Functional Testing Strategy for Big Da...Agile Testing Alliance
The presentation on Performance Testing and Non-Functional Testing Strategy for Big Data Applications was done during #ATAGTR2017, one of the largest global testing conference. All copyright belongs to the author.
Author and presenter : Abhinav Gupta
We've been doing "agile" stuff for more than 15 years now, but most data-centric projects (like data warehousing and business intelligence) still aren't getting the value they need to from agile principles. What should "agile" really look like in data projects?
This is short review of project matrices. This short lecture provides an overview that how software project matrices help software project manager to make accurate estimates.
Predicting Mission Success through Improved Data Collection, Reuse and Analysis
Data Collection Process And Integrity
1. Data Collection
Process and Integrity of Data Collection for
Later Software Cost Estimation Calibrations
Gerrit Klaschke
2. What is covered?
Data Collection
What is it?
Process
Best Practices
Data Integrity
Checklist
Additional Tips
3. Data Collection Process
A data collection process should cover several important parts:
Ensure high quality data (see Data Collection Integrity)
How to collect data from the sources
How to store the data for later retrieval (analyses and calibration)
The process itself must be refined to the point where data received
has some confidence to it - Not just taking what someone wrote on
the form at face value!
The reason for collecting data and what data needs to be collected
is manifold.
Goal-Question-Metric approach can help defining what metrics you need
to answer certain questions and reach goals. Goals can range from
quality improvement to schedule decrease.
4. Data Collection Process
When to Collect Data
When scoping a new project
During development for management and to
identify issues and progress
Post Mortem to improve corporate history
repository (database of completed projects)
During maintenance to continue improving
5. Data Collection Process
Suggested Central Repository
Requirements
Database must be extensible so new fields can be
added easily
Must be open, not a proprietary database
Approach allows hosting on standalone laptop for
traveling users etc
Additional speed over browser based versions
Read information into excel or access via ODBC. Not
limited to provided functionality like many browser
based applications.
6. Data Collection Process
Basic Flow
Individuals or organizations will send their data of completed
projects to the metrics analyst or person responsible for
collection/analysis.
All incoming data must be stored (which should includes
versioning in case updates come in from the same source) and
then reviewed for integrity and completeness. If there are
uncertainties, the metrics analyst has to clarify the points.
Having a RDBMS system makes tracking and updates very easy.
If a normalization process is required, save both versions of the
data.
Once a completed project passes the QA, it will be available in
the database for retrieval. This includes retrieval for the purpose
of ‘estimate by analogy’, more analysis (GQM or finding new
correlations) and calibration of estimation models.
7. Data Collection Process – Lessons
Learned
Identify business goals. Use GQM. Setting goals enables a metric
program to enhance business results, reduce cost by keeping a
program well-defined and focused, and ensure a basis for improving
a business’ return of investment for IT.
Clear definitions are essential but people will not always follow
them. Personally talk to them and interview to capture data. Do not
just take a form as face value. Doing this will improve the quality of
data as the interviewer can ask questions to clarify.
People don’t read instructions. They might provide ‘just a
number’ off the top of their head. Some people might misinterpret
the data on purpose to make them look better on by mistake.
Personally talk to them.
Sensitive data: if people/departments/companies don’t want to
share sensitive data or have concerns, try to sanitize the data.
8. Data Collection Process – Lessons
Learned
Cost of data collection: some will claim that data collection cost
too much. Go through the list of benefits and back it up by data
showing that estimation/project success increases when using a
historical database/calibrated models.
E.g. tell your manager for instance “software metrics will help us reduce
the number of faults reported in newly developed software by 25%
without increasing project schedules. The resulting savings in support
costs should drive a 150% ROI in the first year”.
Cost of data collection 2: some developers will claim they are not
paid to collect data. Determine their claimed CMM/CMMI rating. If it
is 3 or higher, collecting data is required. Ask for that data in their
format and offer to fill in the forms yourself.
9. Data Collection Process – Lessons
Learned
Use a good code counter. See the list of code
counters on the QSM.com site. The ‘understand’ code
counter is also used quite often in companies.
Be sure to discriminate auto-generated code from
hand generated code. Auto-generated code does not
have the same correlation to effort as hand generated.
Collect completed project actuals first: Start by
collecting data from completed projects first and THEN
collect from projects that are still underway.
10. Data Collection Process – Lessons
Learned
Qualify the data quality: Some data collected will be
nonsensical. There are 2 approaches to handle this:
Eliminate this data altogether. (not really recommended as data
is lost)
Include a qualifier on the data rating it ‘a’ to ‘f’. The ISBSG
database has a rating similar to this.
Capture both total size and amount of reuse:
Reuse is an essential part of software size. Just
collecting total size will skew the size/effort correlation.
Don’t eliminate data points just because of the
programming language: size can be converted from one
language to another!
11. Data Collection Process – Lessons
Learned
Have a normalization process and keep the data
both in raw and normalized forms.
Data will be collected in varying phases, labor categories, size
definitions etc. Keep the raw data. And have a standard, well
documented normalization process that is rigorously followed to
normalize to a standard set of activities, phases etc.
Have a structure for data storage: An excel sheet
can be used but will become unworkable as the
database grows. Get the data into an open database
asap.
Offer them something in return: this could be a
sanitized copy of the database or at least a benchmark
showing how data fits with the rest of the database!
12. Data Integrity
Good quality data is paramount to ensure
good calibration results.
13. Data Integrity - Checklist
Review the goal of the data collection
What is the data being used for? E.g. project type
calibration, later use for estimation by analogy etc.
This drives the data being collected.
Ensure the integrity of the data collection
process
Have the groups providing data been trained with
regard to the required data?
Definitions
Are different projects providing data using the same
data definitions?
14. Data Integrity - Checklist
Approval of Inputs
Has at least one designated individual approved the
inputs for each project?
Missing Data
Has any missing data been identified?
Estimates/Actuals
Are estimates of data items used in place of missing
actual data?
Rationale
Provide written rationale for any estimates used in
the calibration
15. Data Integrity - Checklist
Sensitivity Analysis
If estimates are used in lieu of actuals, has a
sensitivity analysis been done to evaluate the impact
on the calibration of varying assumptions with respect
to the estimates?
Extra Data
Has any extra data or different definitions been used?
Changes
Describe any changes made and the rationale for
them.
16. Data Integrity - Checklist
Additional Data
Has any additional data been collected that
can be used for later purposes?
Identify the extra data and how it might be
used. Examples include effort and schedule
portions for detailed phases and activities.
Size Conversion
Have all size measures been converted to
eSLOC or another base unit?
17. Data Integrity - Checklist
Counting Conventions
What SLOC counting conventions were followed
(logical SLOC, physical SLOC etc)?
If SLOC is not used, what definitions were followed
(such as IFPUG 4.2 standard, use cases 2.0)
Reuse
Are all reuse parameters provided for reused,
modified and COTS software portions?
Has all reuse and modification been accounted for
and converted into equivalent SLOC?
18. Data Integrity - Checklist
Reused/Modified
Does the total equivalent size include all new software and the
equivalent sizes of reused and modified software?
Evolution
Has Requirements Evolution been reported?
Input Ranges
Make sure that there are no ranges in the volume input, as that
would indicate previously estimated values.
Factors
Has the environment and scaling factors been updated?
Hours per Month
Has the correct HPM been applied?
19. Data Integrity – Additional Tips
Actual Phase Information: all activities may NOT be included. E.g.
system concept and integration is excluded.
Actual Labor Information: all activities may NOT be included. E.g.
configuration and quality assurance is excluded.
Was the schedule ‘stop and start’?
Resources: where there hard-hitting resource constraints?
Volatility: did requirements undergo extraordinary evolution?
Manager’s objectives: was the project to complete in ‘minimum
time’ or ‘least cost’?
Effort: are effort figures actually derived from cost figures?
Always run sanity checks on data. E.g. one million lines of
code cannot be developed in 3 months.