Downloaded 533 times


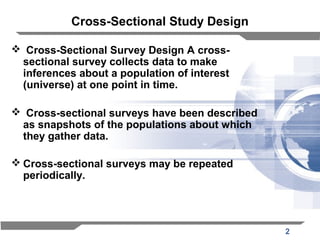
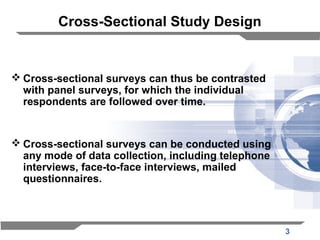
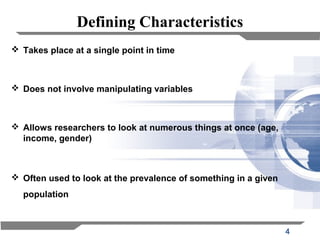


The document discusses two research designs: cross-sectional and longitudinal. Cross-sectional studies collect data from a population at a single point in time, providing insights but facing limitations such as cohort differences and participant variability. Longitudinal studies track the same individuals over time, allowing for better causal inferences but are often time-consuming, costly, and may suffer from participant dropout.