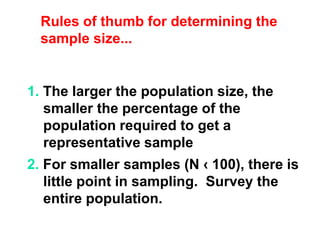
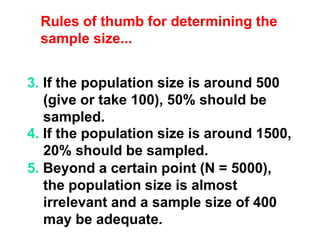
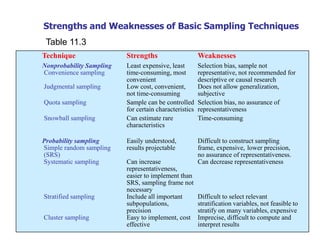
This document provides guidance on determining appropriate sample sizes based on population size. It states that for populations under 100, the entire population should be surveyed. For populations around 500, a sample size of 50% is recommended, while for populations around 1,500, a sample size of 20% is recommended. Beyond a population of 5,000, a sample size of 400 may be adequate regardless of total population size. The document also provides a table comparing strengths and weaknesses of different sampling techniques, including probability and non-probability methods.
I’m a young Pakistani Blogger, Academic Writer, Freelancer, Quaidian & MPhil Scholar, Quote Lover, Co-Founder at Essar Student Fund & Blueprism Academia, belonging from Mehdiabad, Skardu, Gilgit Baltistan, Pakistan.
I am an academic writer & freelancer! I can work on Research Paper, Thesis Writing, Academic Research, Research Project, Proposals, Assignments, Business Plans, and Case study research.
Expertise:
Management Sciences, Business Management, Marketing, HRM, Banking, Business Marketing, Corporate Finance, International Business Management
For Order Online:
Whatsapp: +923452502478
Portfolio Link: https://blueprismacademia.wordpress.com/
Email: arguni.hasnain@gmail.com
Follow Me:
Linkedin: arguni_hasnain
Instagram : arguni.hasnain
Facebook: arguni.hasnain
Data Analysis & Interpretation and Report WritingSOMASUNDARAM T
Statistical Methods for Data Analysis (Only Theory), Meaning of Interpretation, Technique of Interpretation, Significance of Report Writing, Steps, Layout of Research Report, Types of Research Reports, Precautions while writing research reports
Data Presentation & Analysis Meaning, Stages of data analysis, Quantitative & Qualitative data analysis methods, Descriptive & inferential methods of data analysis
Statistical Processes
Can descriptive statistical processes be used in determining relationships, differences, or effects in your research question and testable null hypothesis? Why or why not? Also, address the value of descriptive statistics for the forensic psychology research problem that you have identified for your course project. read an article for additional information on descriptive statistics and pictorial data presentations.
300 words APA rules for attributing sources.
Computing Descriptive Statistics
Computing Descriptive Statistics: “Ever Wonder What Secrets They Hold?” The Mean, Mode, Median, Variability, and Standard Deviation
Introduction
Before gaining an appreciation for the value of descriptive statistics in behavioral science environments, one must first become familiar with the type of measurement data these statistical processes use. Knowing the types of measurement data will aid the decision maker in making sure that the chosen statistical method will, indeed, produce the results needed and expected. Using the wrong type of measurement data with a selected statistic tool will result in erroneous results, errors, and ineffective decision making.
Measurement, or numerical, data is divided into four types: nominal, ordinal, interval, and ratio. The businessperson, because of administering questionnaires, taking polls, conducting surveys, administering tests, and counting events, products, and a host of other numerical data instrumentations, garners all the numerical values associated with these four types.
Nominal Data
Nominal data is the simplest of all four forms of numerical data. The mathematical values are assigned to that which is being assessed simply by arbitrarily assigning numerical values to a characteristic, event, occasion, or phenomenon. For example, a human resources (HR) manager wishes to determine the differences in leadership styles between managers who are at different geographical regions. To compute the differences, the HR manager might assign the following values: 1 = West, 2 = Midwest, 3 = North, and so on. The numerical values are not descriptive of anything other than the location and are not indicative of quantity.
Ordinal Data
In terms of ordinal data, the variables contained within the measurement instrument are ranked in order of importance. For example, a product-marketing specialist might be interested in how a consumer group would respond to a new product. To garner the information, the questionnaire administered to a group of consumers would include questions scaled as follows: 1 = Not Likely, 2 = Somewhat Likely, 3 = Likely, 4 = More Than Likely, and 5 = Most Likely. This creates a scale rank order from Not Likely to Most Likely with respect to acceptance of the new consumer product.
Interval Data
Oftentimes, in addition to being ordered, the differences (or intervals) between two adjacent measurement values on a measurement scale are identical. For example, the di ...
PUH 6301, Public Health Research 1 Course Learning OuTatianaMajor22
PUH 6301, Public Health Research 1
Course Learning Outcomes for Unit VI
Upon completion of this unit, students should be able to:
4. Evaluate strategies for data analysis to determine the best statistical tests needed for research
methods.
4.1 Determine the four levels of measurement as valid research statistical techniques in the public
health research process.
4.2 Explain why proper data and statistical analysis is important.
4.3 Describe the basic types of statistic tests.
Course/Unit
Learning Outcomes
Learning Activity
4.1
Unit Lesson
Chapter 28
Chapter 29
Chapter 30
Chapter 31
Chapter 33
Blog: “Descriptive vs. Inferential Statistics: What’s the Difference?
Unit VI Essay
4.2
Unit Lesson
Chapter 28
Unit VI Essay
4.3
Unit Lesson
Chapter 29
Unit VI Essay
Required Unit Resources
Chapter 28: Data Management
Chapter 29: Descriptive Statistics
Chapter 30: Comparative Statistics
Chapter 31: Regression Analysis
Chapter 33: Additional Analysis Tools
In order to access the following resource, click the link below:
The website below provides a good summary of how the public health researcher can use descriptive and
inferential statistics methods to conduct public health research.
Market Research Guy. (2011, December 1). Descriptive vs. inferential statistics: What’s the difference? [Blog
post]. http://www.mymarketresearchmethods.com/descriptive-inferential-statistics-difference/
UNIT VI STUDY GUIDE
Data Analysis Plan
http://www.mymarketresearchmethods.com/descriptive-inferential-statistics-difference/
PUH 6301, Public Health Research 2
UNIT x STUDY GUIDE
Title
Unit Lesson
Introduction
This unit covers the statistical procedures used to analyze the data collected from research tools. During this
stage of research, you may begin to draw conclusions and be able to answer the research question(s) and
sub-question(s) you developed in Unit I. Use statistics in this stage of research to manipulate the data and
make it understandable for others to read. Shi (2008) encourages researchers to know and understand basic
statistics and statistical procedures. The data analysis phase of research is important because it makes sense
of the data that can be used for future research studies (Jacobsen, 2021).
Data Management
Data management is the entire process of keeping a record of all the results of clinical assessments
conducted during a research study (Jacobsen, 2021). Record keeping includes listing details on potential
articles, pulling information from patient charts, tracking responses from surveys, or recording assessment
results from cohorts or studies. It is vital that those responsible for collecting and keeping data maintain
confidentiality and the integrity of data sets from all outside sources. Once researchers enter the data into the
spreadsheet or database, the data should be recoded and double-checked prior to beginning statistical
ana ...
Students, digital devices and success - Andreas Schleicher - 27 May 2024..pptxEduSkills OECD
Andreas Schleicher presents at the OECD webinar ‘Digital devices in schools: detrimental distraction or secret to success?’ on 27 May 2024. The presentation was based on findings from PISA 2022 results and the webinar helped launch the PISA in Focus ‘Managing screen time: How to protect and equip students against distraction’ https://www.oecd-ilibrary.org/education/managing-screen-time_7c225af4-en and the OECD Education Policy Perspective ‘Students, digital devices and success’ can be found here - https://oe.cd/il/5yV
Welcome to TechSoup New Member Orientation and Q&A (May 2024).pdfTechSoup
In this webinar you will learn how your organization can access TechSoup's wide variety of product discount and donation programs. From hardware to software, we'll give you a tour of the tools available to help your nonprofit with productivity, collaboration, financial management, donor tracking, security, and more.
Synthetic Fiber Construction in lab .pptxPavel ( NSTU)
Synthetic fiber production is a fascinating and complex field that blends chemistry, engineering, and environmental science. By understanding these aspects, students can gain a comprehensive view of synthetic fiber production, its impact on society and the environment, and the potential for future innovations. Synthetic fibers play a crucial role in modern society, impacting various aspects of daily life, industry, and the environment. ynthetic fibers are integral to modern life, offering a range of benefits from cost-effectiveness and versatility to innovative applications and performance characteristics. While they pose environmental challenges, ongoing research and development aim to create more sustainable and eco-friendly alternatives. Understanding the importance of synthetic fibers helps in appreciating their role in the economy, industry, and daily life, while also emphasizing the need for sustainable practices and innovation.
2024.06.01 Introducing a competency framework for languag learning materials ...Sandy Millin
http://sandymillin.wordpress.com/iateflwebinar2024
Published classroom materials form the basis of syllabuses, drive teacher professional development, and have a potentially huge influence on learners, teachers and education systems. All teachers also create their own materials, whether a few sentences on a blackboard, a highly-structured fully-realised online course, or anything in between. Despite this, the knowledge and skills needed to create effective language learning materials are rarely part of teacher training, and are mostly learnt by trial and error.
Knowledge and skills frameworks, generally called competency frameworks, for ELT teachers, trainers and managers have existed for a few years now. However, until I created one for my MA dissertation, there wasn’t one drawing together what we need to know and do to be able to effectively produce language learning materials.
This webinar will introduce you to my framework, highlighting the key competencies I identified from my research. It will also show how anybody involved in language teaching (any language, not just English!), teacher training, managing schools or developing language learning materials can benefit from using the framework.
How to Create Map Views in the Odoo 17 ERPCeline George
The map views are useful for providing a geographical representation of data. They allow users to visualize and analyze the data in a more intuitive manner.
Read| The latest issue of The Challenger is here! We are thrilled to announce that our school paper has qualified for the NATIONAL SCHOOLS PRESS CONFERENCE (NSPC) 2024. Thank you for your unwavering support and trust. Dive into the stories that made us stand out!
Model Attribute Check Company Auto PropertyCeline George
In Odoo, the multi-company feature allows you to manage multiple companies within a single Odoo database instance. Each company can have its own configurations while still sharing common resources such as products, customers, and suppliers.
We all have good and bad thoughts from time to time and situation to situation. We are bombarded daily with spiraling thoughts(both negative and positive) creating all-consuming feel , making us difficult to manage with associated suffering. Good thoughts are like our Mob Signal (Positive thought) amidst noise(negative thought) in the atmosphere. Negative thoughts like noise outweigh positive thoughts. These thoughts often create unwanted confusion, trouble, stress and frustration in our mind as well as chaos in our physical world. Negative thoughts are also known as “distorted thinking”.
The Roman Empire A Historical Colossus.pdfkaushalkr1407
The Roman Empire, a vast and enduring power, stands as one of history's most remarkable civilizations, leaving an indelible imprint on the world. It emerged from the Roman Republic, transitioning into an imperial powerhouse under the leadership of Augustus Caesar in 27 BCE. This transformation marked the beginning of an era defined by unprecedented territorial expansion, architectural marvels, and profound cultural influence.
The empire's roots lie in the city of Rome, founded, according to legend, by Romulus in 753 BCE. Over centuries, Rome evolved from a small settlement to a formidable republic, characterized by a complex political system with elected officials and checks on power. However, internal strife, class conflicts, and military ambitions paved the way for the end of the Republic. Julius Caesar’s dictatorship and subsequent assassination in 44 BCE created a power vacuum, leading to a civil war. Octavian, later Augustus, emerged victorious, heralding the Roman Empire’s birth.
Under Augustus, the empire experienced the Pax Romana, a 200-year period of relative peace and stability. Augustus reformed the military, established efficient administrative systems, and initiated grand construction projects. The empire's borders expanded, encompassing territories from Britain to Egypt and from Spain to the Euphrates. Roman legions, renowned for their discipline and engineering prowess, secured and maintained these vast territories, building roads, fortifications, and cities that facilitated control and integration.
The Roman Empire’s society was hierarchical, with a rigid class system. At the top were the patricians, wealthy elites who held significant political power. Below them were the plebeians, free citizens with limited political influence, and the vast numbers of slaves who formed the backbone of the economy. The family unit was central, governed by the paterfamilias, the male head who held absolute authority.
Culturally, the Romans were eclectic, absorbing and adapting elements from the civilizations they encountered, particularly the Greeks. Roman art, literature, and philosophy reflected this synthesis, creating a rich cultural tapestry. Latin, the Roman language, became the lingua franca of the Western world, influencing numerous modern languages.
Roman architecture and engineering achievements were monumental. They perfected the arch, vault, and dome, constructing enduring structures like the Colosseum, Pantheon, and aqueducts. These engineering marvels not only showcased Roman ingenuity but also served practical purposes, from public entertainment to water supply.
The Art Pastor's Guide to Sabbath | Steve ThomasonSteve Thomason
What is the purpose of the Sabbath Law in the Torah. It is interesting to compare how the context of the law shifts from Exodus to Deuteronomy. Who gets to rest, and why?
Digital Tools and AI for Teaching Learning and Research
Research Method for Business chapter 11-12-14
1. 2. For smaller samples (N ‹ 100), there is
little point in sampling. Survey the
entire population.
1. The larger the population size, the
smaller the percentage of the
population required to get a
representative sample
Rules of thumb for determining the
sample size...
2. 4. If the population size is around 1500,
20% should be sampled.
3. If the population size is around 500
(give or take 100), 50% should be
sampled.
5. Beyond a certain point (N = 5000),
the population size is almost
irrelevant and a sample size of 400
may be adequate.
Rules of thumb for determining the
sample size...
3. Technique Strengths Weaknesses
Nonprobability Sampling
Convenience sampling
Least expensive, least
time-consuming, most
convenient
Selection bias, sample not
representative, not recommended for
descriptive or causal research
Judgmental sampling Low cost, convenient,
not time-consuming
Does not allow generalization,
subjective
Quota sampling Sample can be controlled
for certain characteristics
Selection bias, no assurance of
representativeness
Snowball sampling Can estimate rare
characteristics
Time-consuming
Probability sampling
Simple random sampling
(SRS)
Easily understood,
results projectable
Difficult to construct sampling
frame, expensive, lower precision,
no assurance of representativeness.
Systematic sampling Can increase
representativeness,
easier to implement than
SRS, sampling frame not
necessary
Can decrease representativeness
Stratified sampling Include all important
subpopulations,
precision
Difficult to select relevant
stratification variables, not feasible to
stratify on many variables, expensive
Cluster sampling Easy to implement, cost
effective
Imprecise, difficult to compute and
interpret results
Table 11.3
Strengths and Weaknesses of Basic Sampling Techniques
4. 1. Getting Data Ready for Analysis
• After data are obtained through questionnaires, interviews,
observation, or through secondary sources, they need to be
edited.
• The blank responses, if any, have to be handled in some way,
the data coded, and a categorization scheme has to be set up.
• The data will then have to be keyed in, and some software
program used to analyze them.
Ch- 11 : Data Analysis and Interpretation
5. 1. Getting Data Ready for Analysis
2. Getting a feel for the data
3. Testing goodness of the data
Ch- 11 : Quantitative Data Analysis
7. 1.1 Editing Data
Data have to be edited, especially when they relate to
responses to open-ended questions of interviews and
questionnaires, or unstructured observations.
The edited data should be identifiable through the use of a
different color pencil or ink so that the original information is
still available in case of further doubts later.
Incoming mailed questionnaire data have to be checked for
incompleteness and inconsistencies.
Whenever possible, it would be better to follow up with
respondent and get the correct data while editing.
Ch- 11 : Quantitative Data Analysis
8. 1.2 Handling Blank Responses
Answers may have been left blank because the respondent did
not understand the question, did not know the answer, was not
willing to answer, or was simply indifferent to the need to
respond the entire questionnaire.
If a substantial number of questions—say, 25% of the items in
the questionnaire—have been left unanswered, it may be a
good idea to drop the questionnaire.
One way to handle a blank response to an interval-scaled item
with a mid-point would be to assign the midpoint in the scale as
the response to that particular item.
An alternative way is to allow the computer to ignore the blank
responses when the analyses are done.
Ch- 11 : Quantitative Data Analysis
9. 1.3 Coding the responses
The next step is to code the responses. Scanner sheets facilitate
the entry of the responses directly into the computer without
manual keying in of the data.
Also one may use a coding sheet first to transcribe the data from
the questionnaire and then key in the data.
1.4 Categorization
At this point it is useful to set up a scheme for categorizing the
variables such that the several items measuring a concept are all
grouped together.
Responses to some of the negatively worded questions have also
to be reversed so that all answers are in the same direction.
Ch- 11 : Data Analysis and Interpretation
10. 1.5 Entering Data
If questionnaire data are not collected on scanner answer
sheets, which can be directly entered into the computer as a
data file, the raw data will have to be manually keyed into the
computer.
Raw data can be entered through any software program.
For instance, the SPSS Data Editor, which looks like a spread
sheet, can enter, edit, and view the contents of the data file.
Ch- 11 : Quantitative Data Analysis
11. 2. Data Analysis
2.1 Basic Objectives in Data Analysis
In data analysis we have three objectives:
1) Getting a feel for the data
2) Testing the goodness of data
3) Testing the hypotheses developed for the research.
Ch- 11 : Data Analysis and Interpretation
12. 2. Data Analysis
2.1 Basic Objectives in Data Analysis
1) The first objective - feel for the data will give preliminary ideas of
how good the scales are, how well the coding and entering of data
have been done, and so on.
2) The second objective— testing the goodness of data—can be
accomplished by submitting the data for factor analysis, obtaining
the Cronbach’s alpha or the split-half reliability of the measures,
and so on.
3) The third objective —hypotheses testing –is achieved by choosing
the appropriate menus of the software programs, to test each of
the hypotheses using the relevant statistical test. The results of
these tests will determine whether or not the hypotheses are
substantiated.
Ch- 11 : Data Analysis and Interpretation
14. Empirical Rule (The 68-95-99.7 Rule): If the
distribution is normal, then
Approximately 68% of the data falls within one
standard deviation of the mean
Approximately 95% of the data falls within two
standard deviations of the mean
Approximately 99.7% of the data falls within three
standard deviations of the mean
Distribution Properties
17. If the data distribution is bell-shaped,
then the interval:
contains about 68% of the values
in the population or the sample
The Empirical Rule
1σμ
μ
68%
1σμ
18. Chap 3-18
contains about 95% of the values
in the population or the sample
contains about 99.7% of the
values in the population or the sample
2σμ
3σμ
3σμ
99.7%95%
2σμ
The Empirical Rule
σ
σ
19. Chap 3-19
Shape of a Distribution
Describes how data are distributed
Measures of shape
Symmetric or skewed
Mean = MedianMean < Median Median < Mean
Right-SkewedLeft-Skewed Symmetric
20. Cronbach's is defined as
where is the number of components (K-items or testlets), the variance
of the observed total test scores, and the variance of component i for
the current sample of persons. See Develles (1991).
Ch- 11 : Quantitative Data Analysis
Numerical
21. 2.2 Feel for the Data (visual summary)
We can acquire a feel for the data by checking the central
tendency and the dispersion.
The mean, the range, the standard deviation, and the variance
in the data will give the researcher a good idea of how the
respondents have reacted to the items in the questionnaire and
how good the items and measures are.
The maximum and minimum scores, mean, standard deviation,
variance, and other statistics can be easily obtained, and these
will indicate whether the responses range satisfactorily over the
scale.
A frequency distribution of the nominal variables of interest
should be obtained. Visual displays thereof through
histogram/bar charts, and so on, can also be provided through
programs that generate charts.
Ch- 11 : Quantitative Data Analysis
22. Frequencies
Number of times various subcategories of a certain
phenomenon occur from which the percentage and the
cumulative percentage of their occurrence can be easily
calculated
Ch- 11 : Quantitative Data Analysis
23. Measures of central tendencies
The Mean
The Median
Mode
Range dispersion
Variance
Standard deviation
Ch- 11 : Quantitative Data Analysis
Numerical
distribution
24. The Normal Distribution Curve
0
0.005
0.01
0.015
0.02
0.025
0 20 40 60 80 100
It is bell-shaped and symmetrical about the mean
The mean, median and mode are equal
Mean, Median, Mode
It is a function of the mean and the standard deviation
25. Average often means the ‘mean’
Mean = total of the numbers divided by how many
numbers.
Class shoe sizes: 3, 5, 5, 6, 4, 3, 2, 1, 5, 6
Add up the numbers:
3 + 5 + 5 + 6 + 4 + 3 + 2 + 1 + 5 + 6 = 40
Divide by how many numbers:
40 ÷ 10 = 4
The class mean shoe size is 4
Ch- 11 : Quantitative Data Analysis
Mean;
26. Ch- 11 : Quantitative Data Analysis
Median;
Median is the middle value
Put the numbers in order
Choose the number in the middle of the list.
If there are 2 numbers in the middle then it is halfway
between them.
Class shoe sizes: 3, 5, 5, 6, 4, 3, 2, 1, 5, 6
Put in order: 1, 2, 3, 3, 4, 5, 5, 5, 6, 6
The class median shoe size is 4.5
27. Ch- 11 : Quantitative Data Analysis
Mode;
Mode is the most common number
Put the numbers in order
Choose the number that appears the most frequently.
Sometimes there may be more than one mode.
Class shoe sizes: 3, 5, 5, 6, 4, 3, 2, 1, 5, 6
Put in order: 1, 2, 3, 3, 4, 5, 5, 5, 6, 6
The class modal shoe size is 5.
28. Ch- 11 : Quantitative Data Analysis
Range; (dispersion)
Range is how far from biggest to smallest.
Put the numbers in order
Take the smallest number from the largest.
Class shoe sizes: 3, 5, 5, 6, 4, 3, 2, 1, 5, 6
Put in order: 1, 2, 3, 3, 4, 5, 5, 5, 6, 6
Subtract smallest from largest: 6 – 1 = 5
Range: 5
29. 2.3 Testing Goodness of Data
a. Reliability
The reliability of a measure is established by testing for
both consistency and stability.
Consistency indicates how well the items measuring a
concept hang together as a set.
Cronbach’s alpha is a reliability coefficient that indicates
how well the items in a set are positively correlated to one
another.
Cronbach’s alpha is computed in terms of the average
intercorrelations among the items measuring the concept.
The closer Cronbach’s alpha is to 1, the higher the internal
consistency reliability.
Ch- 11 : Quantitative Data Analysis
30. Another measure of consistency reliability used in specific
situations is the split-half reliability coefficient.
Since this reflects the correlations between two halves of a set
of items, the coefficients obtained will vary depending on how
the scale is split. Sometimes split-half reliability is obtained to
test for consistency when more than one scale, dimension, or
factor, is assessed.
The stability of measures can be assessed through parallel
form reliability and test-retest reliability.
When a high correlation between two similar forms of a
measure is obtained, parallel form reliability is established.
Test-retest reliability can be established by computing the
correlation between the same tests administered at two
different time periods.
Ch- 11 : Quantitative Data Analysis
31. b. Validity
Factorial validity can be established by submitting the data for
factor analysis.
The results of factor analysis (a multivariate technique) will
confirm whether or not the theorized dimensions emerge.
Factor analysis would reveal whether the dimensions are
indeed tapped by the items in the measure, as theorized.
Criterion-related validity can be established by testing for the
power of the measure to differentiate individuals who are
known to be different.
Ch- 11 : Quantitative Data Analysis
32. Convergent validity can be established when there is high
degree of correlation between two different sources responding
to the same measure (e.g., both supervisors and subordinates
respond similarly to a perceived reward system measure
administered to them).
Discriminant validity can be established when two
distinctly different concepts are not correlated to each other as,
for example
courage and honesty;
leadership and motivation;
attitudes and behavior
Ch- 11 : Quantitative Data Analysis
33. 2.4 Hypothesis Testing
Once the data are ready for analysis, (i.e., out-of-range/missing
responses, etc., are cleaned up, and the goodness of the
measures is established), the researcher is ready to test the
hypotheses already developed for the study.
In the Module at the end of the text book, the statistical tests
that would be appropriate for different hypotheses and for data
obtained on different scales are discussed.
3. Data Analysis and Interpretation
Data analysis and interpretation of results can be best
understood by referring to an example of a business research
project.
Please see Data Analysis discussion of Excelsior Enterprises
in the text book from Page 309-322.
Ch- 11 : Quantitative Data Analysis
34. 4. Some Software Packages Useful for Data
Analysis
4.1 SPSS Software Packages
• SPSS has software programs that can create surveys
(questionnaire design) through the SPSS Data Entry Builder
• Collect data over the Internet or Intranet through the SPSS
Data Entry Enterprises Server,
• Enter the collected data through the SPSS Data Entry
Station, and SPSS 11.0 to analyze the data collected.
Ch- 11 : Quantitative Data Analysis
35. 4.2 Various Other Software Programs
Go to the Internet and explore
http://www.asc.org.uk/Register/ShowPackage.asp?ID=162
and the subsequent IDs it indicates. It shows variety of software
programs with a wide range of capabilities. A few of these are:
1. Askia
2. ATLAS. ti
3. Bellview CATI
4. Brand2hand
Ch- 11 : Quantitative Data Analysis
36. 4.3 Use of Expert Systems in Choosing the
Appropriate Statistical Tests
• The Expert System employs unique programming techniques to
model the decisions that experts make.
• A considerable body of knowledge fed into the system and some
good software and hardware help the individual using it to make
sound decisions about the problem that he or she is concerned
about solving.
Ch- 11 : Quantitative Data Analysis
37. 4.3 Use of Expert Systems in Choosing the
Appropriate Statistical Tests
• Expert Systems relating to data analysis help the perplexed
researcher to choose the most appropriate statistical procedure
for testing different types of hypothesis.
• The Statistical Navigator is an Expert System that recommends
one or more statistical procedures after seeking information on
the goals.
• The Statistical Navigator is a useful guide for those who are well
versed in statistics but want to ensure that they use the
appropriate statistical techniques.
Ch- 11 : Quantitative Data Analysis
38. Ch-12 : Data Analysis
1. Data ware house
2. Data Mining
3. Operations
4. T-test from single mean
39. Data Warehousing?
A Data Warehouse is a computerized collection of
mined data.
What is Data Mining?
Data Mining is the process of collecting large amounts of
raw data and transforming that data into useful information.
Data mining is the practice of searching through large
amounts of computerized data to find useful patterns or
trends (American Heritage Dictionary, 2008).
Ch- 12 : Quantitative Data Analysis
40. Data Warehousing Advantages
Access to information
Data Inconsistency
Decrease Computing Cost
Productivity Increase
Increase company profits
Ch- 12 : Quantitative Data Analysis
41. Data Warehousing Disadvantages
Data must be cleaned, loaded, and extracted
80% of the overall process
User Variability
Proper Training
Difficult to Maintain
Incongruence among systems
Ch- 12 : Quantitative Data Analysis
43. Data Mining Advantages
Improves Customer Satisfaction/service
Saves Time and Money
Increases Sales Effectiveness
Increases profitability
Ch- 12 : Quantitative Data Analysis
44. Data Mining Advantages
Require skilled technical users to interpret and
analyze data from warehouse
Validity of the patterns
Related to real world circumstances
Unable to Identify Casual Relationships
Reserved for the few instead of the many
Ch- 12 : Quantitative Data Analysis
45. Conclusion/Analysis
Data mining is the extraction of information that can
predict future trends & behaviors
Requires a large amount of data to be collected, and then
stored in data warehouse
Possible violation of privacy in some circumstances
Government is getting involved with regulation, despite
the counterterrorism program being a possible violation
Ch- 12 : Quantitative Data Analysis
47. 1. The Research Proposal
Contents:
a. The broad goals of the study
b. The specific problem
c. Details of study procedures
d. The Research Design
i. The Sampling Design
ii. Data Collection Methods
iii. Data Analysis
e. Time Frame of the Study
f. The Budget
Ch-14 : The Research Report
48. 2. Written report
a. Descriptive Report
- Investigative
- Understand a problem
- Knowledge of a process
- Understand behavioral variables
b. Report to “Sell” and Idea or Project
- Launch of a New Product
- Investment in a Project
- Restructuring the Organization
- Implementing a new MIS
Ch-14 : The Research Report
49. 1. Title
2. Table of Contents
3. Executive Summary
4. Introduction
5. Research Design and
Methodology
a. Preliminary Data
Gathering
b. Literature Survey
c. Problem Definition
d. Theoretical Framework
e. Hypothesis
6. Data Collection
7. Data Analysis
8. Data Interpretation
a. Hypothesis
Testing
b. Main Conclusions
9. Limitations
10. Recommendations
11. References
12. Appendices
a. Secondary Data
b. Questionnaires
c. Other Supporting Data
Ch-14 : The Research Report
3. FORMAT OF FINAL REPORT
50. 4. Oral Presentation
Contents
a. Presentation Method: Power Point Slide Show
b. Visual Aids: Charts, graphs
c. Presenter’s appearance and style
d. Good use of Verbal communication Skills
e. Good use of Nonverbal Communication Skills
f. Handling Questions
Ch-14 : The Research Report