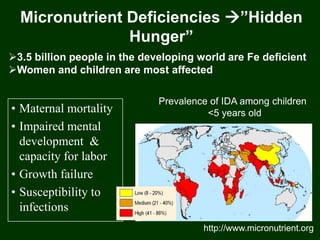
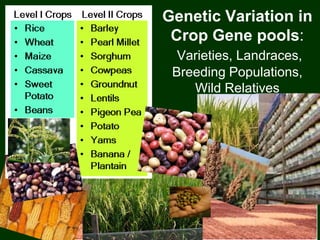
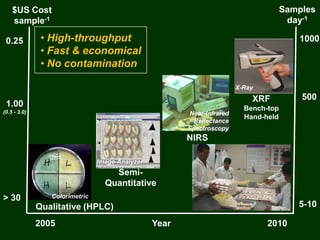
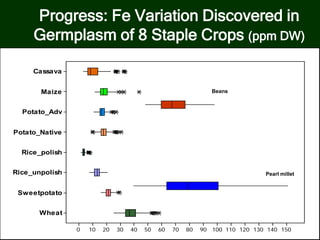
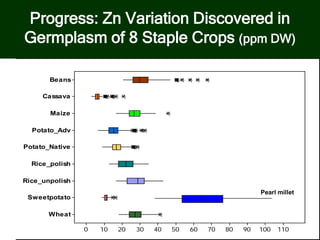
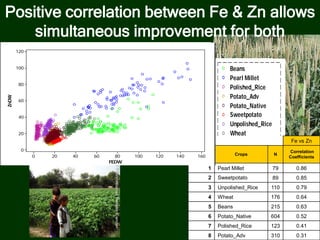
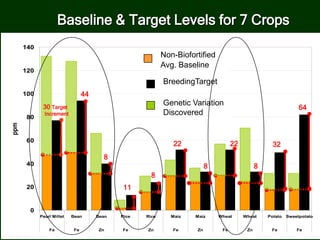
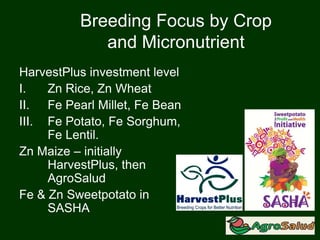
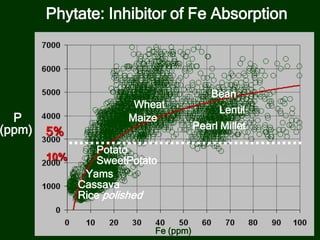
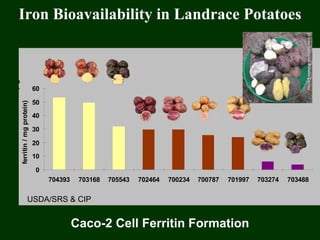
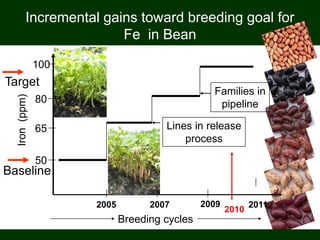
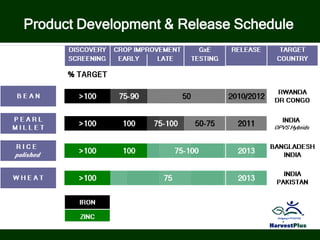
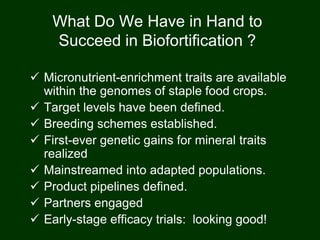
Challenges, Progress & State-of-
art in Breeding for Iron/Zinc
First Global Conference on Biofortification
November 9-11, 2010, Washington, DC
Merideth Bonierbale
International Potato Center
Wolfgang Pfeiffer
HarvestPlus
HarvestPlus Crop Leaders
3.5 billion people in the developing world are Fe deficient
Women and children are most affected
Micronutrient Deficiencies ”Hidden
Hunger”
http://www.micronutrient.org
Prevalence of IDA among children
<5 years old• Maternal mortality
• Impaired mental
development &
capacity for labor
• Growth failure
• Susceptibility to
infections
Outline
• Genetic Variation in Crop Gene
pools
• Setting Breeding Targets
• Genetic Gains Achieved
• Molecular and Biotechnologies
• Product Delivery
• Research Needs
Genetic Variation in
Crop Gene pools:
Varieties, Landraces,
Breeding Populations,
Wild Relatives
Qualitative (HPLC)
Semi-
Quantitative
NIRS
XRF
Bench-top
Hand-held
Colorimetric
Image-Analyzer
Near-Infrared
Reflectance
Spectroscopy
X-Ray
Year 20102005
Samples
day-1
1000
500
$US Cost
sample-1
0.25
1.00
(0.5 - 3.0)
• High-throughput
• Fast & economical
• No contamination
> 30
5-10
e.g. Worldwide NIRS Quality Network
for Sweetpotato (and other crops)
Progress: Fe Variation Discovered in
Germplasm of 8 Staple Crops (ppm DW)
Wheat
Sweetpotato
Rice_unpolish
Rice_polish
Potato_Native
Potato_Adv
Maize
Cassava
6050403020100
Wheat
Sweetpotato
Rice_unpolish
Rice_polish
Potato_Native
Potato_Adv
Maize
Cassava
1501401301201101009080706050403020100
Beans
Pearl millet
Wheat
Sweetpotato
Rice_unpolish
Rice_polish
Potato_Native
Potato_Adv
Maize
Cassava
Beans
1101009080706050403020100
Pearl millet
Progress: Zn Variation Discovered in
Germplasm of 8 Staple Crops (ppm DW)
Beans
Pearl Millet
Polished_Rice
Potato_Adv
Potato_Native
Sweetpotato
Unpolished_Rice
Wheat
Fe vs Zn
Ord Crops N
Correlation
Coefficients
1 Pearl Millet 79 0.86
2 Sweetpotato 89 0.85
3 Unpolished_Rice 110 0.79
4 Wheat 176 0.64
5 Beans 215 0.63
6 Potato_Native 604 0.52
7 Polished_Rice 123 0.41
8 Potato_Adv 310 0.31
FEDW
ZnDW
160140120100806040200
120
100
80
60
40
20
0
Positive correlation between Fe & Zn allows
simultaneous improvement for both
The amount of Fe or Zn required in a
biofortified crop for significant impact
on nutritional status
Breeding Target
• ‘Baseline’ = amount obtained from
varieties consumed by
target population
+
• ‘Increment’ = amount to be added by
breeding
=
Consumption level
(g/day)
Increment of
nutrient required for
health impact
Concentration of
nutrient in the
crop as
consumed (after
storage, milling &
cooking )
Bioavailability
of nutrient in
the diet
Target
Nutrient
Content of
Staple
Foods
Influencial Factors
Primary Sources of Food for Populations at
Risk of Malnutrition
Intakeingrams
gen
Yams
Potato
Cassava
OFSP
Cowpea
Lentil
Bean
Maize
W
heat
Rice
Pearl M
illet
Barley
Sorghum
500
400
300
200
100
0
Grains
(100% DM)
Legumes
(100% DM)
Roots
(33% DM)
Tubers
(25-33% DM)
Intakeingrams
gen
Yams
Potato
Cassava
OFSP
Cowpea
Lentil
Bean
Maize
W
heat
Rice
Pearl M
illet
Barley
Sorghum
500
400
300
200
100
0
Grains
(100% DM)
Legumes
(100% DM)
Roots
(33% DM)
Tubers
(25-33% DM)
Consumption Levels of 13 Staple Food Crops
(DW) (DW) (FW) (FW)
Targeting Food & Production Systems
High Zn Wheat Targets in India
ME1: Temperate Irrigated
High Production
ME5: Irrigated High
Temperate Stress
42
38
46
36
22
19
12
11
12
14
9
8
6
4
9
8
4
2
3
2
4
7
5
18
0 10 20 30 40 50 60 70 80 90 100
Women
Children
Women
Children
AbundanceScarcity
Cereals Potato Vegetablesandfruits
Pulses Noodles Foodfronsocialprograms
Breadandcookies Sugars Meatandchicken
Other
Dietary Sources of Fe in Huancavelica, Peru
0
20
40
60
80
100
120
140
Pearl Millet Bean Bean Rice Rice Maiz Maiz Wheat Wheat Potato Sweetpotato
Fe Fe Zn Fe Zn Fe Zn Fe Zn Fe Fe
ppm
Baseline & Target Levels for 7 Crops
8
44
8
8
32
64
8
11
22 22
Non-Biofortified
Avg. Baseline
BreedingTarget
Genetic Variation
Discovered
30 Target
Increment
Breeding Focus by Crop
and Micronutrient
HarvestPlus investment level
I. Zn Rice, Zn Wheat
II. Fe Pearl Millet, Fe Bean
III. Fe Potato, Fe Sorghum,
Fe Lentil.
Zn Maize – initially
HarvestPlus, then
AgroSalud
Fe & Zn Sweetpotato in
SASHA
Fe (ppm)
P
(ppm)
Rice polished
Maize
Wheat
Bean
Cassava
Potato
Lentil
Pearl Millet
Yams
Phytate: Inhibitor of Fe Absorption
5%
SweetPotato10%
Iron Bioavailability in Landrace Potatoes
0
10
20
30
40
50
60
704393 703168 705543 702464 700234 700787 701997 703274 703488
Caco2cellsferritinformation(ng
ferritin/mgprotein)
Caco-2 Cell Ferritin Formation
USDA/SRS & CIP
0,0
5,0
10,0
15,0
20,0
25,0
30,0
15,5 23,3 31,1 38,8 46,6 54,4 62,1 69,9 77,7 85,4 93,2
mg Ac Ascorbico/ 100g DW
Porcetajedepoblación
Base Population
k = 5%
Progeny of selected
individuals
mg Vitamin C/ 100g
Percent
Genetic Gains from Selection
Gs = k * δp * H2
Selection
Intensity
HeritabilityGenetic
Variation
Non-negotiable
Core Traits
Product Attributes - Breeding Objectives
Fe Zn
FV
N=89
PBF
N=64
FV
N=89
PBF
N=64
Genetic Gains for Fe and Zn in OFSP
African farmers’ varieties (FV) vs. Pre-breeding families (PBF
(ppmindrymatter)
Cycle 1 Families: Source of superior
clones
Selected genotypes with high micronutrient concentration
Fe(mg/kg)
32.0
31.0
30.0
29.0
28.0
27.0
26.0
25.0
24.0
23.0
22.0
21.0
20.0
19.0
18.0
17.0
16.5
16.0
15.0
14.0
12.5
12.0
11.0
9.0
8.0
7.0
6.0
5.0
4.0
3.0
2.0
1.0
45
40
35
30
25
20
15
10
5
Boxplot Ranges of Fe (mg/kg) in diploid potato families (NCD-II)
Base line
(17.5 mg/kg
Biotechnologies
–Reduce time and cost to meet breeding
goals
–Exceed levels feasible by conventional
breeding
Identification of genes affecting variation
in Fe & Zn in Bean by QTL analysis
• Overlapping Fe and Zn
QTL suggest common
transcriptional control of
uptake
• Identification of allelic
variation for FRO to
facilitate transfer of high
mineral traits among
genepools and varieties
Blair et al., 2010
Promoter Genomic Wheat Ferritin clone
1DX5 Glutenin Nos
A
B
C
• Introduce extra copies of
the most active wheat
allele of the TaFer1 gene
into wheat.
• Biolistic transformation
using glutenine1Dx5
promoter to drive
endosperm specific
expression.
Transgenic WT- Bob white
Prussian blue stain
Targeting Ferritin to the Wheat Endosperm
Exon Intron
(Aarhus University/Denmark)
Research Agreements & Contracts
with 7 Private Companies - # will
increase
• GxE Performance Testing
• Joint Development of Fe/Zn-dense
Hybrids (private NARS) & OPVs
(public NARS) by Consortium
PartnersPartners in Deployment
Variation for Fe in
Inbred lines & Hybrids
Product Delivery: Case of Pearl Millet
Breeding cycles
Iron(ppm)
2005 2007 2009 2011
50
65
80
100
Lines in release
process
Families in
pipeline
2010
Baseline
Target
Incremental gains toward breeding goal for
Fe in Bean
Wolfgang H PFEIFFER
Product Development & Release Schedule
What Do We Have in Hand to
Succeed in Biofortification ?
 Micronutrient-enrichment traits are available
within the genomes of staple food crops.
 Target levels have been defined.
 Breeding schemes established.
 First-ever genetic gains for mineral traits
realized
 Mainstreamed into adapted populations.
 Product pipelines defined.
 Partners engaged
 Early-stage efficacy trials: looking good!

Challenges, Progress & State-of-art in Breeding for Iron/Zinc

  • 1.
    Challenges, Progress &State-of- art in Breeding for Iron/Zinc First Global Conference on Biofortification November 9-11, 2010, Washington, DC Merideth Bonierbale International Potato Center Wolfgang Pfeiffer HarvestPlus HarvestPlus Crop Leaders
  • 2.
    3.5 billion peoplein the developing world are Fe deficient Women and children are most affected Micronutrient Deficiencies ”Hidden Hunger” http://www.micronutrient.org Prevalence of IDA among children <5 years old• Maternal mortality • Impaired mental development & capacity for labor • Growth failure • Susceptibility to infections
  • 3.
    Outline • Genetic Variationin Crop Gene pools • Setting Breeding Targets • Genetic Gains Achieved • Molecular and Biotechnologies • Product Delivery • Research Needs
  • 4.
    Genetic Variation in CropGene pools: Varieties, Landraces, Breeding Populations, Wild Relatives
  • 5.
  • 6.
    e.g. Worldwide NIRSQuality Network for Sweetpotato (and other crops)
  • 7.
    Progress: Fe VariationDiscovered in Germplasm of 8 Staple Crops (ppm DW) Wheat Sweetpotato Rice_unpolish Rice_polish Potato_Native Potato_Adv Maize Cassava 6050403020100 Wheat Sweetpotato Rice_unpolish Rice_polish Potato_Native Potato_Adv Maize Cassava 1501401301201101009080706050403020100 Beans Pearl millet
  • 8.
  • 9.
    Beans Pearl Millet Polished_Rice Potato_Adv Potato_Native Sweetpotato Unpolished_Rice Wheat Fe vsZn Ord Crops N Correlation Coefficients 1 Pearl Millet 79 0.86 2 Sweetpotato 89 0.85 3 Unpolished_Rice 110 0.79 4 Wheat 176 0.64 5 Beans 215 0.63 6 Potato_Native 604 0.52 7 Polished_Rice 123 0.41 8 Potato_Adv 310 0.31 FEDW ZnDW 160140120100806040200 120 100 80 60 40 20 0 Positive correlation between Fe & Zn allows simultaneous improvement for both
  • 10.
    The amount ofFe or Zn required in a biofortified crop for significant impact on nutritional status Breeding Target • ‘Baseline’ = amount obtained from varieties consumed by target population + • ‘Increment’ = amount to be added by breeding =
  • 11.
    Consumption level (g/day) Increment of nutrientrequired for health impact Concentration of nutrient in the crop as consumed (after storage, milling & cooking ) Bioavailability of nutrient in the diet Target Nutrient Content of Staple Foods Influencial Factors
  • 12.
    Primary Sources ofFood for Populations at Risk of Malnutrition Intakeingrams gen Yams Potato Cassava OFSP Cowpea Lentil Bean Maize W heat Rice Pearl M illet Barley Sorghum 500 400 300 200 100 0 Grains (100% DM) Legumes (100% DM) Roots (33% DM) Tubers (25-33% DM) Intakeingrams gen Yams Potato Cassava OFSP Cowpea Lentil Bean Maize W heat Rice Pearl M illet Barley Sorghum 500 400 300 200 100 0 Grains (100% DM) Legumes (100% DM) Roots (33% DM) Tubers (25-33% DM) Consumption Levels of 13 Staple Food Crops (DW) (DW) (FW) (FW)
  • 13.
    Targeting Food &Production Systems High Zn Wheat Targets in India ME1: Temperate Irrigated High Production ME5: Irrigated High Temperate Stress 42 38 46 36 22 19 12 11 12 14 9 8 6 4 9 8 4 2 3 2 4 7 5 18 0 10 20 30 40 50 60 70 80 90 100 Women Children Women Children AbundanceScarcity Cereals Potato Vegetablesandfruits Pulses Noodles Foodfronsocialprograms Breadandcookies Sugars Meatandchicken Other Dietary Sources of Fe in Huancavelica, Peru
  • 14.
    0 20 40 60 80 100 120 140 Pearl Millet BeanBean Rice Rice Maiz Maiz Wheat Wheat Potato Sweetpotato Fe Fe Zn Fe Zn Fe Zn Fe Zn Fe Fe ppm Baseline & Target Levels for 7 Crops 8 44 8 8 32 64 8 11 22 22 Non-Biofortified Avg. Baseline BreedingTarget Genetic Variation Discovered 30 Target Increment
  • 15.
    Breeding Focus byCrop and Micronutrient HarvestPlus investment level I. Zn Rice, Zn Wheat II. Fe Pearl Millet, Fe Bean III. Fe Potato, Fe Sorghum, Fe Lentil. Zn Maize – initially HarvestPlus, then AgroSalud Fe & Zn Sweetpotato in SASHA
  • 16.
    Fe (ppm) P (ppm) Rice polished Maize Wheat Bean Cassava Potato Lentil PearlMillet Yams Phytate: Inhibitor of Fe Absorption 5% SweetPotato10%
  • 17.
    Iron Bioavailability inLandrace Potatoes 0 10 20 30 40 50 60 704393 703168 705543 702464 700234 700787 701997 703274 703488 Caco2cellsferritinformation(ng ferritin/mgprotein) Caco-2 Cell Ferritin Formation USDA/SRS & CIP
  • 18.
    0,0 5,0 10,0 15,0 20,0 25,0 30,0 15,5 23,3 31,138,8 46,6 54,4 62,1 69,9 77,7 85,4 93,2 mg Ac Ascorbico/ 100g DW Porcetajedepoblación Base Population k = 5% Progeny of selected individuals mg Vitamin C/ 100g Percent Genetic Gains from Selection Gs = k * δp * H2 Selection Intensity HeritabilityGenetic Variation
  • 19.
  • 20.
    Fe Zn FV N=89 PBF N=64 FV N=89 PBF N=64 Genetic Gainsfor Fe and Zn in OFSP African farmers’ varieties (FV) vs. Pre-breeding families (PBF (ppmindrymatter)
  • 21.
    Cycle 1 Families:Source of superior clones Selected genotypes with high micronutrient concentration Fe(mg/kg) 32.0 31.0 30.0 29.0 28.0 27.0 26.0 25.0 24.0 23.0 22.0 21.0 20.0 19.0 18.0 17.0 16.5 16.0 15.0 14.0 12.5 12.0 11.0 9.0 8.0 7.0 6.0 5.0 4.0 3.0 2.0 1.0 45 40 35 30 25 20 15 10 5 Boxplot Ranges of Fe (mg/kg) in diploid potato families (NCD-II) Base line (17.5 mg/kg
  • 22.
    Biotechnologies –Reduce time andcost to meet breeding goals –Exceed levels feasible by conventional breeding
  • 23.
    Identification of genesaffecting variation in Fe & Zn in Bean by QTL analysis • Overlapping Fe and Zn QTL suggest common transcriptional control of uptake • Identification of allelic variation for FRO to facilitate transfer of high mineral traits among genepools and varieties Blair et al., 2010
  • 24.
    Promoter Genomic WheatFerritin clone 1DX5 Glutenin Nos A B C • Introduce extra copies of the most active wheat allele of the TaFer1 gene into wheat. • Biolistic transformation using glutenine1Dx5 promoter to drive endosperm specific expression. Transgenic WT- Bob white Prussian blue stain Targeting Ferritin to the Wheat Endosperm Exon Intron (Aarhus University/Denmark)
  • 25.
    Research Agreements &Contracts with 7 Private Companies - # will increase • GxE Performance Testing • Joint Development of Fe/Zn-dense Hybrids (private NARS) & OPVs (public NARS) by Consortium PartnersPartners in Deployment Variation for Fe in Inbred lines & Hybrids Product Delivery: Case of Pearl Millet
  • 26.
    Breeding cycles Iron(ppm) 2005 20072009 2011 50 65 80 100 Lines in release process Families in pipeline 2010 Baseline Target Incremental gains toward breeding goal for Fe in Bean
  • 27.
    Wolfgang H PFEIFFER ProductDevelopment & Release Schedule
  • 28.
    What Do WeHave in Hand to Succeed in Biofortification ?  Micronutrient-enrichment traits are available within the genomes of staple food crops.  Target levels have been defined.  Breeding schemes established.  First-ever genetic gains for mineral traits realized  Mainstreamed into adapted populations.  Product pipelines defined.  Partners engaged  Early-stage efficacy trials: looking good!