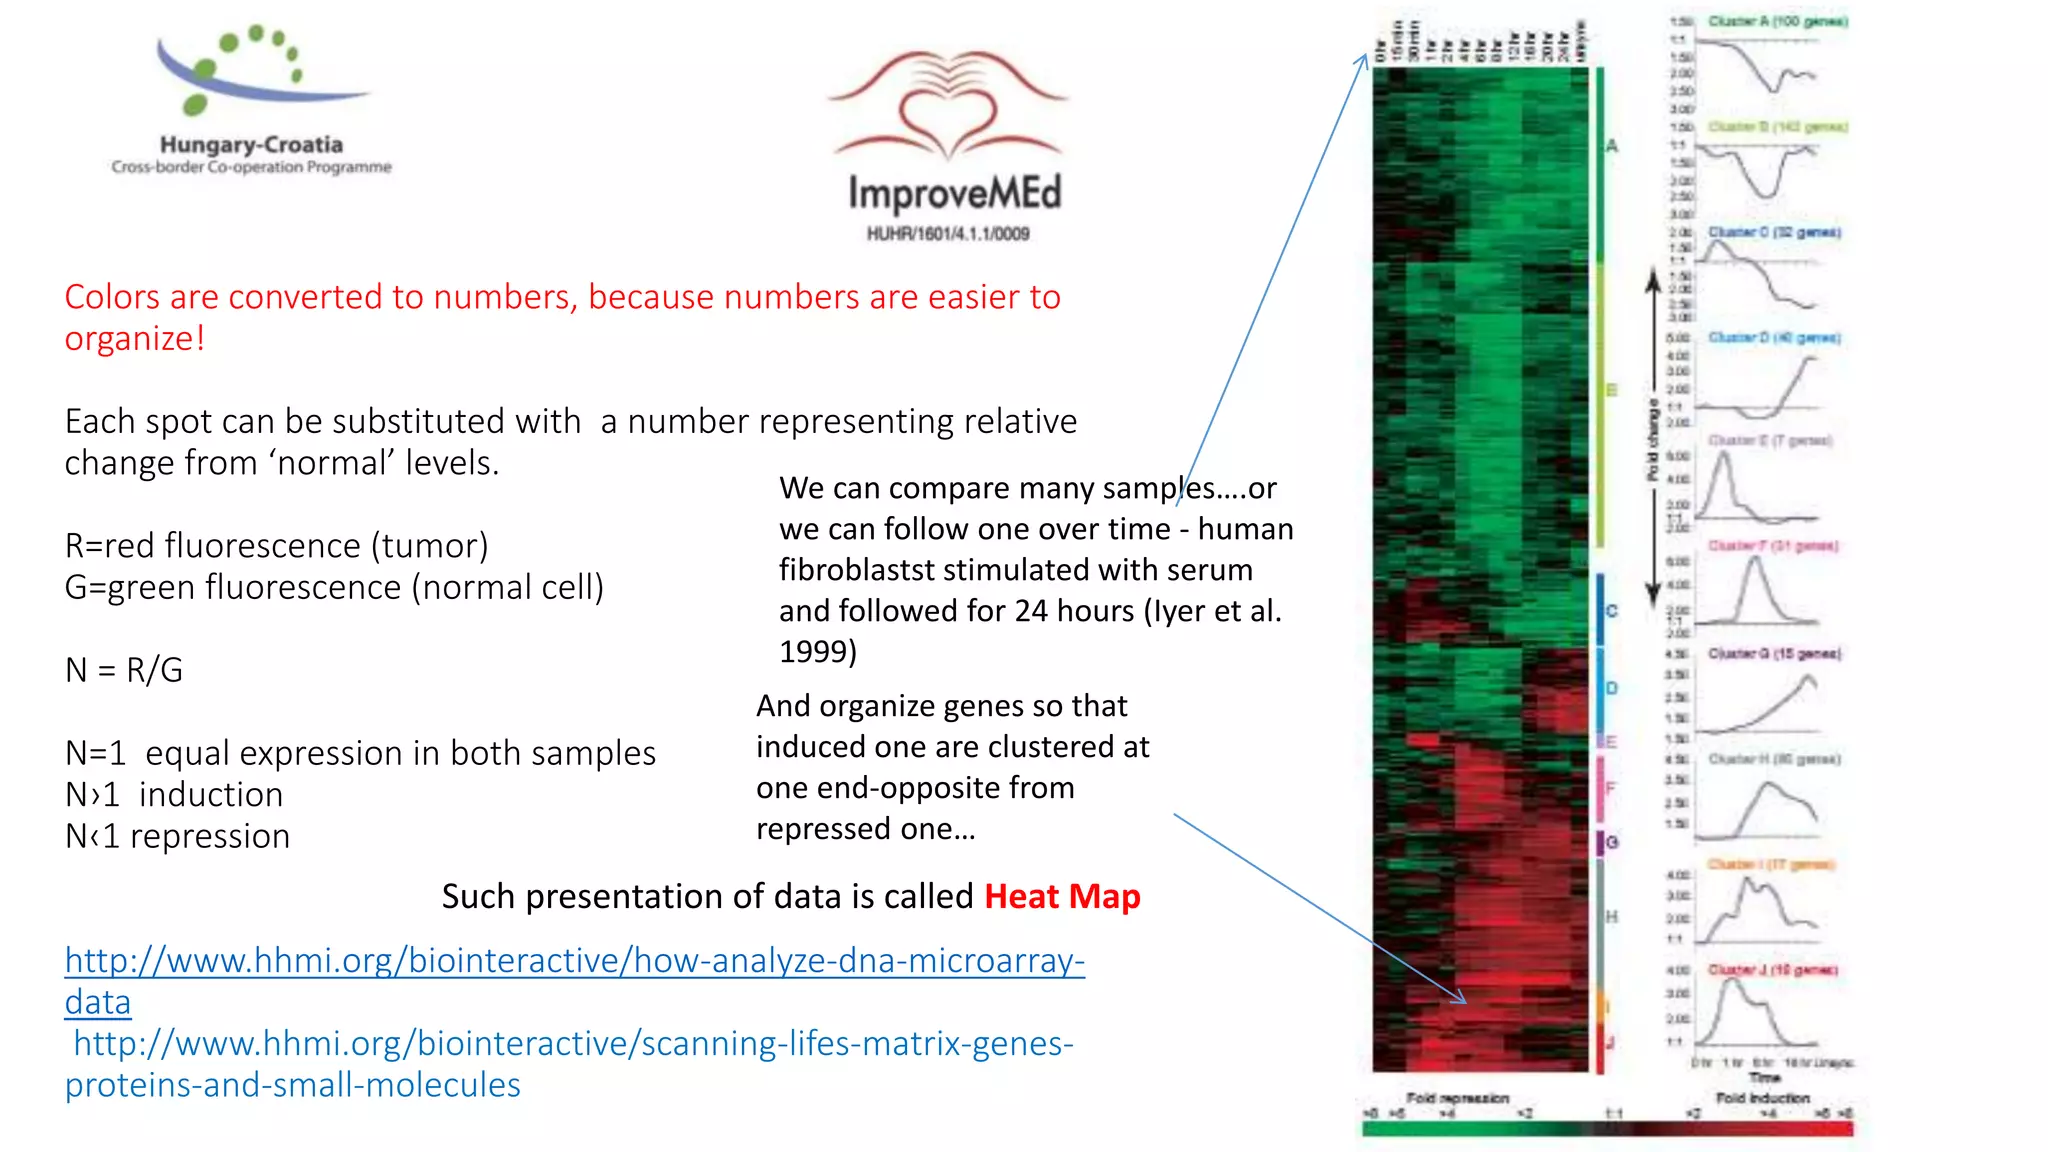
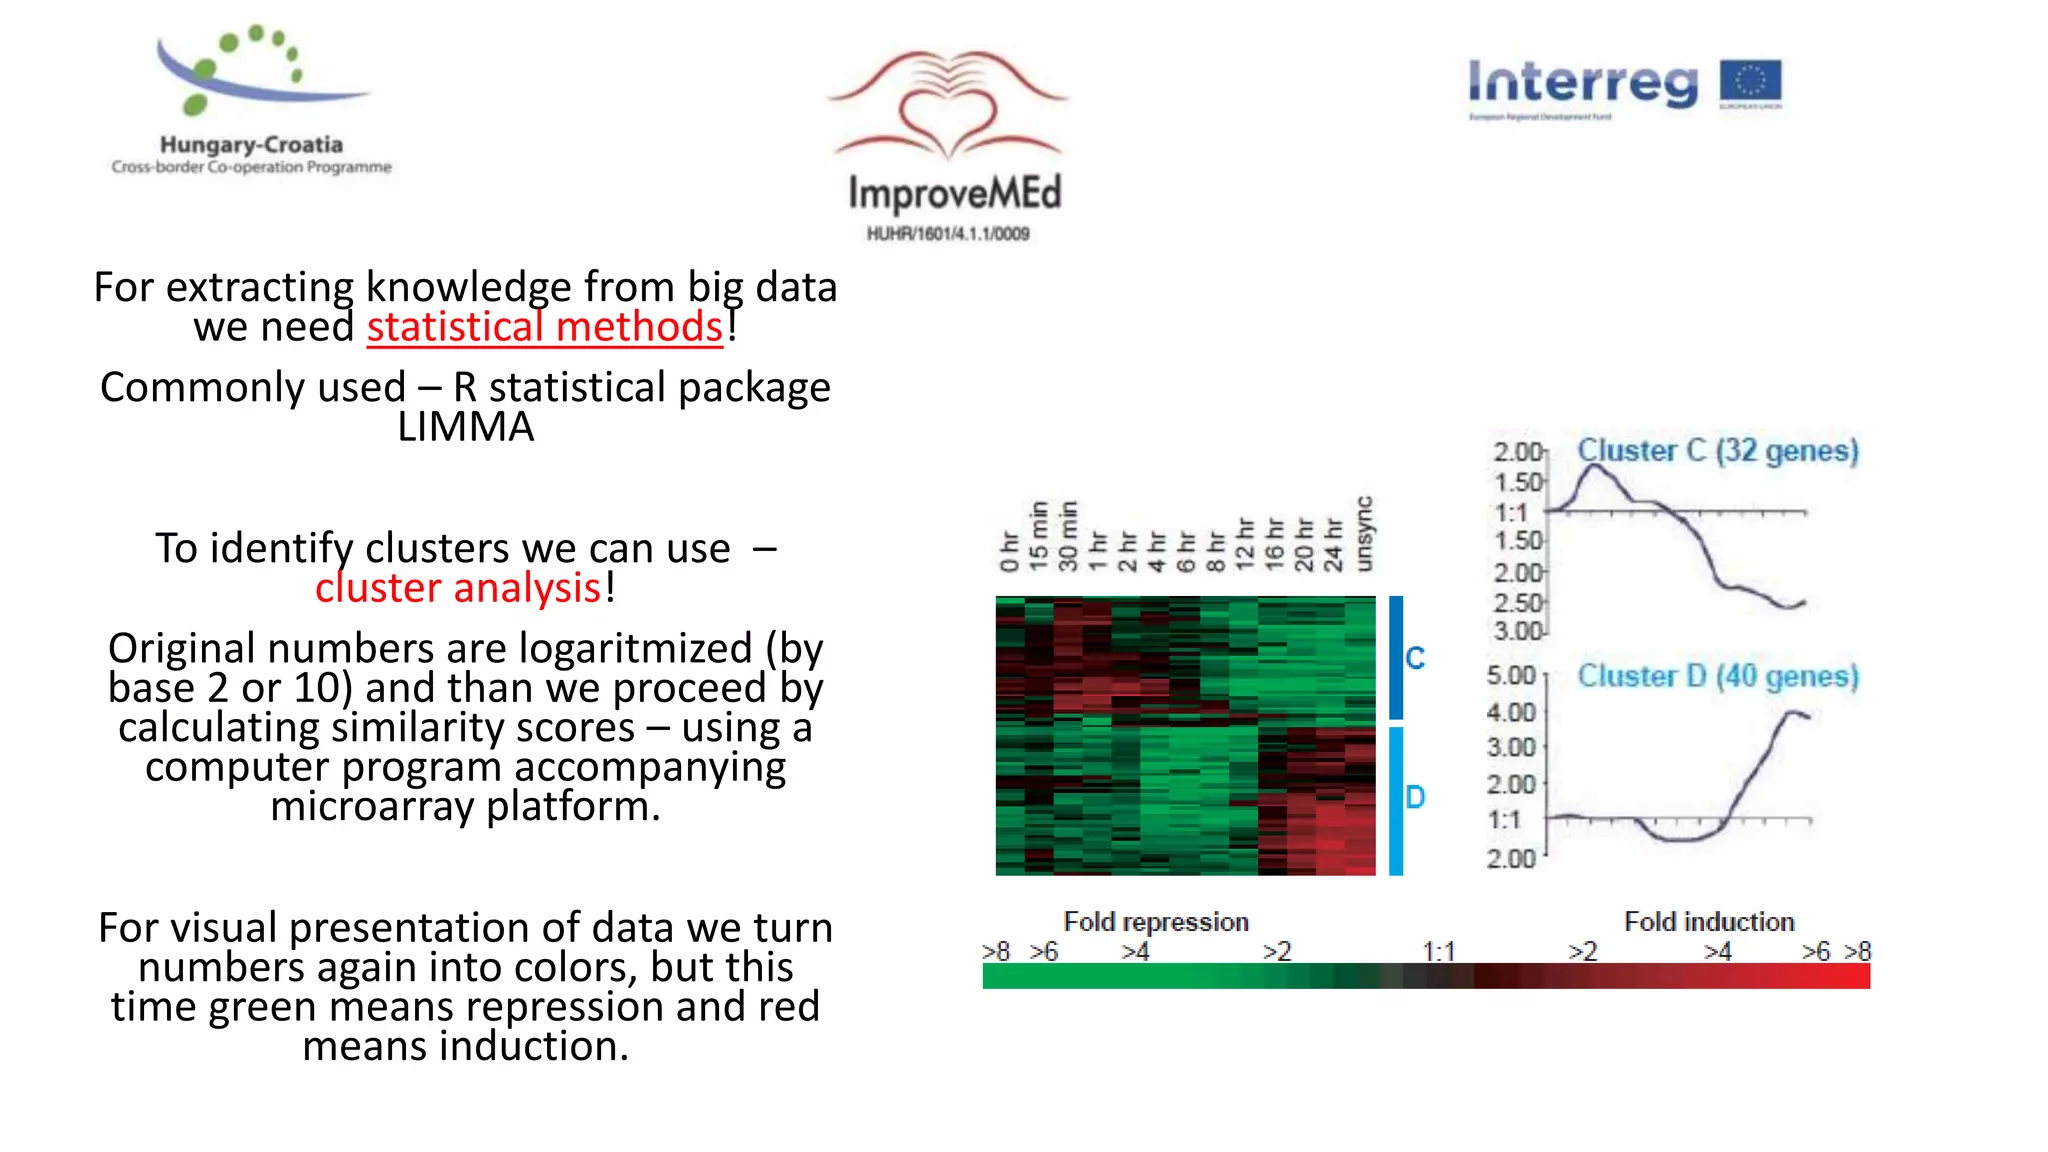
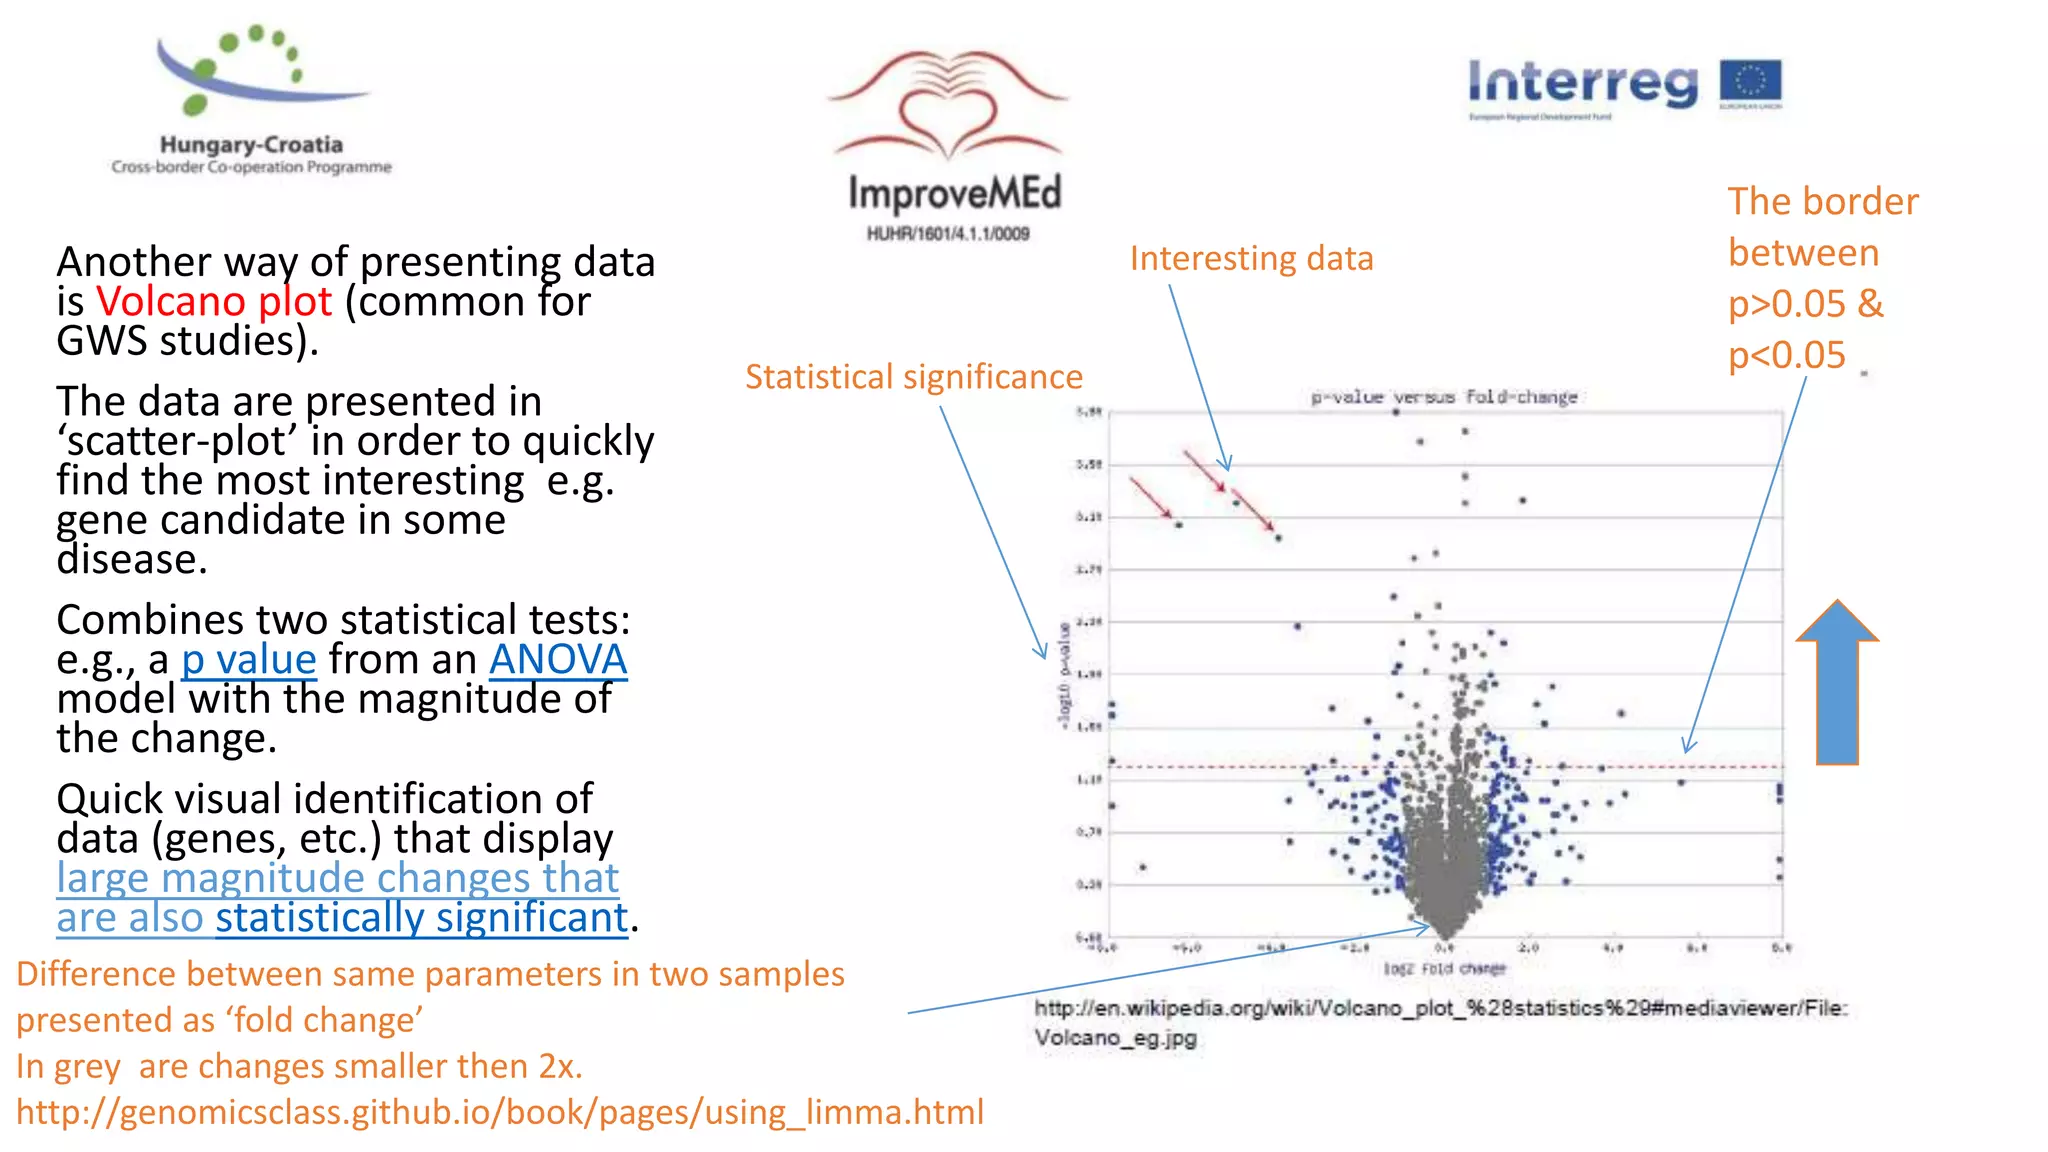
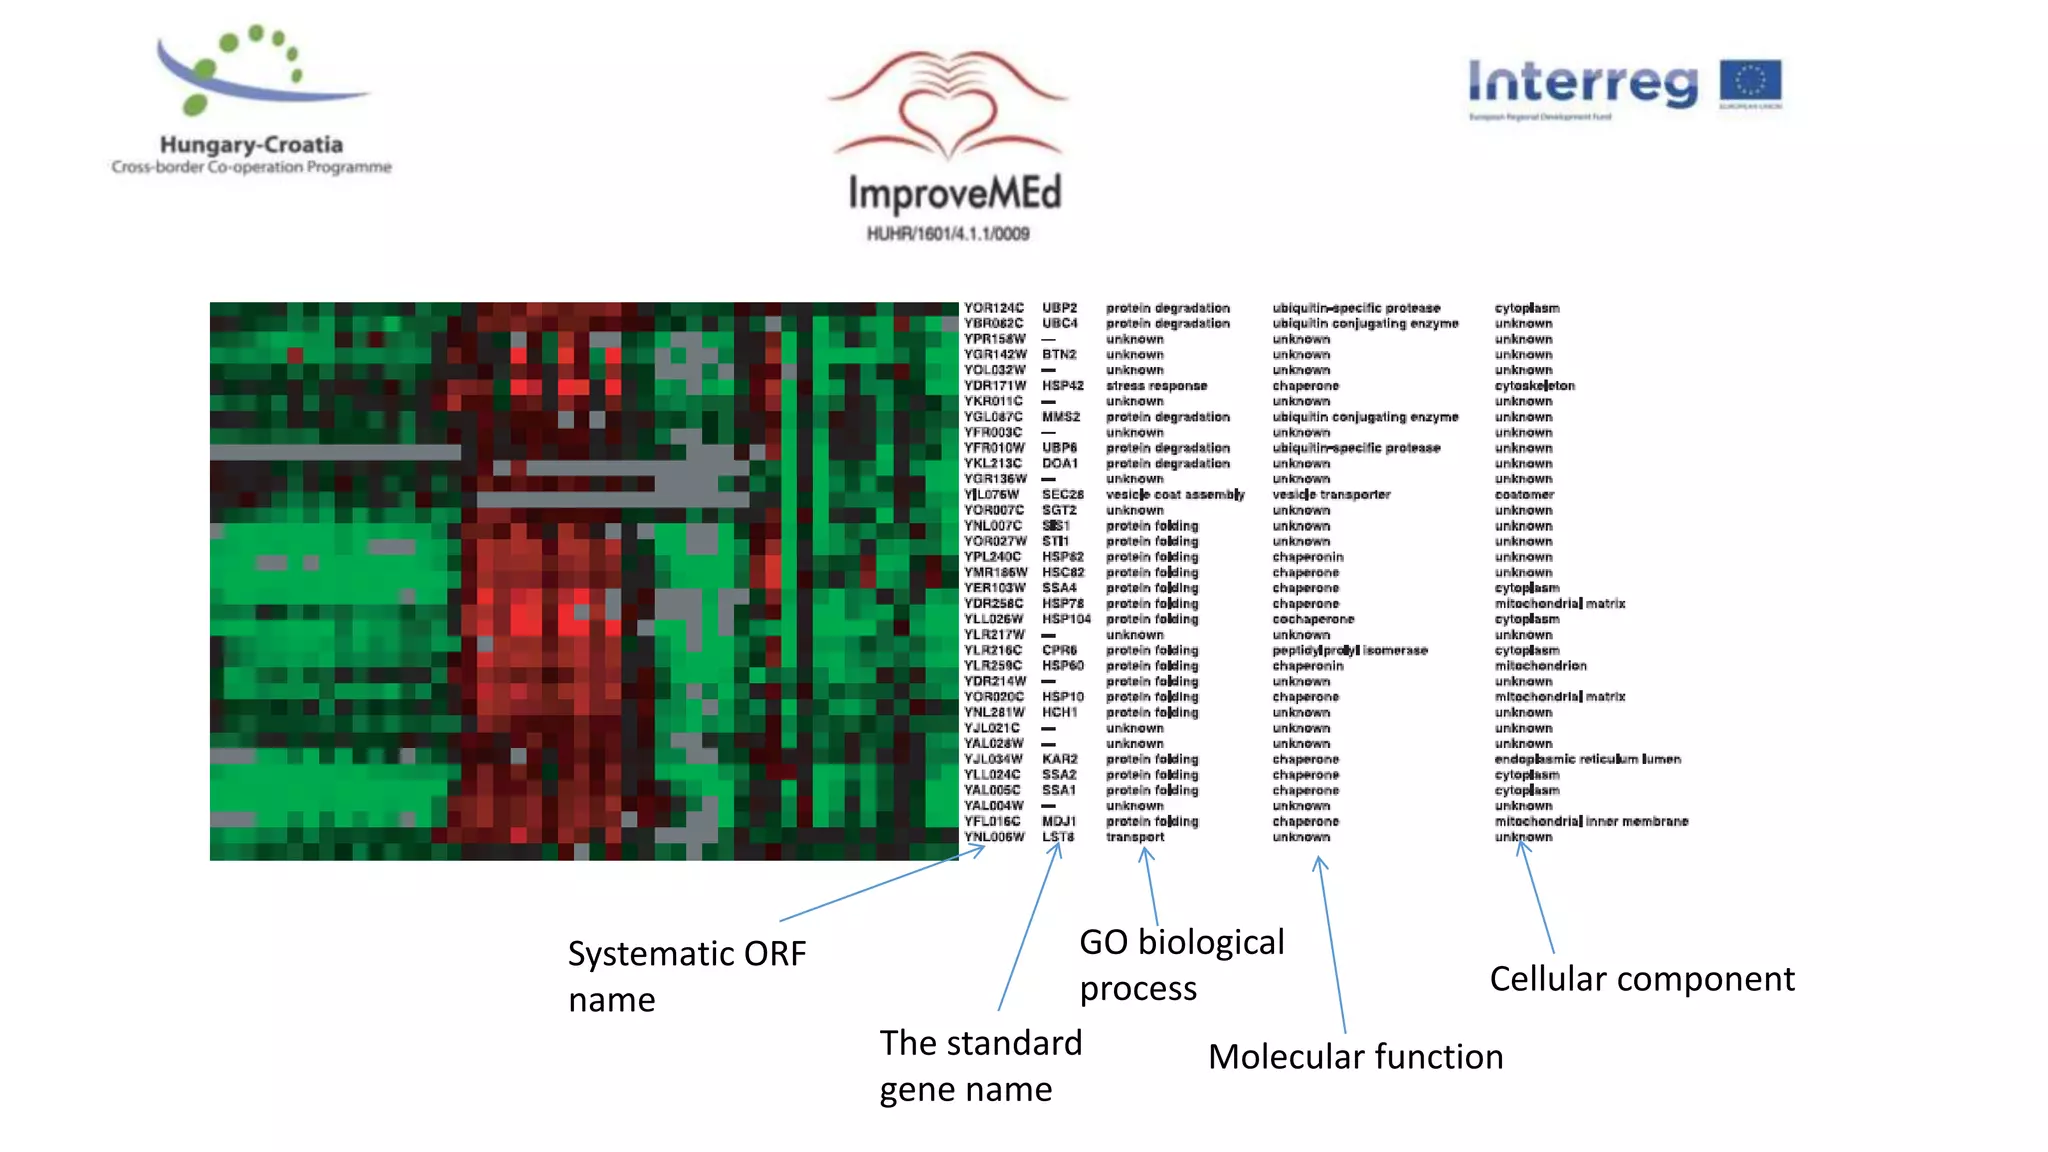
1. Statistical analysis of big data sets from microarrays and RNA-seq is used to identify differentially expressed genes. Heat maps and volcano plots are commonly used to visualize the data.
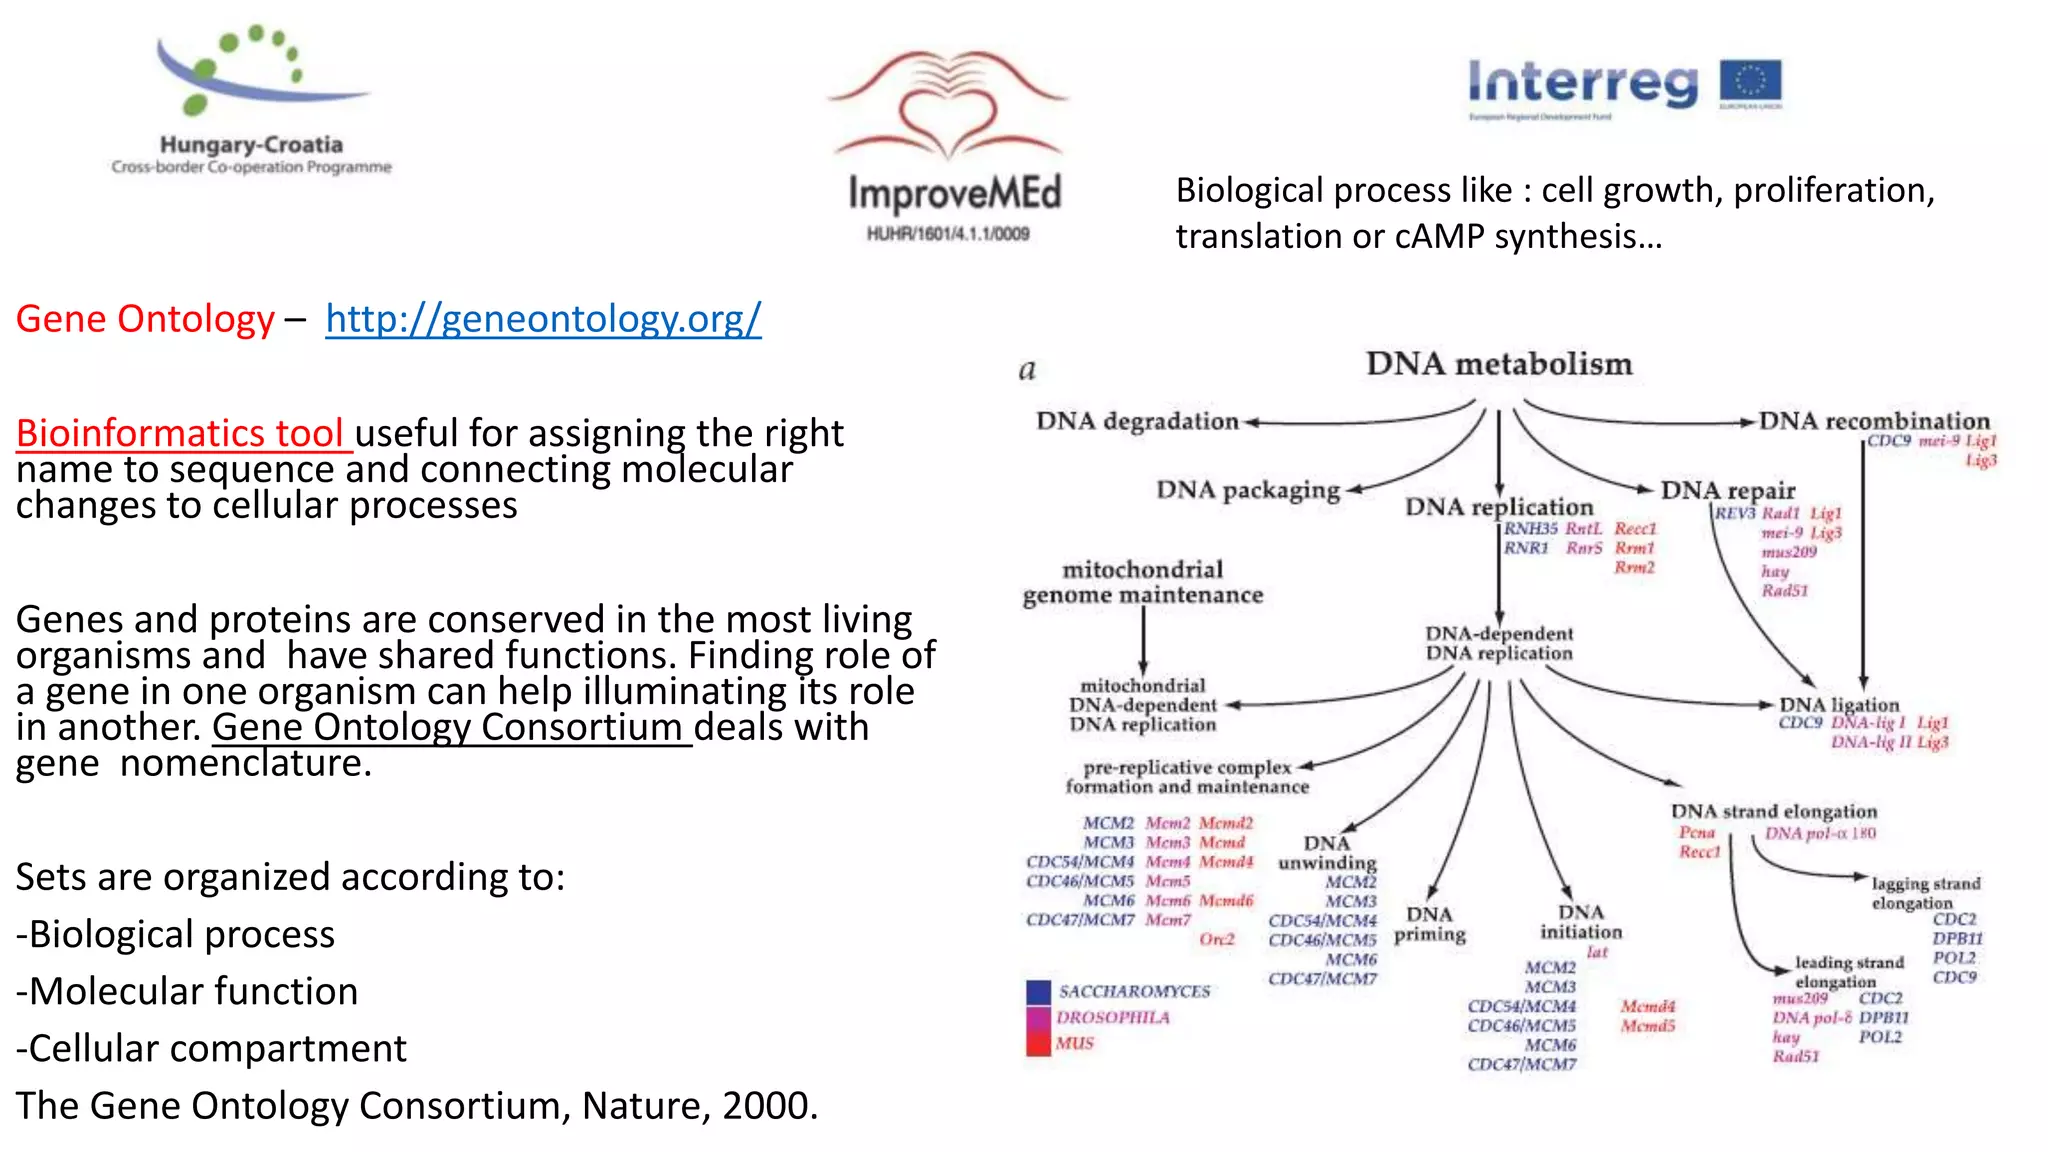
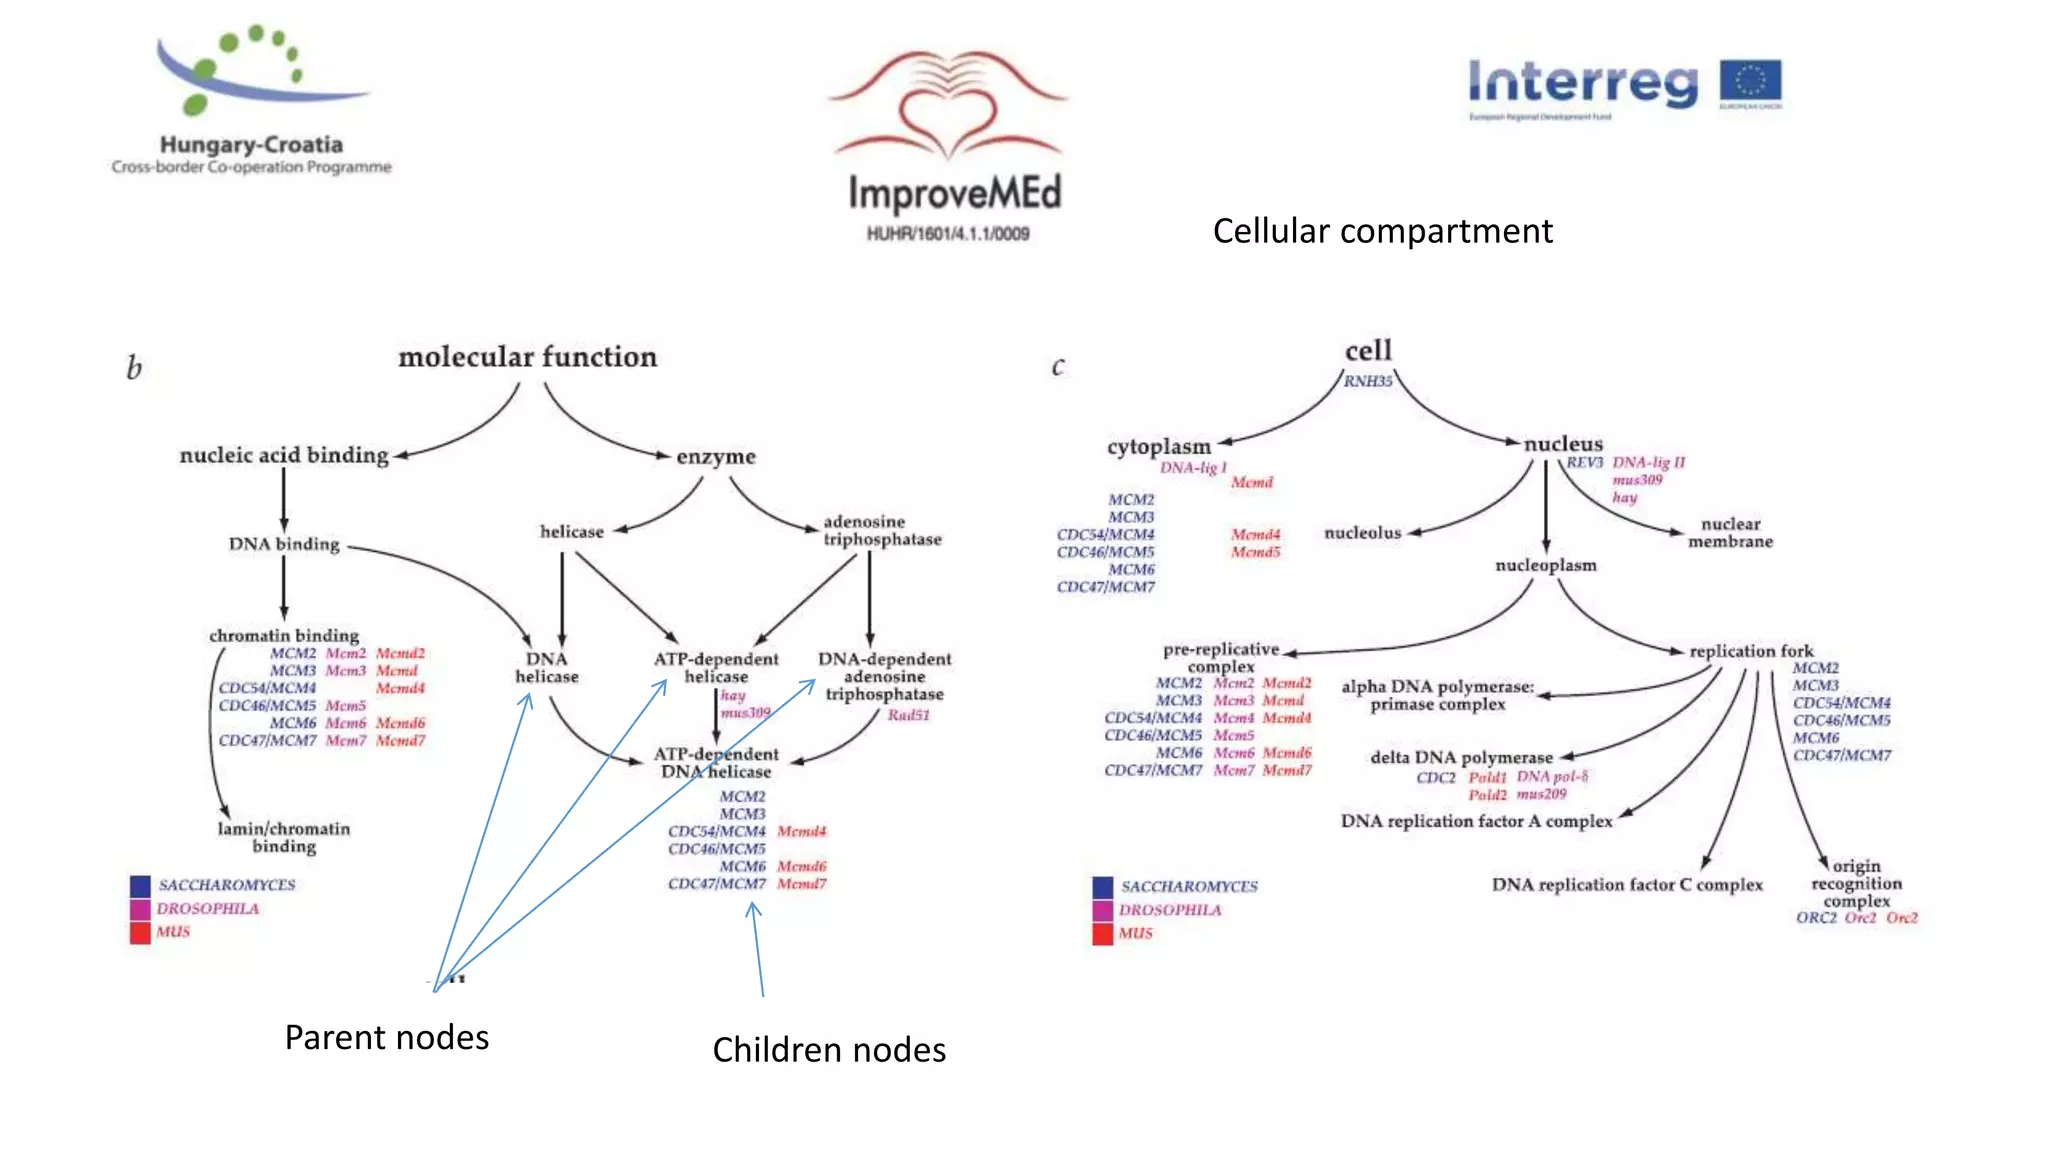
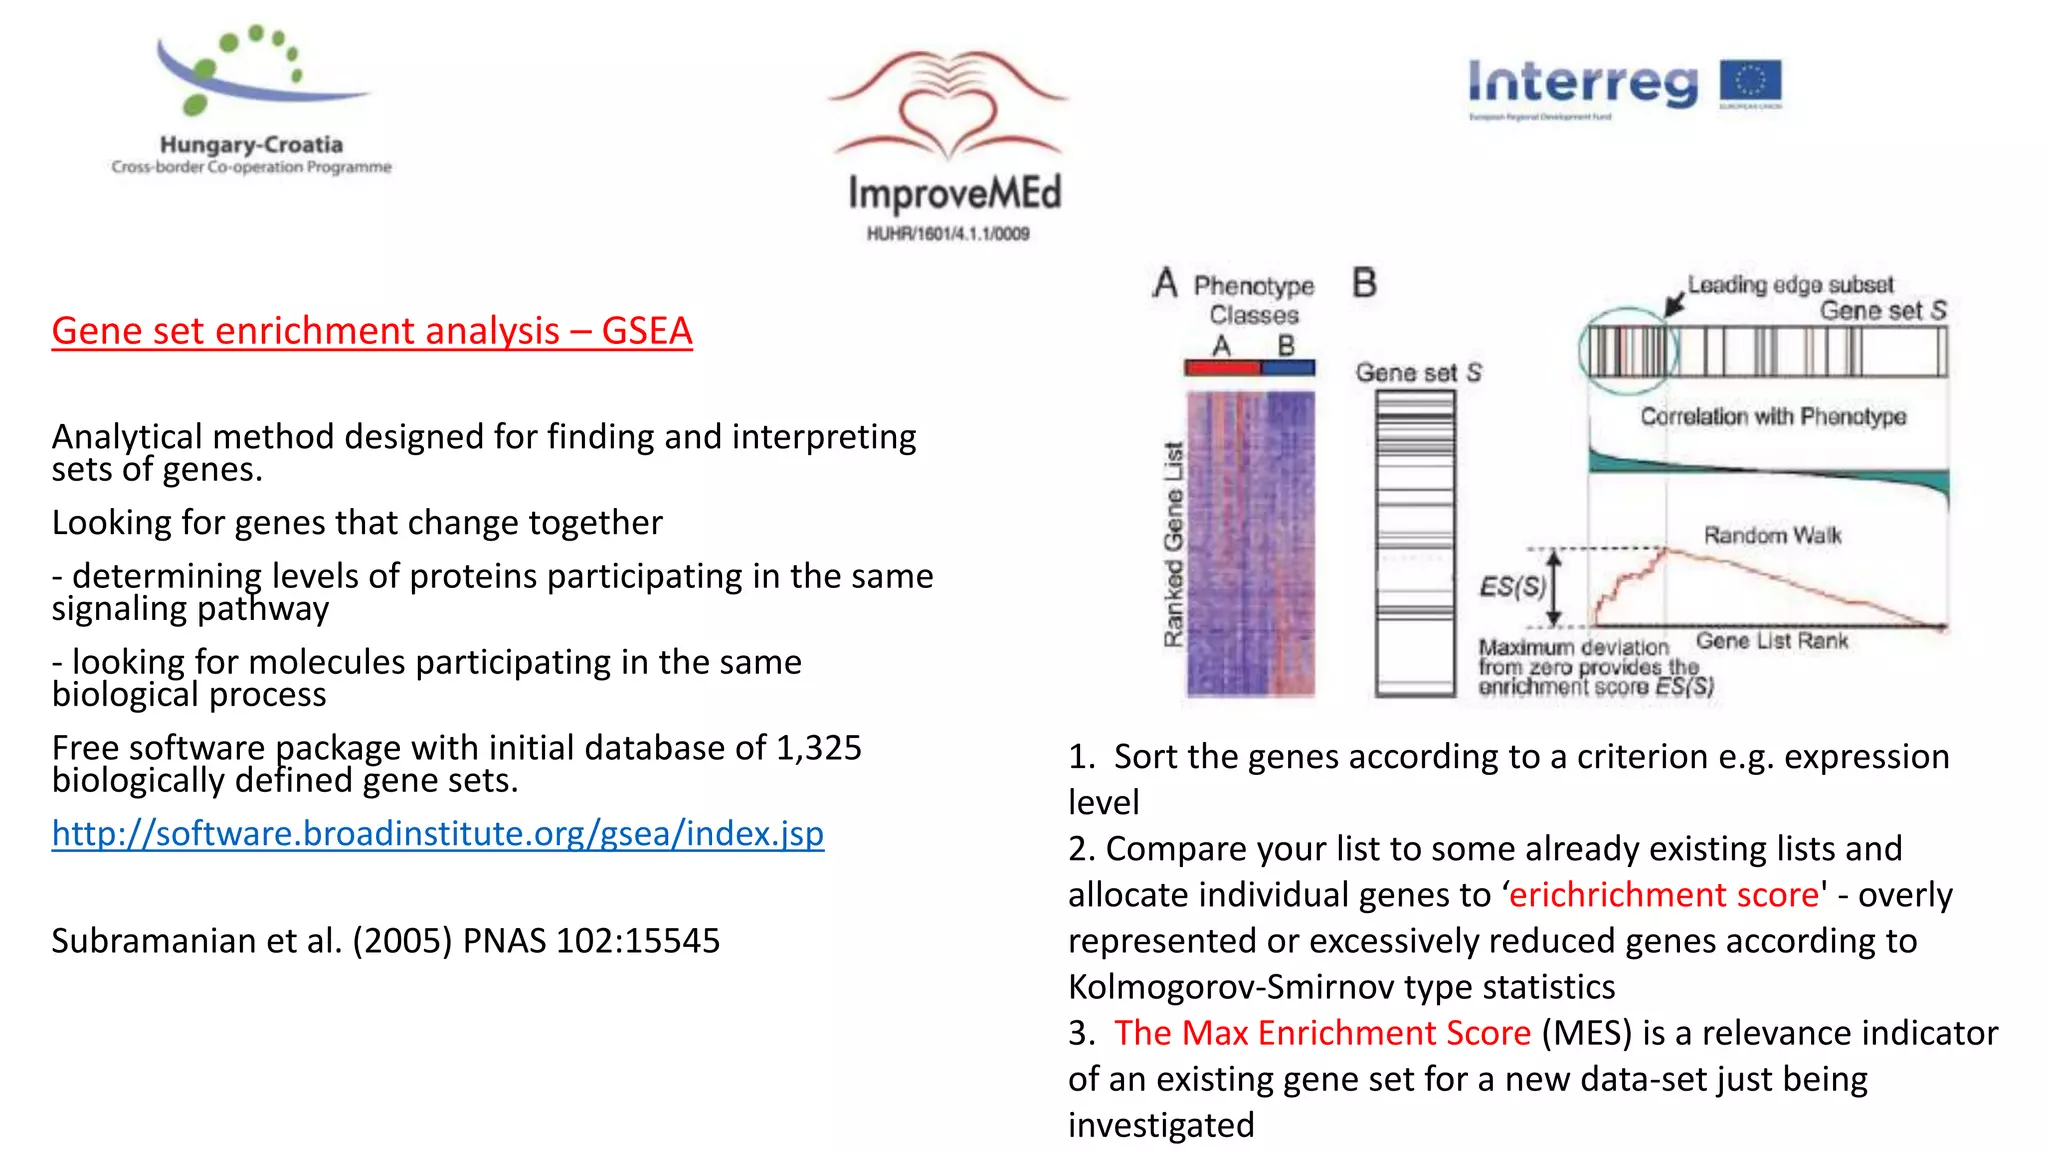
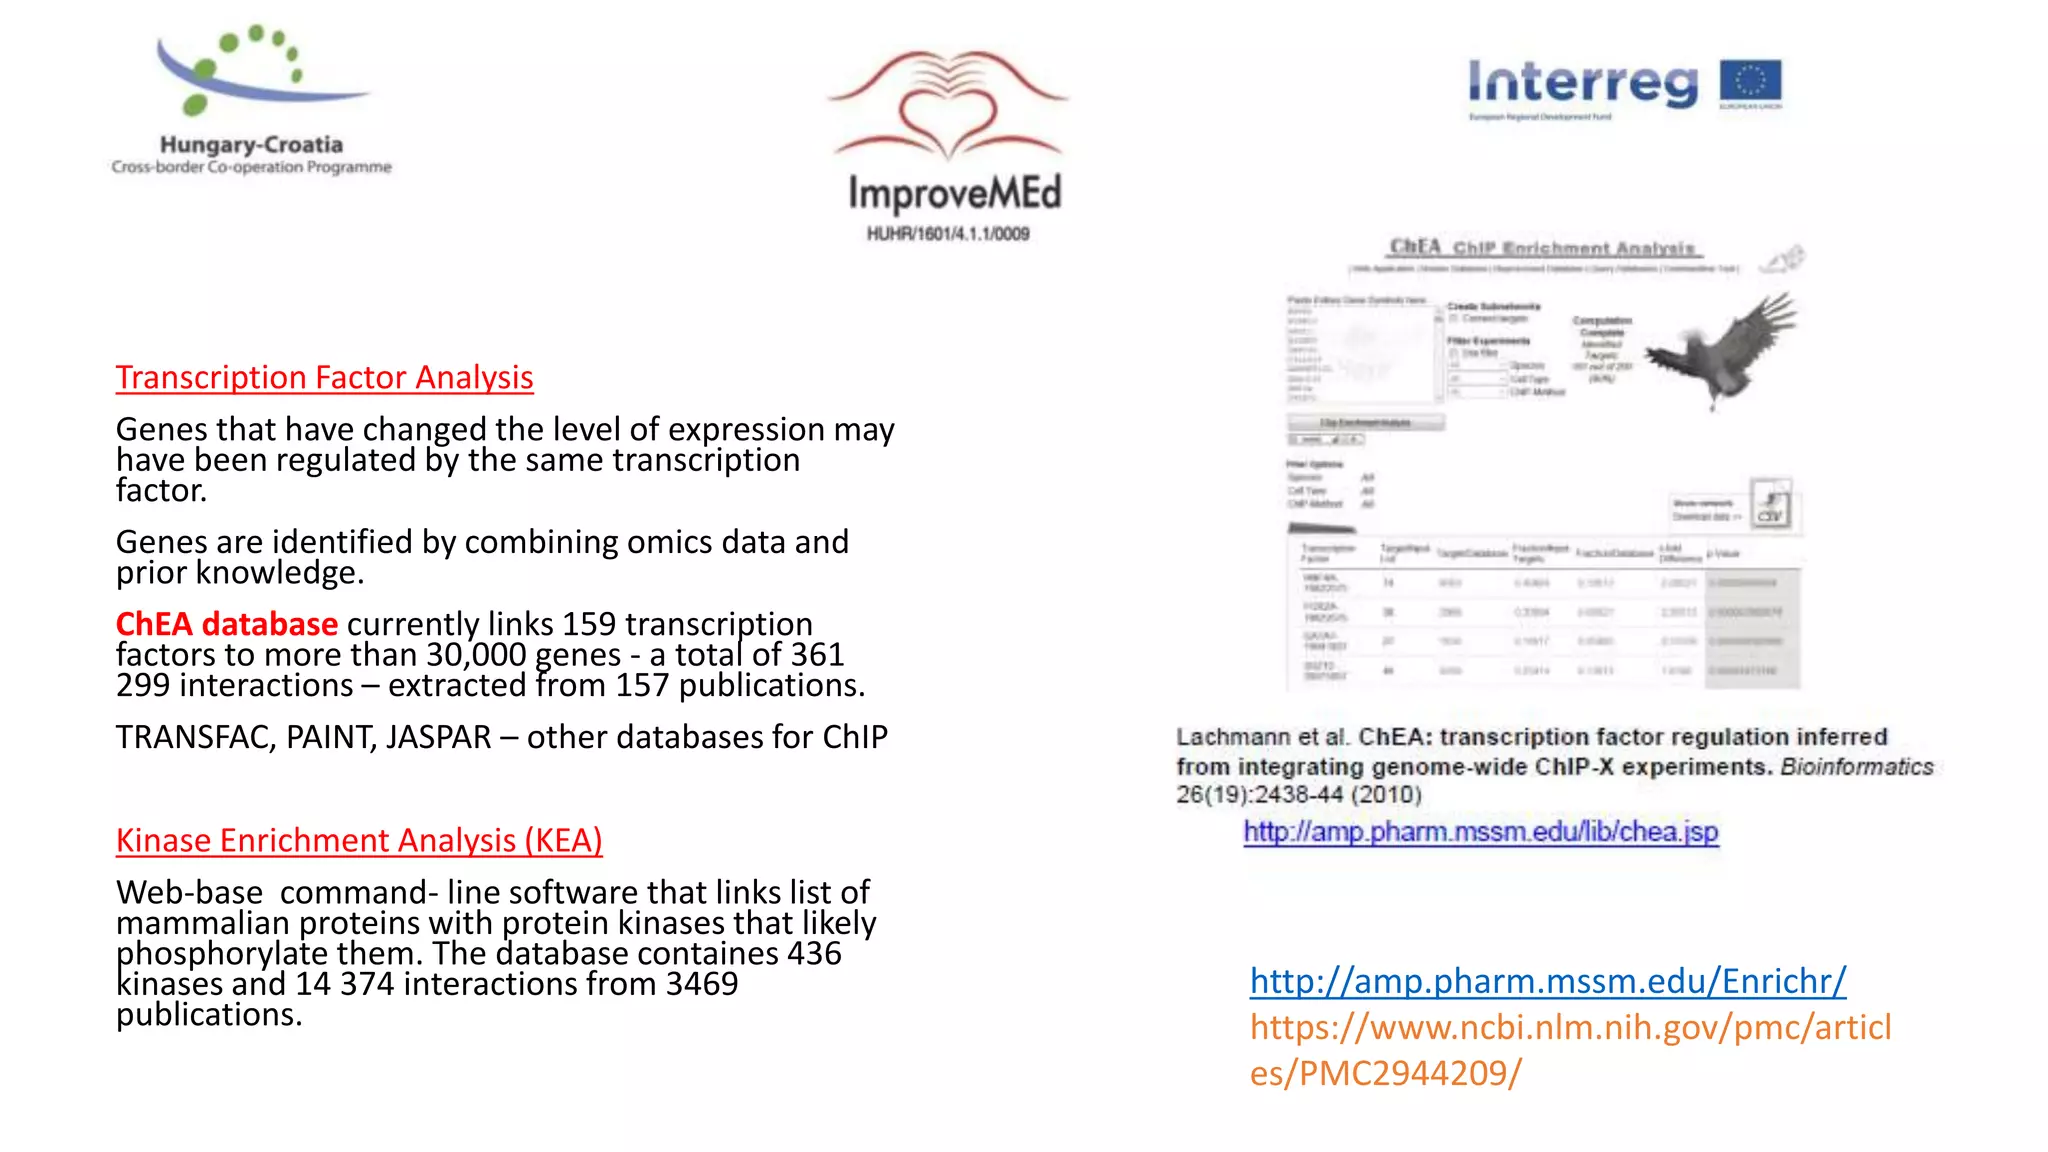
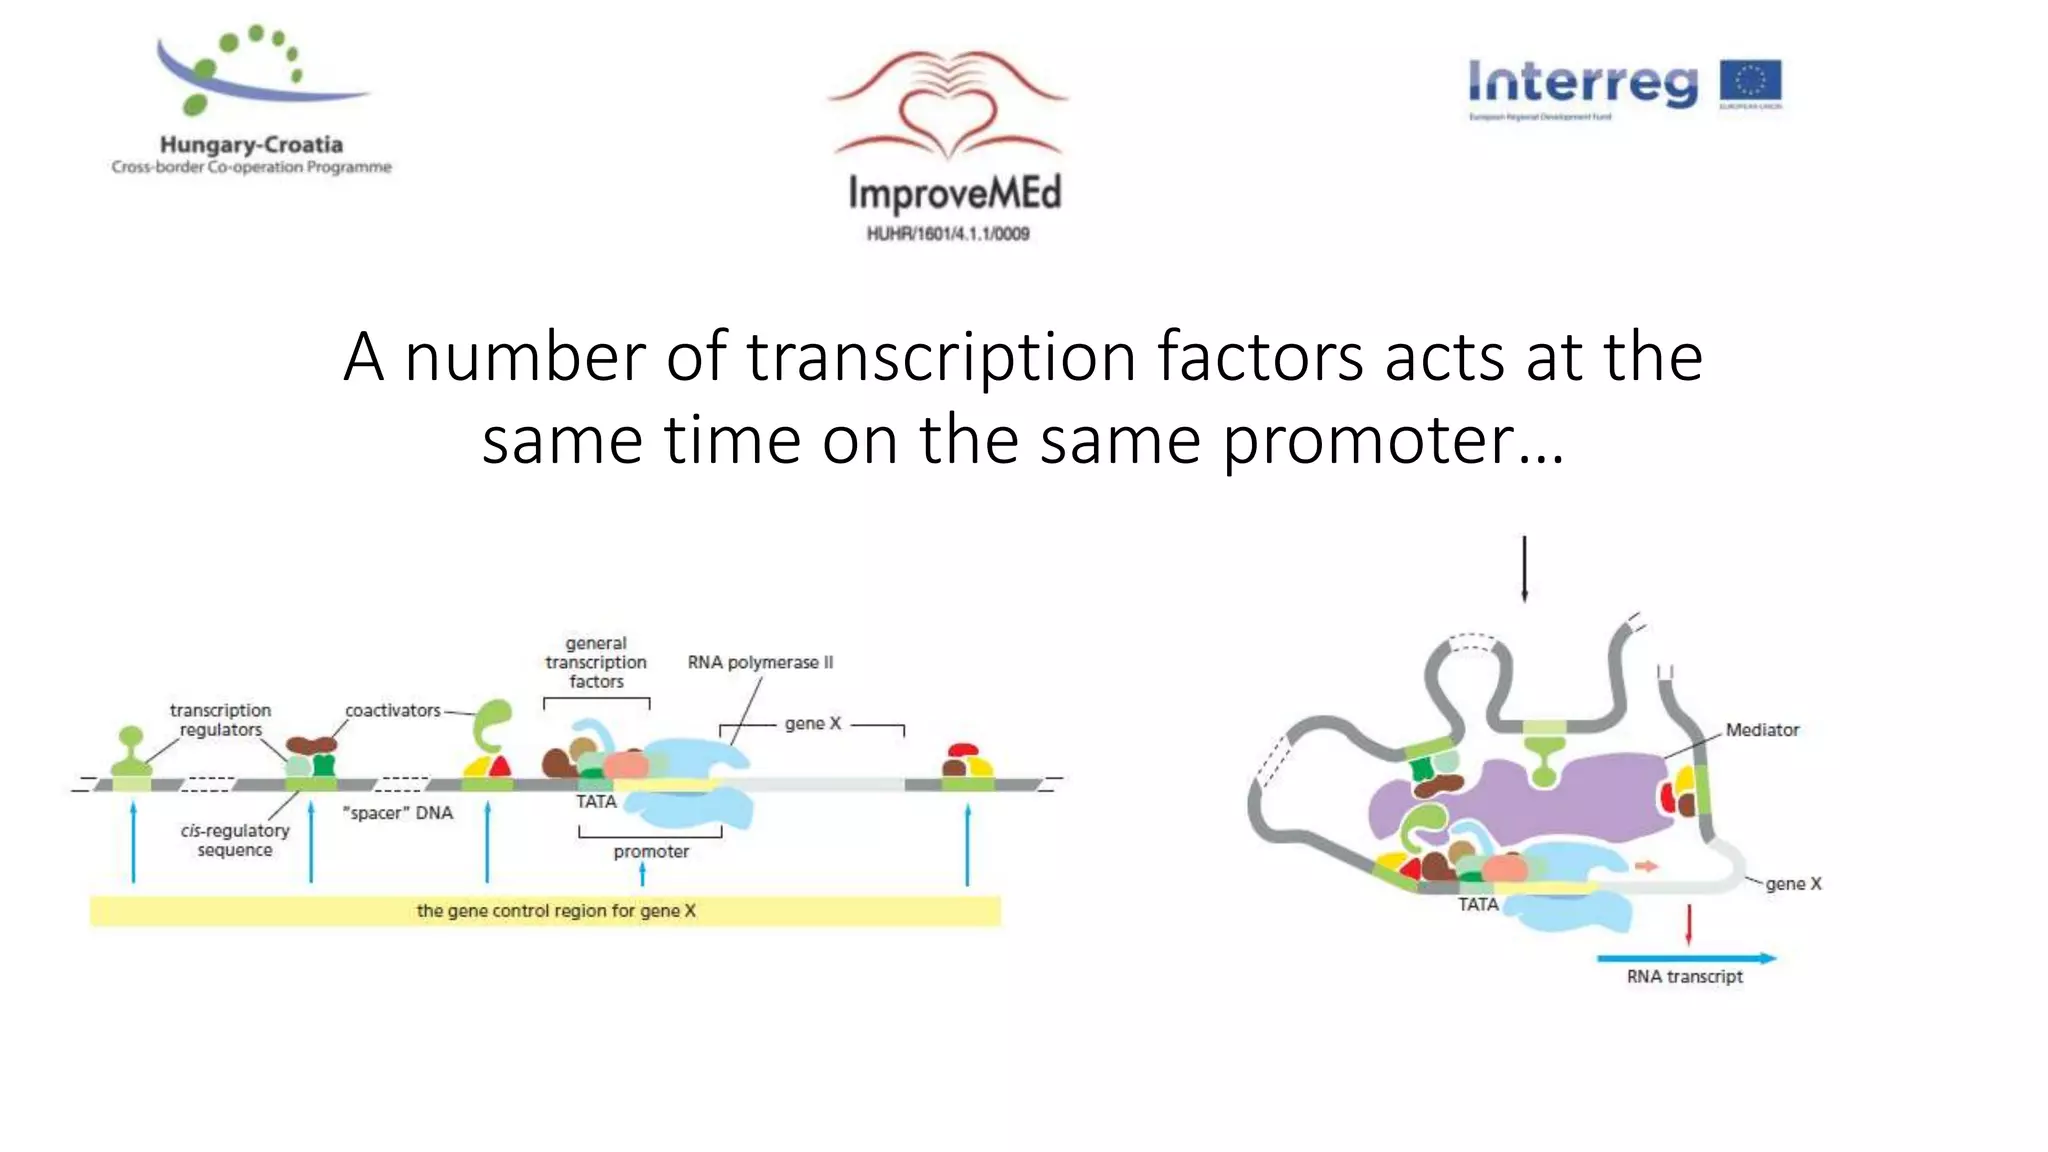
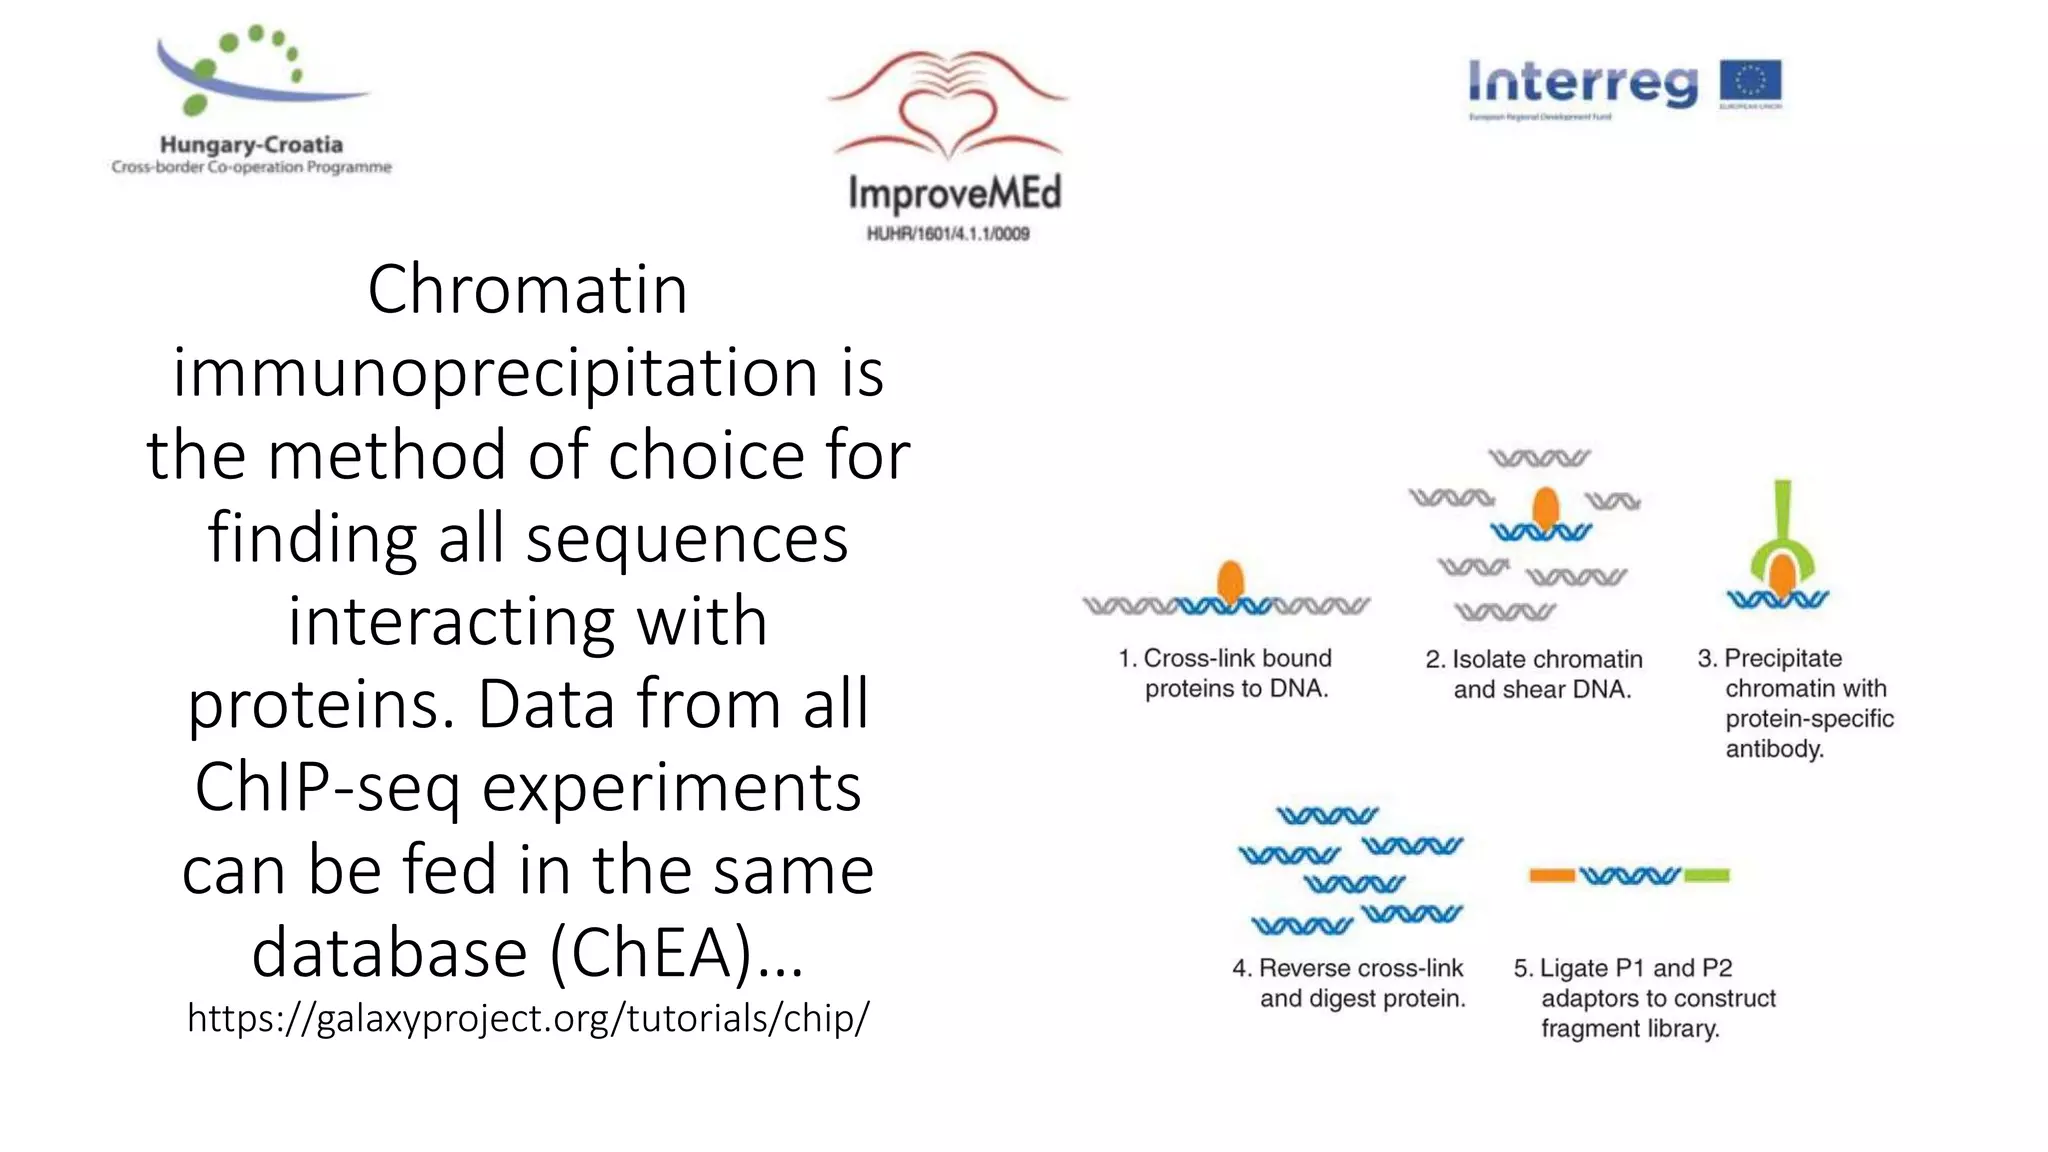
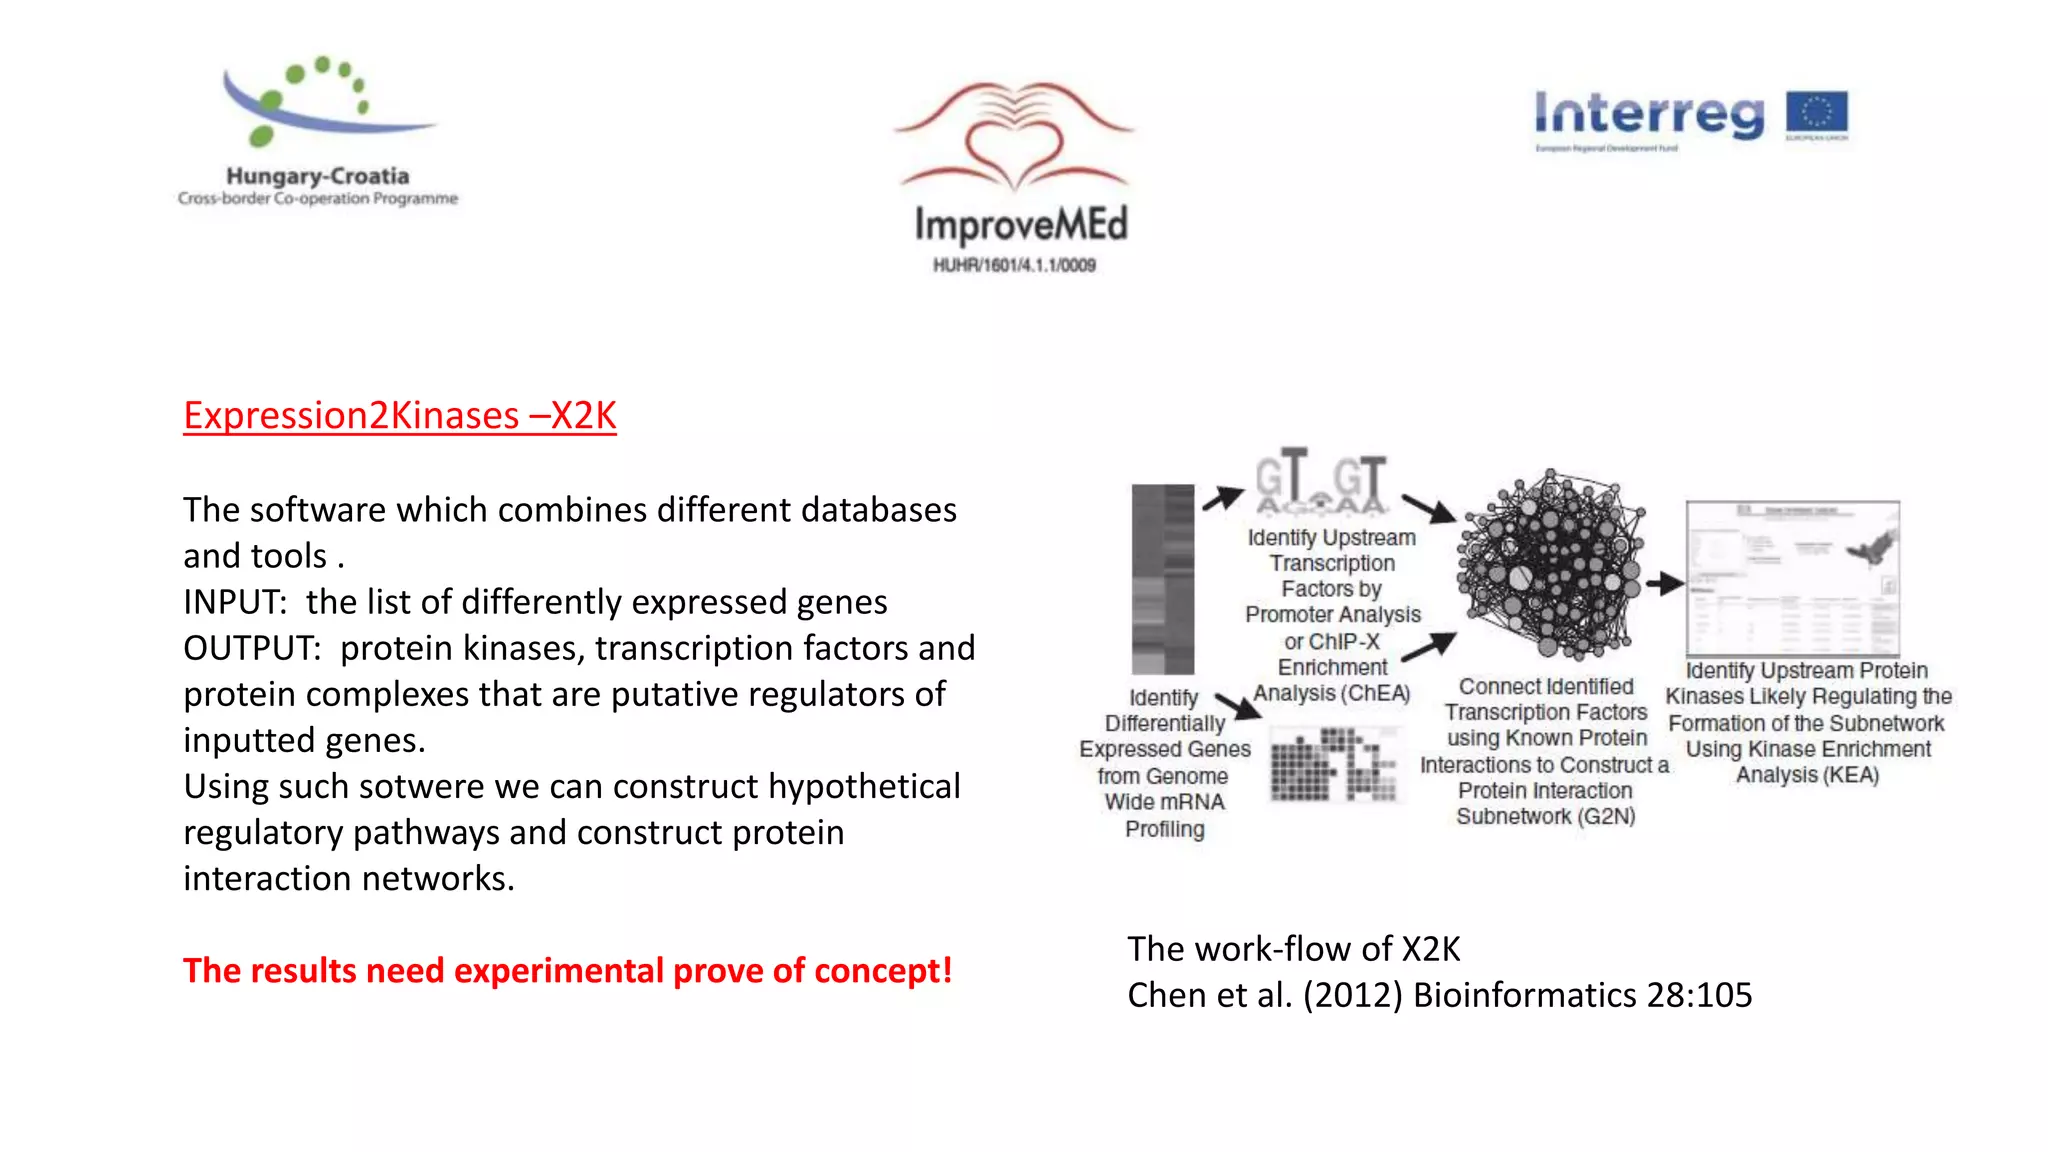
2. Gene ontology, gene set enrichment analysis, and transcription factor analysis are used to analyze lists of genes and identify biological processes, pathways, and regulatory relationships.
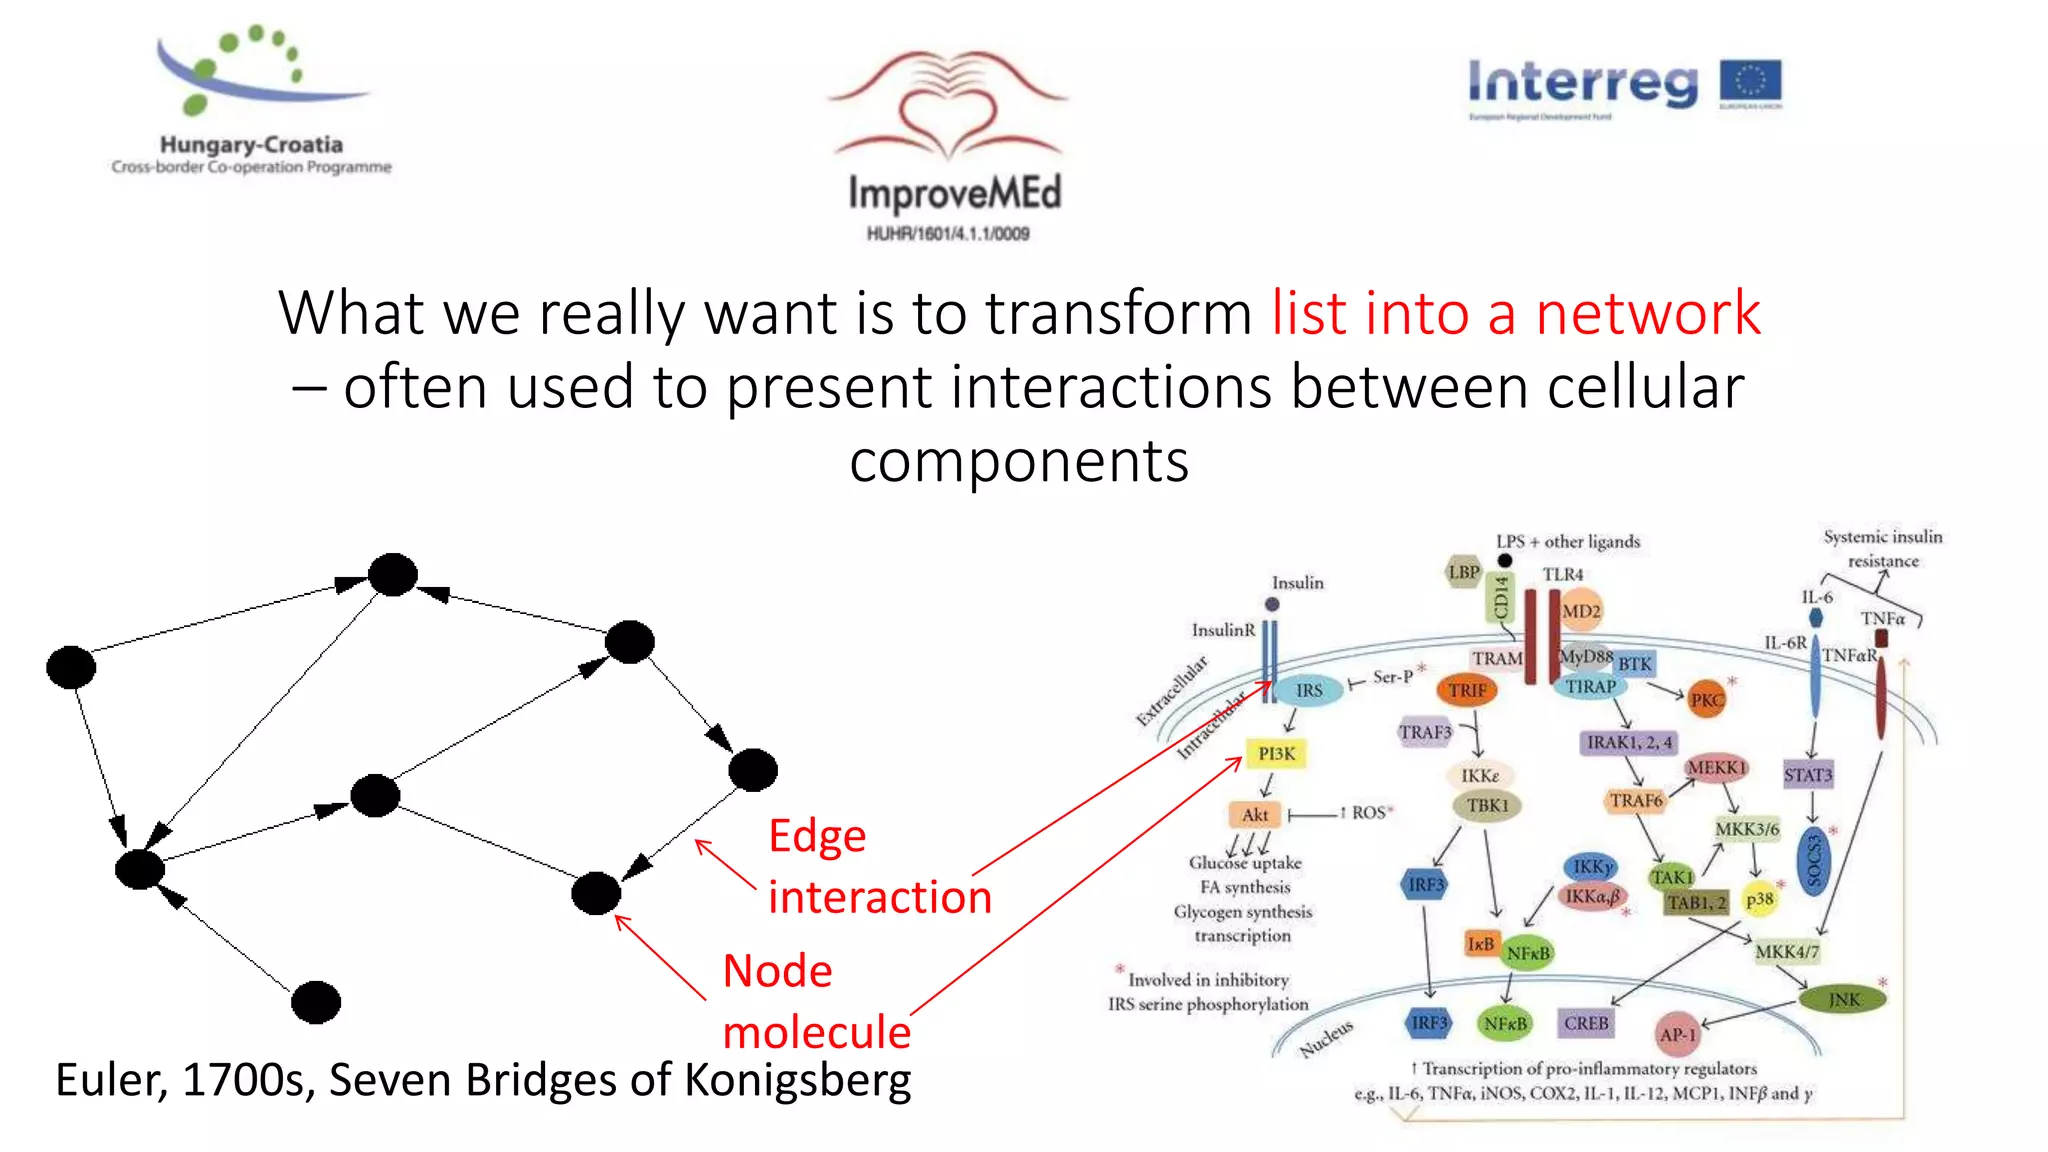
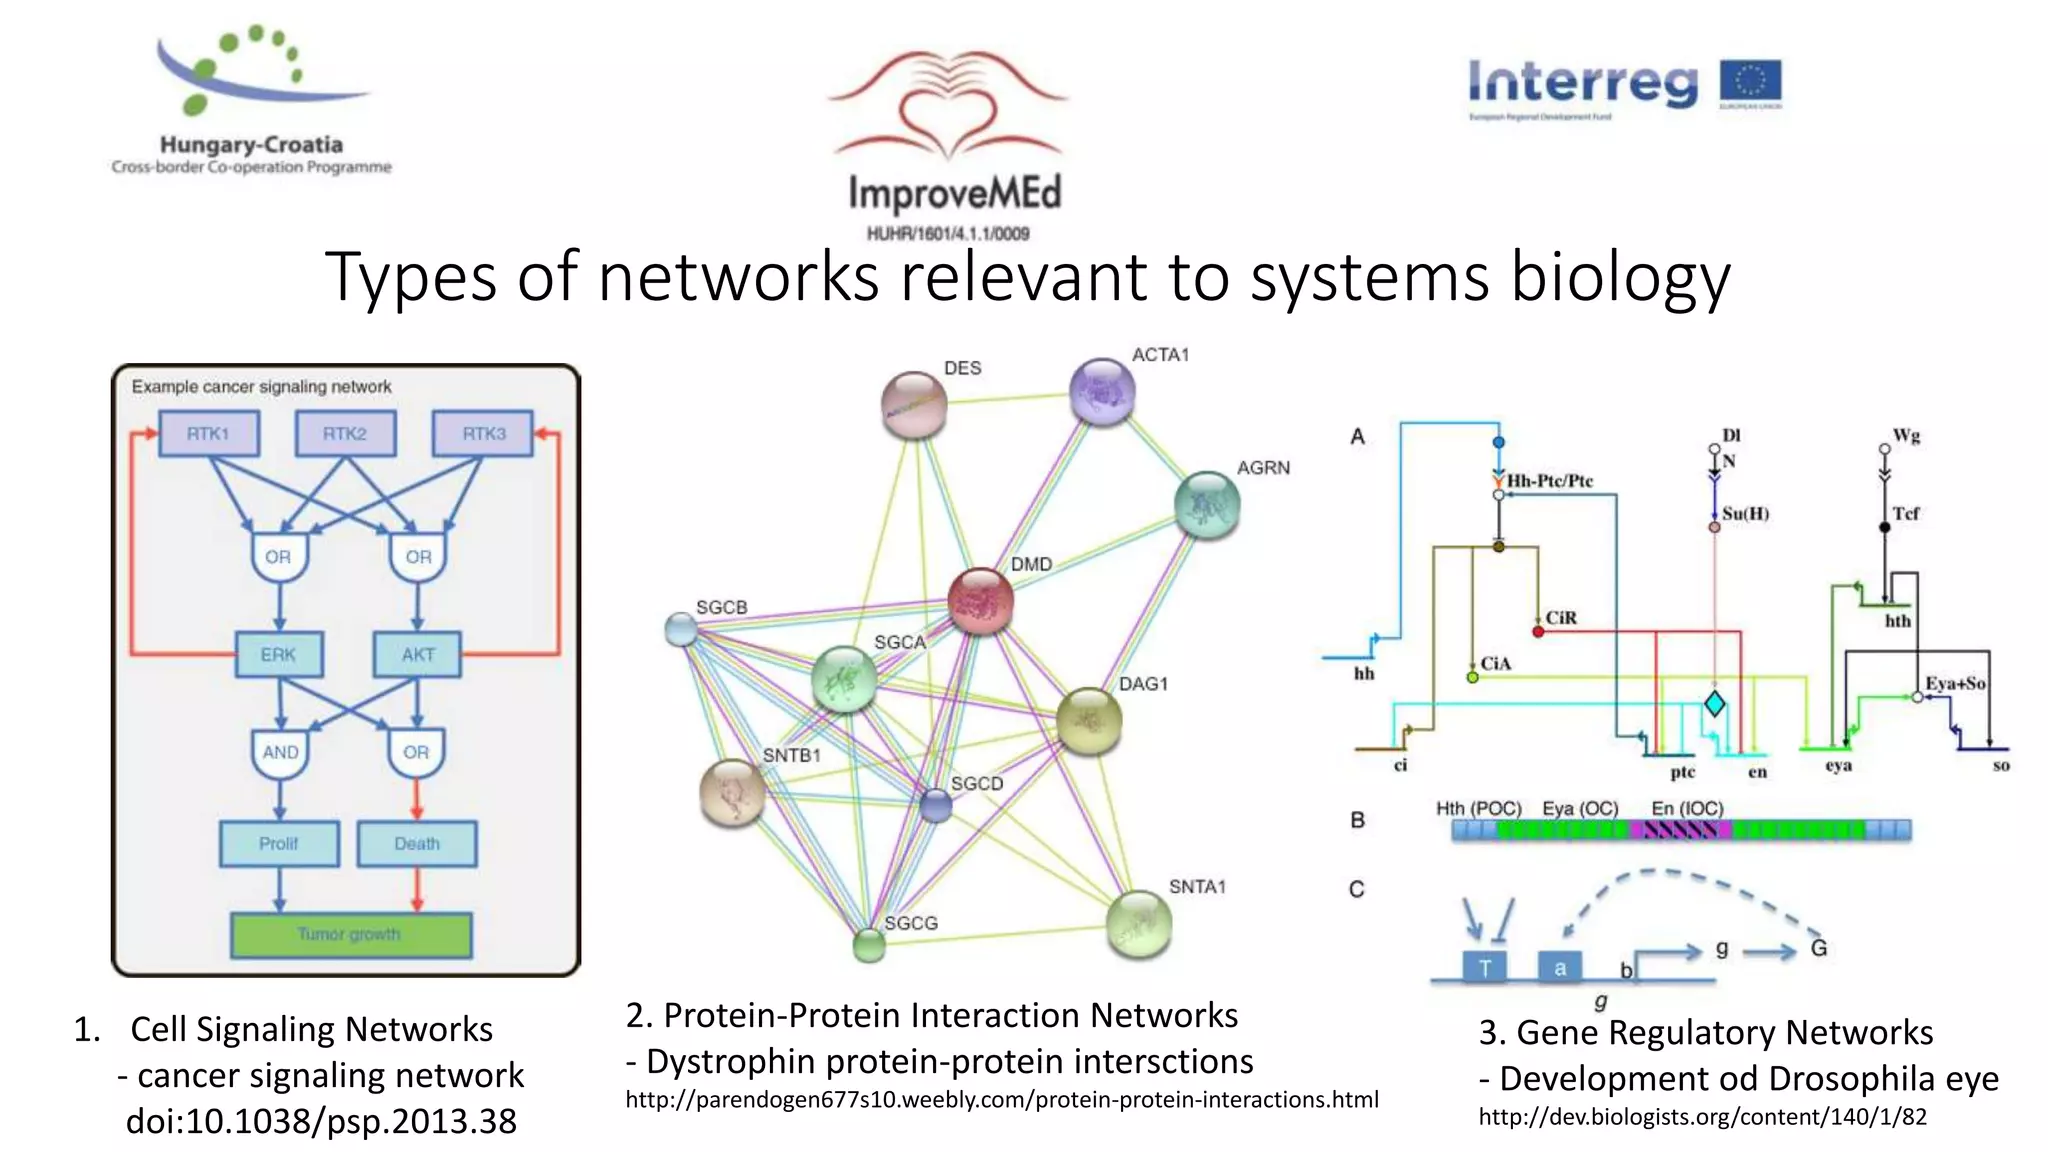
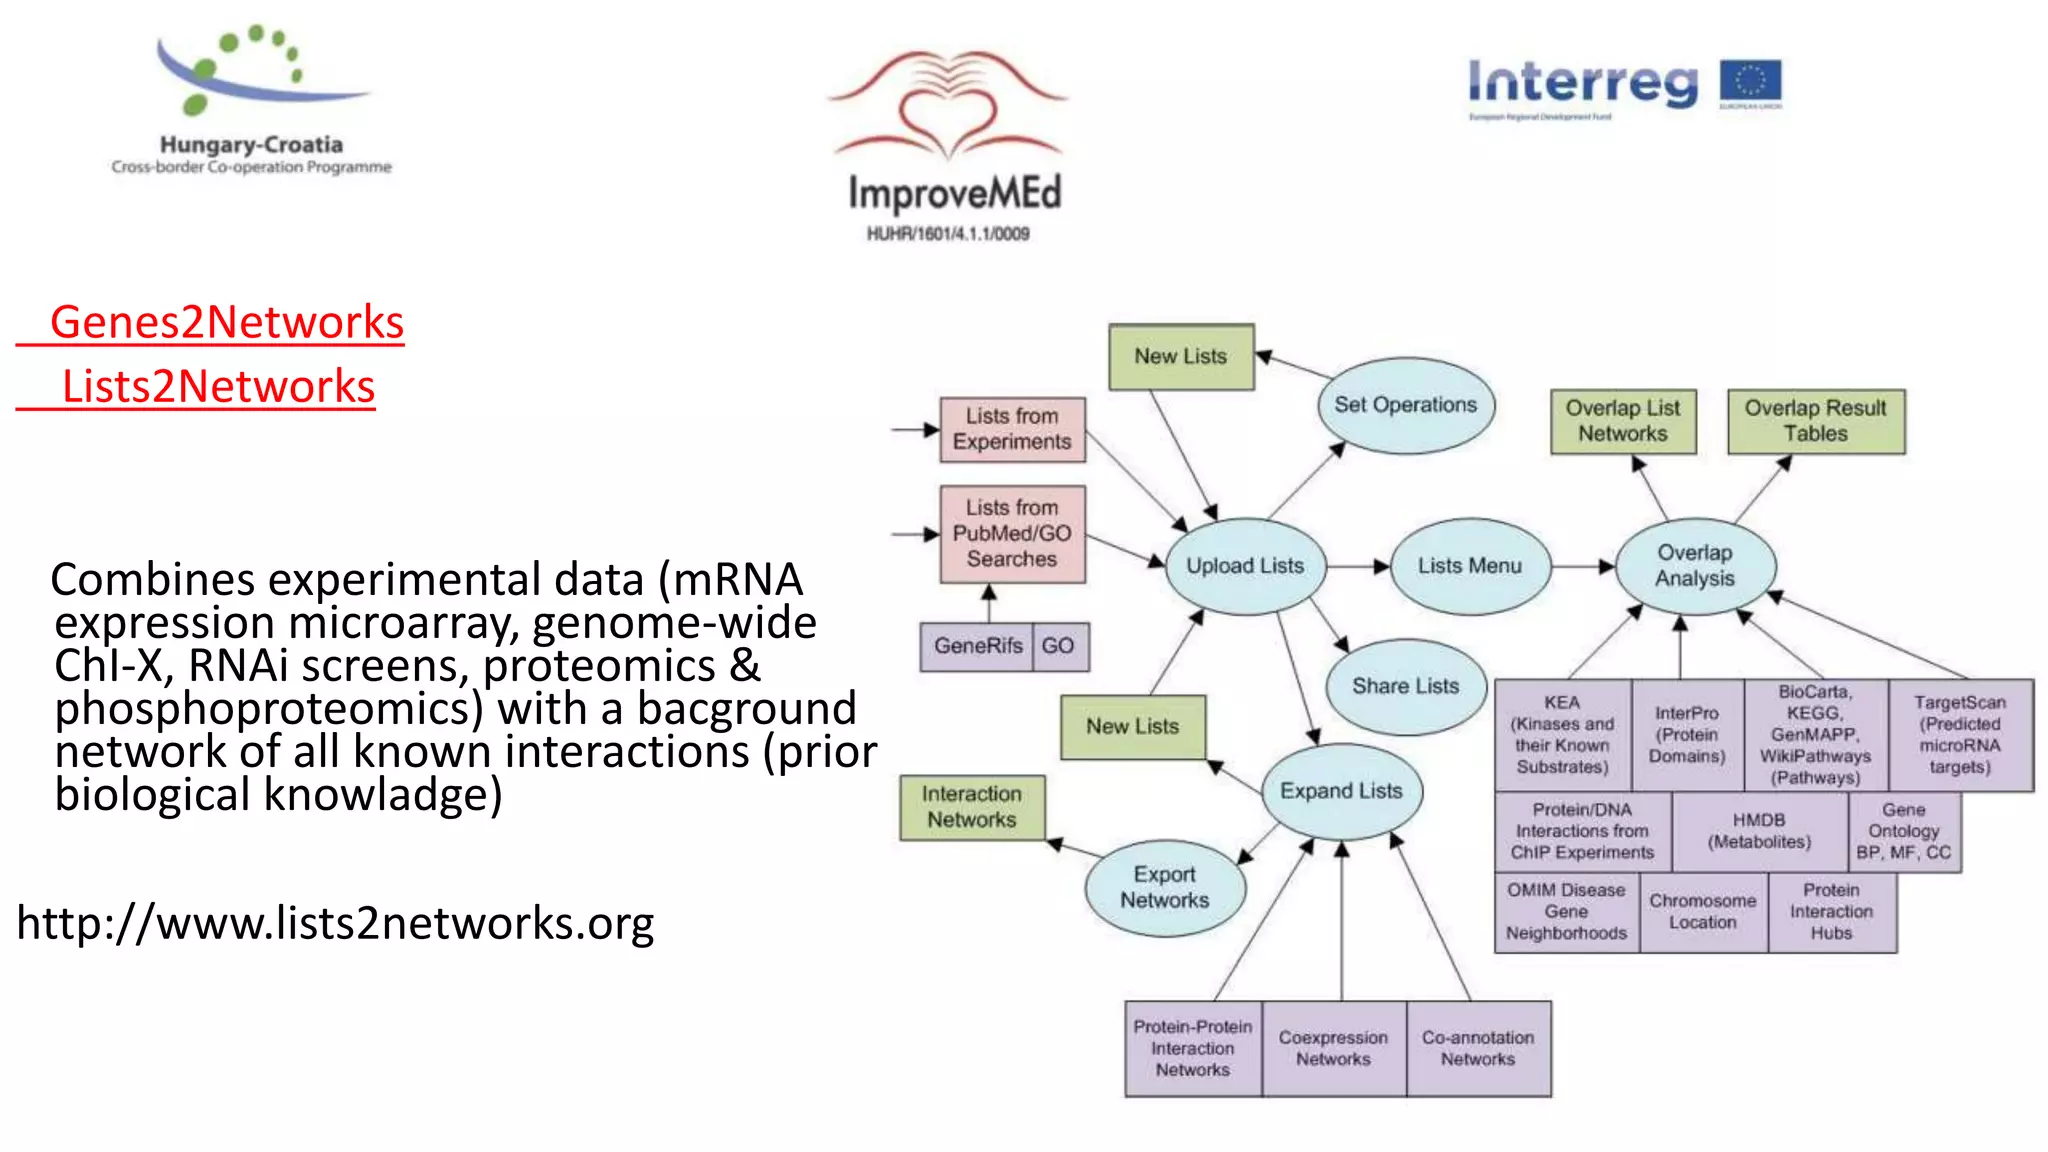
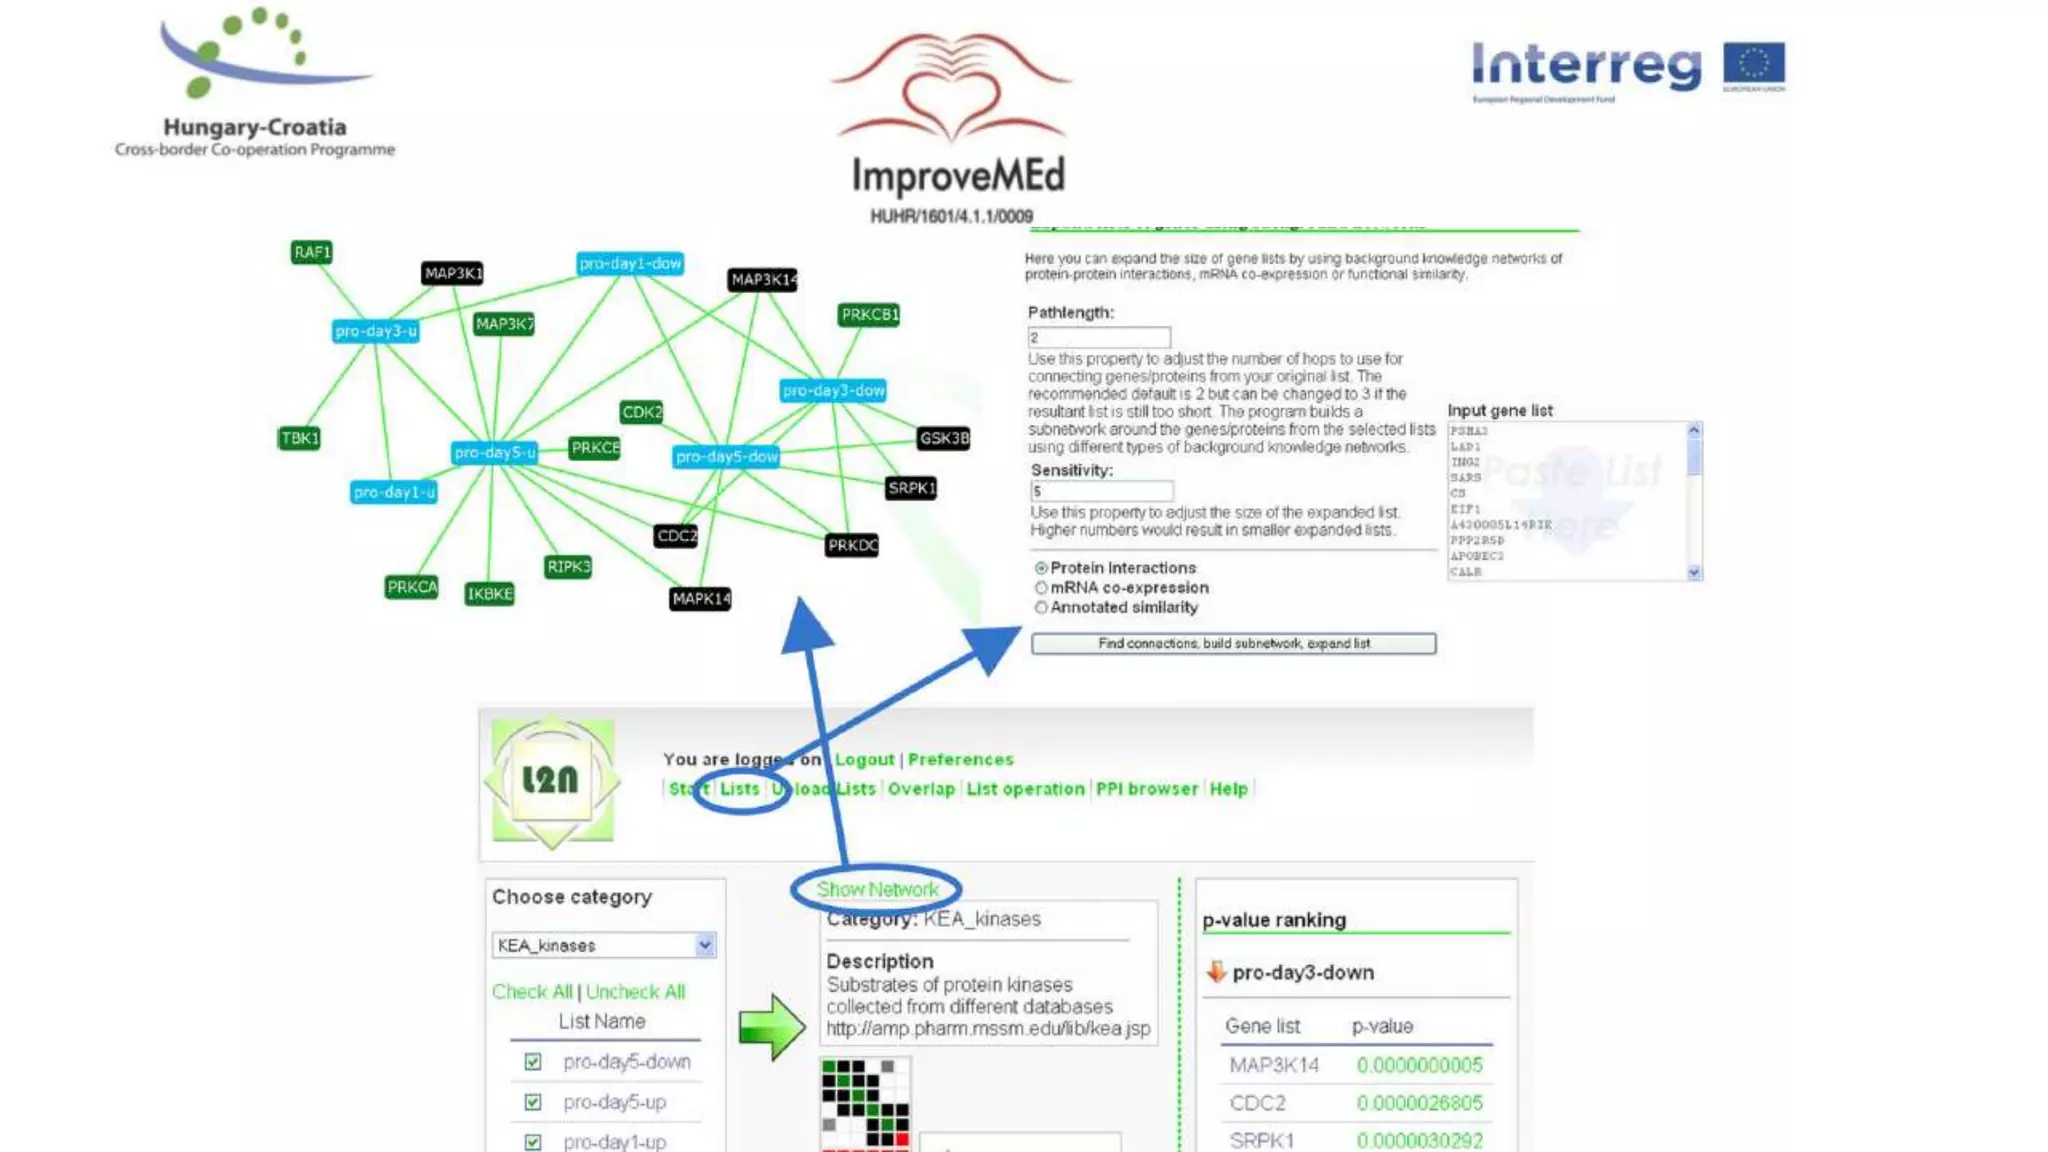
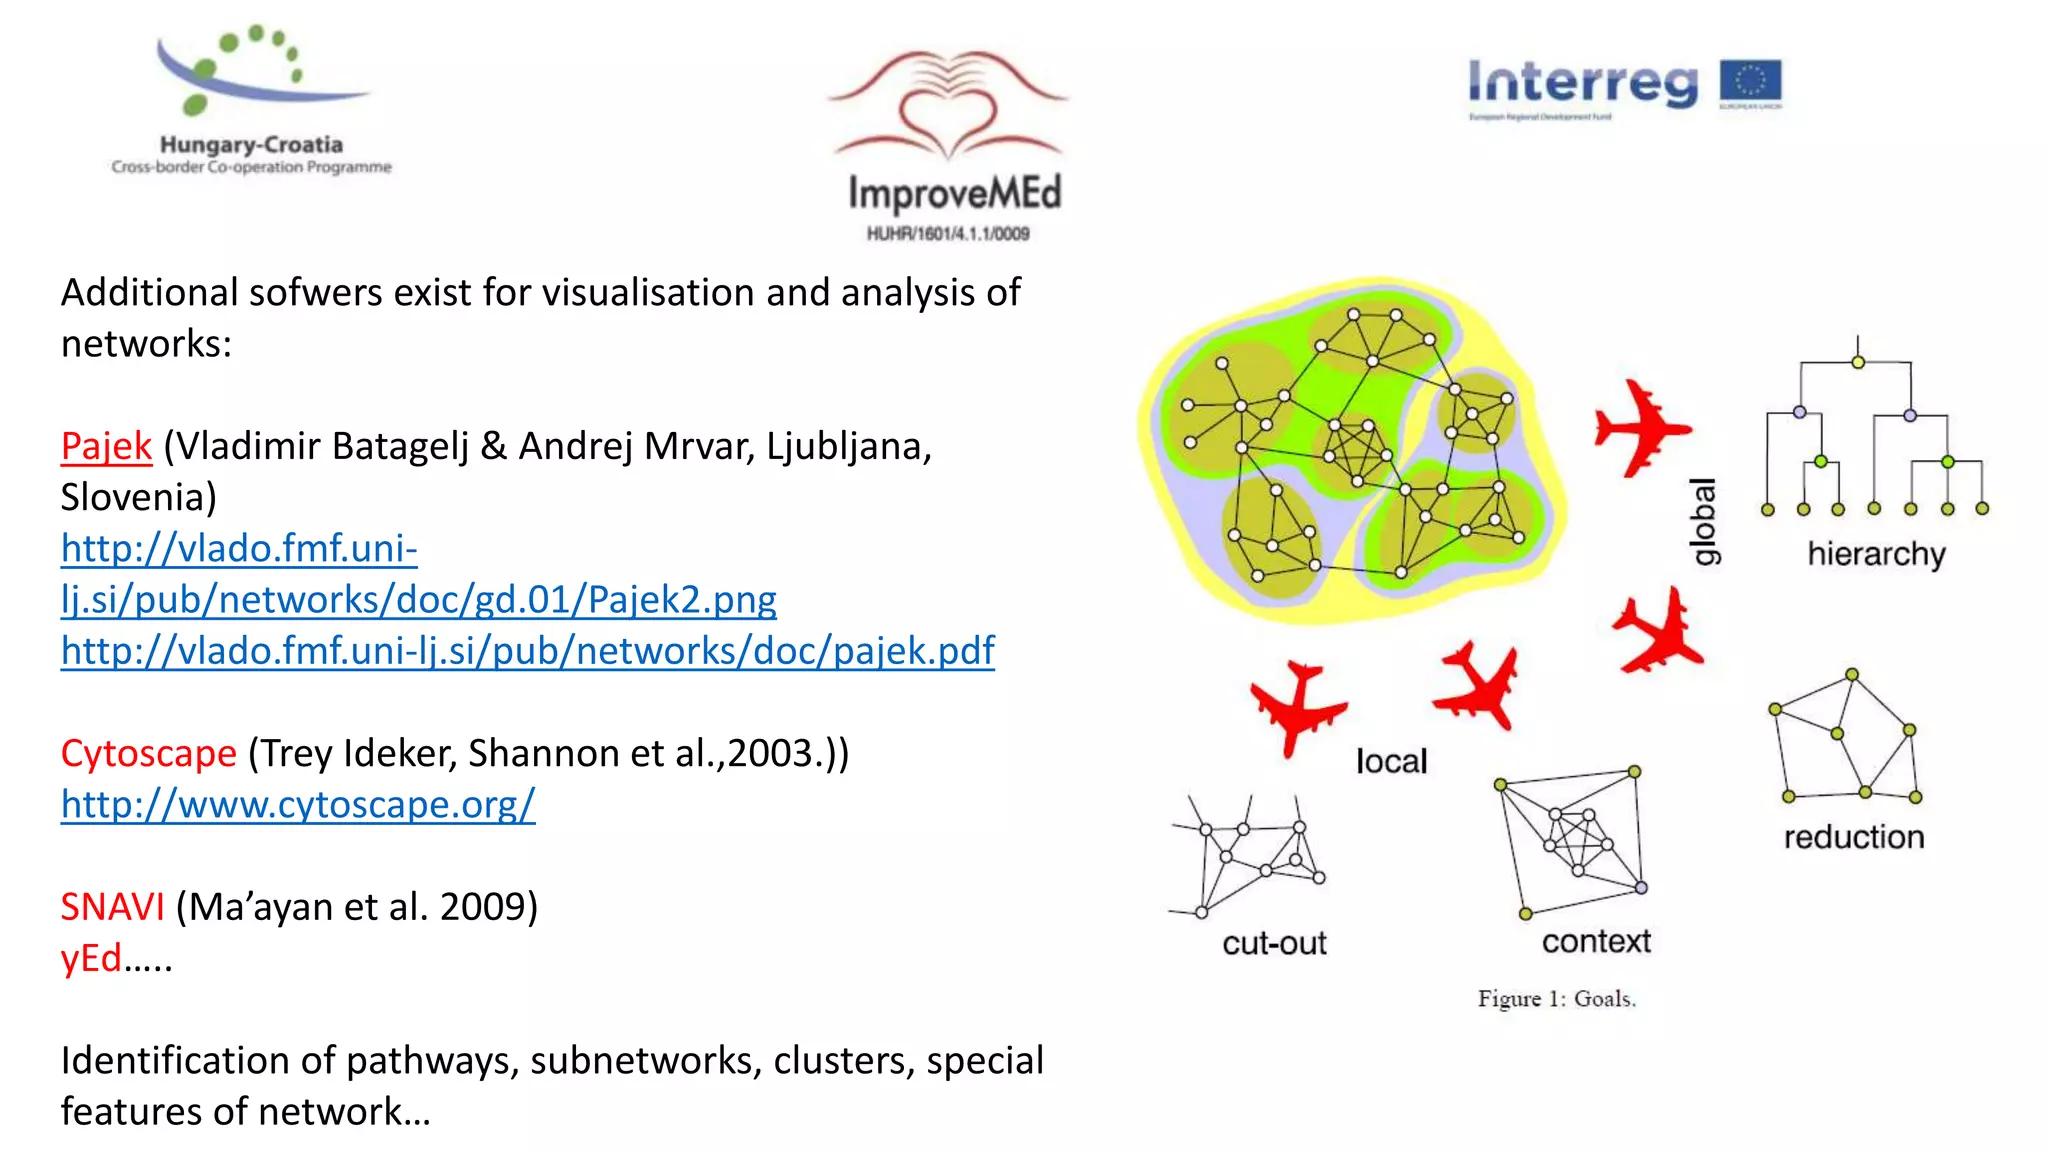
3. Networks can be constructed by integrating gene lists with protein-protein and gene regulatory interaction databases to build signaling, regulatory, and interaction networks for further analysis.