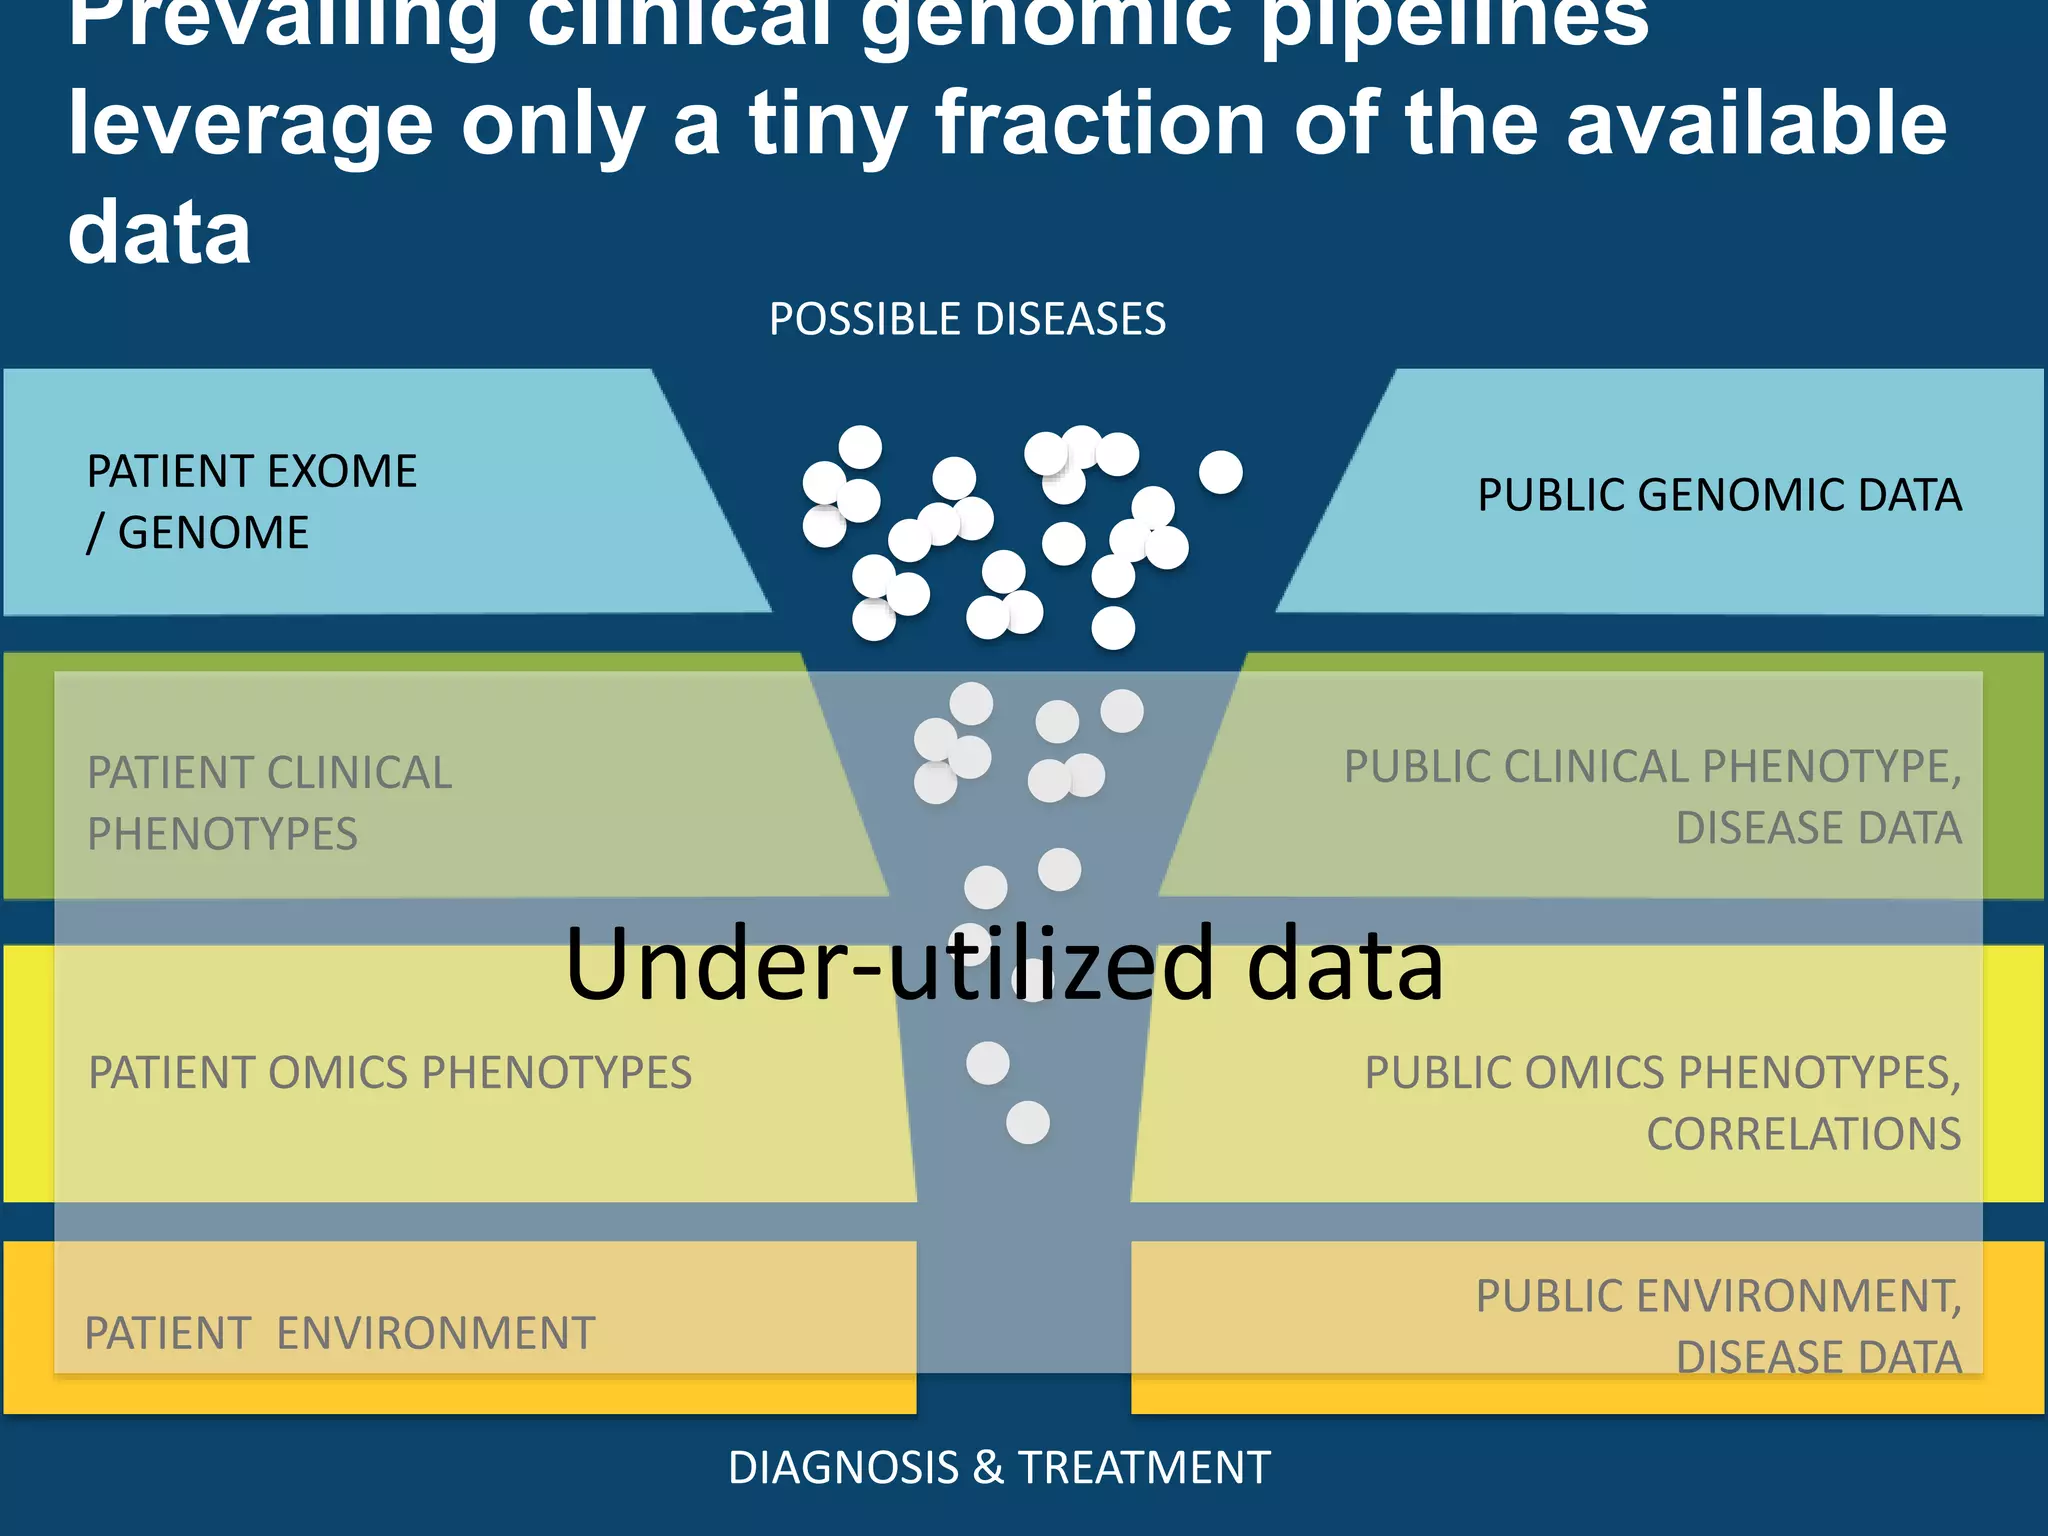
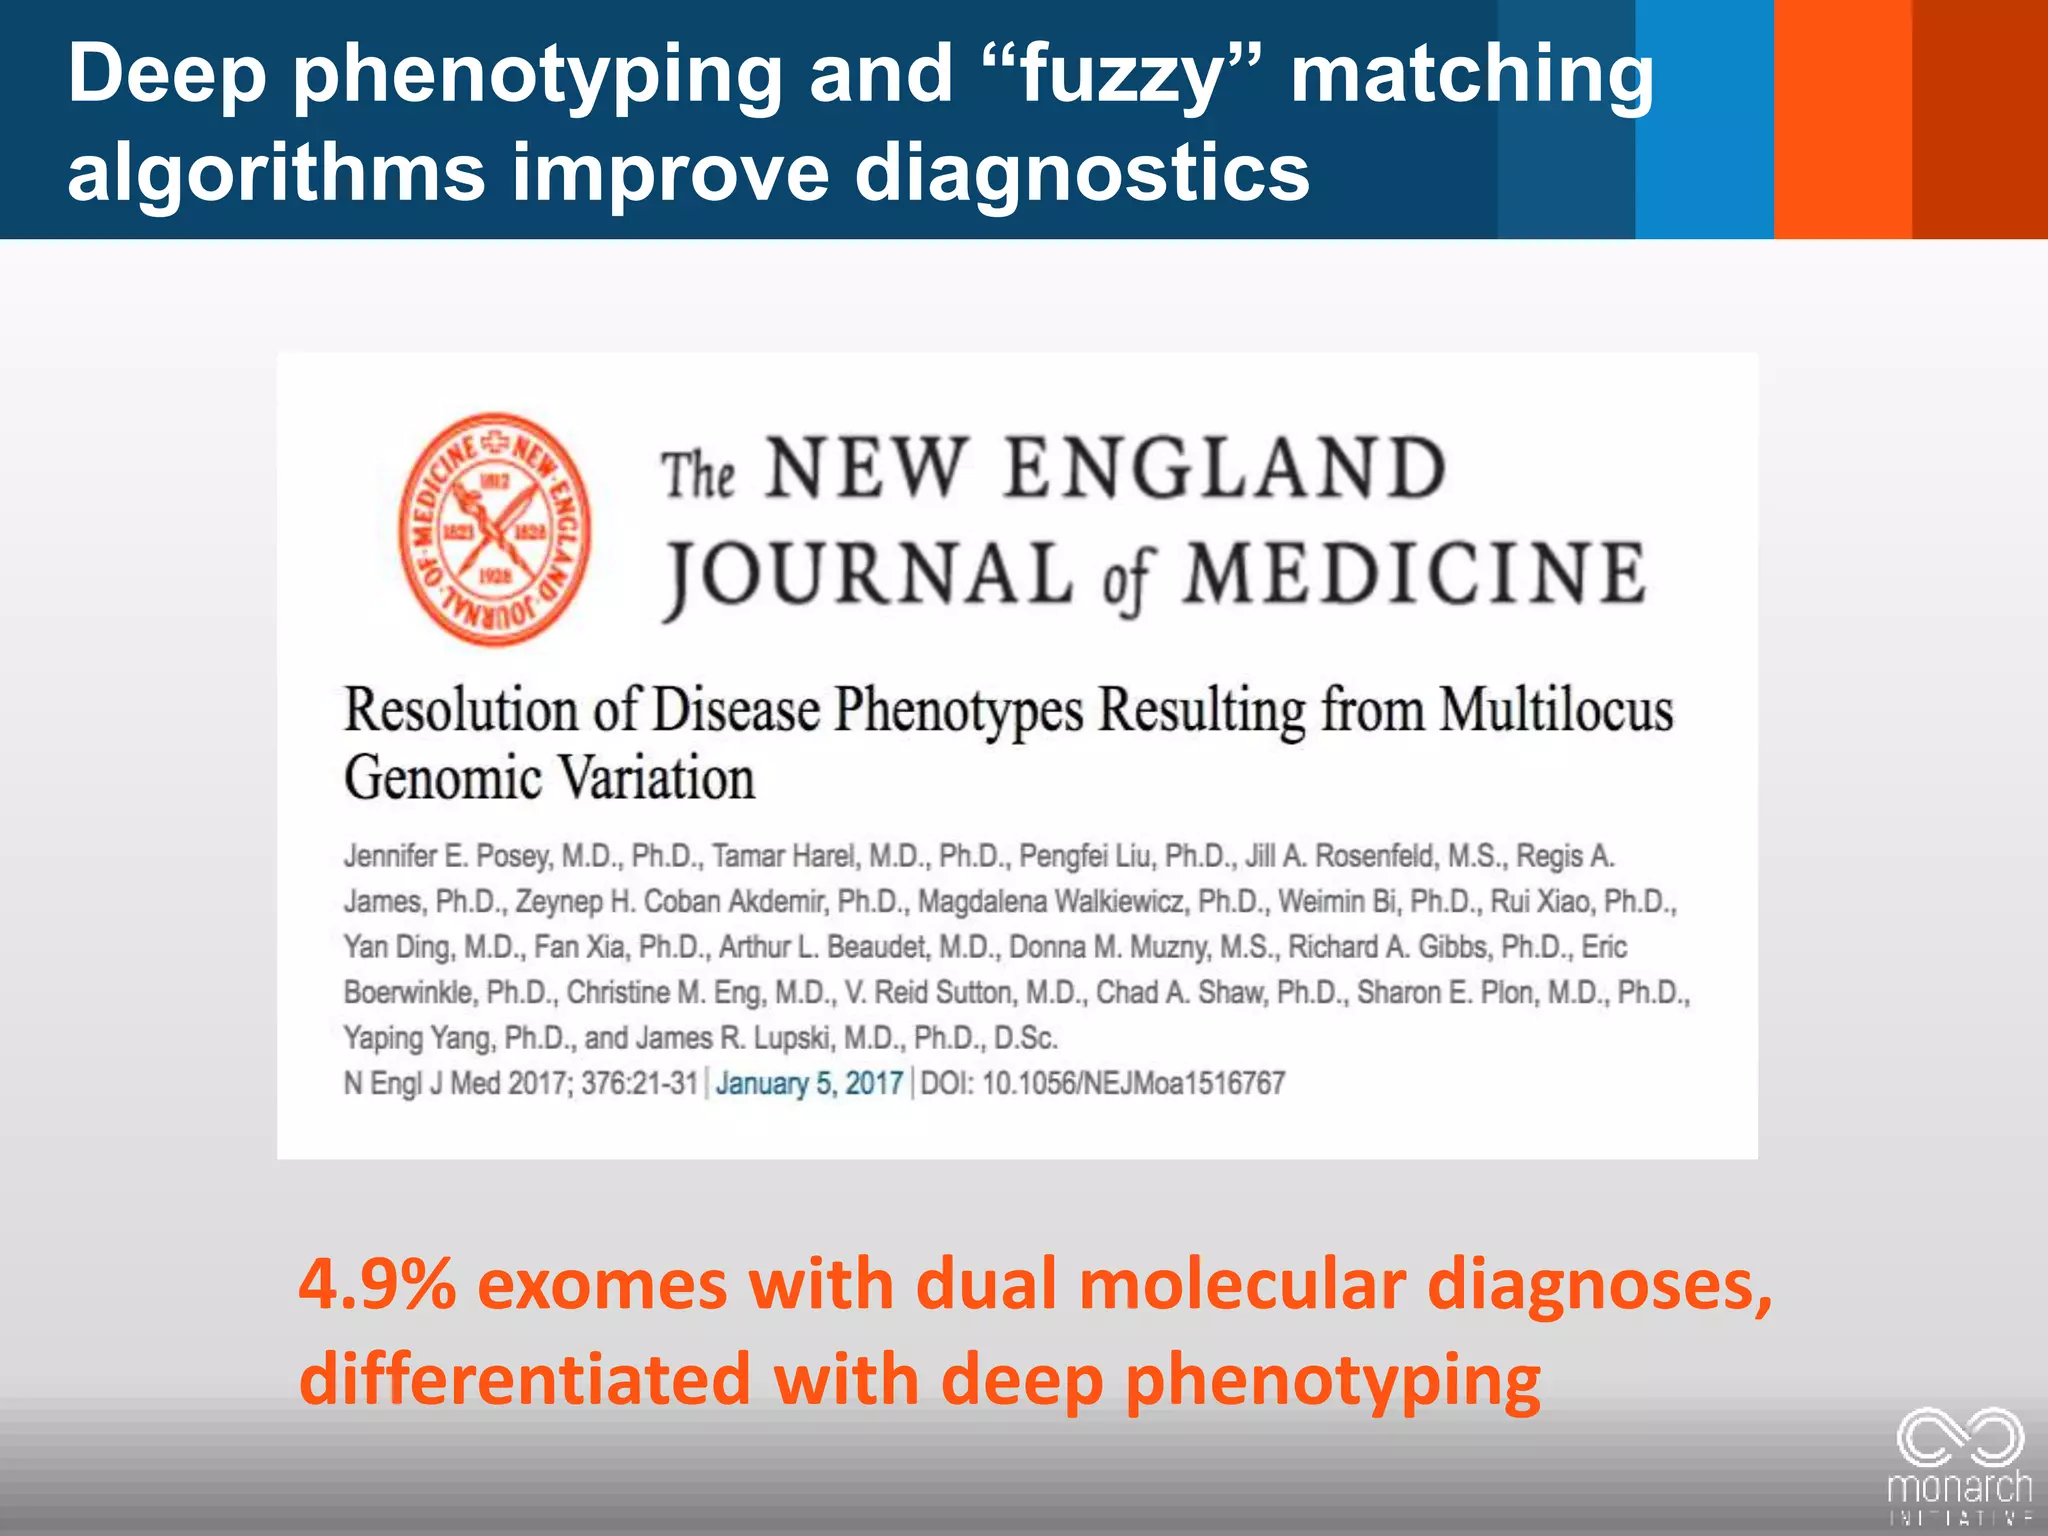
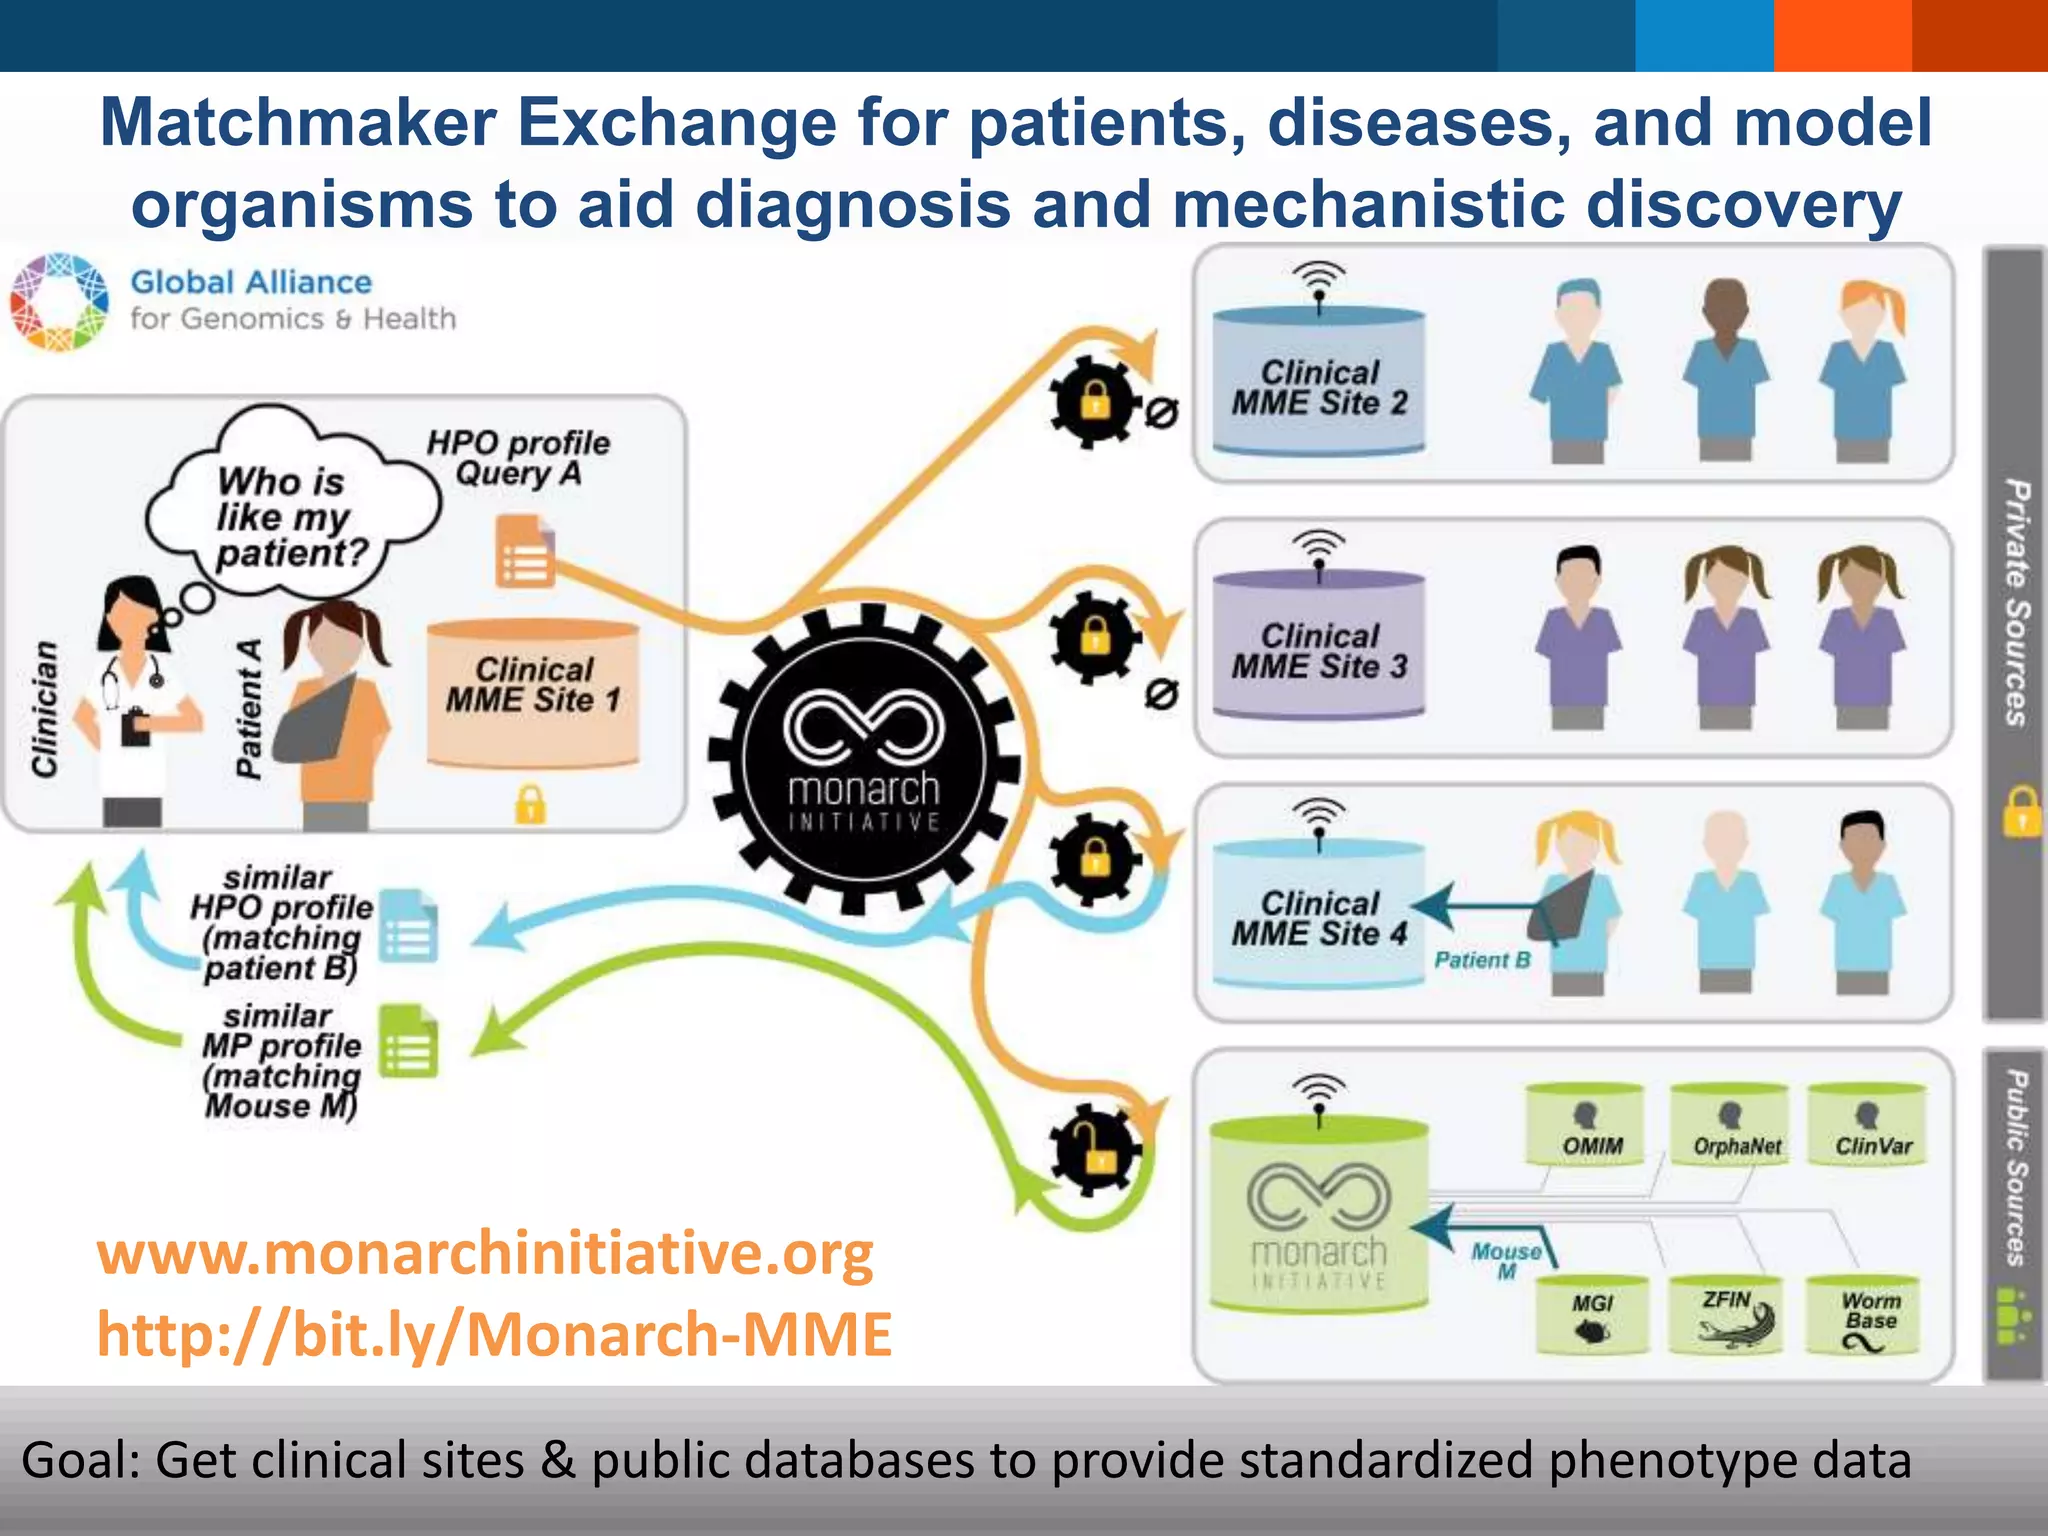
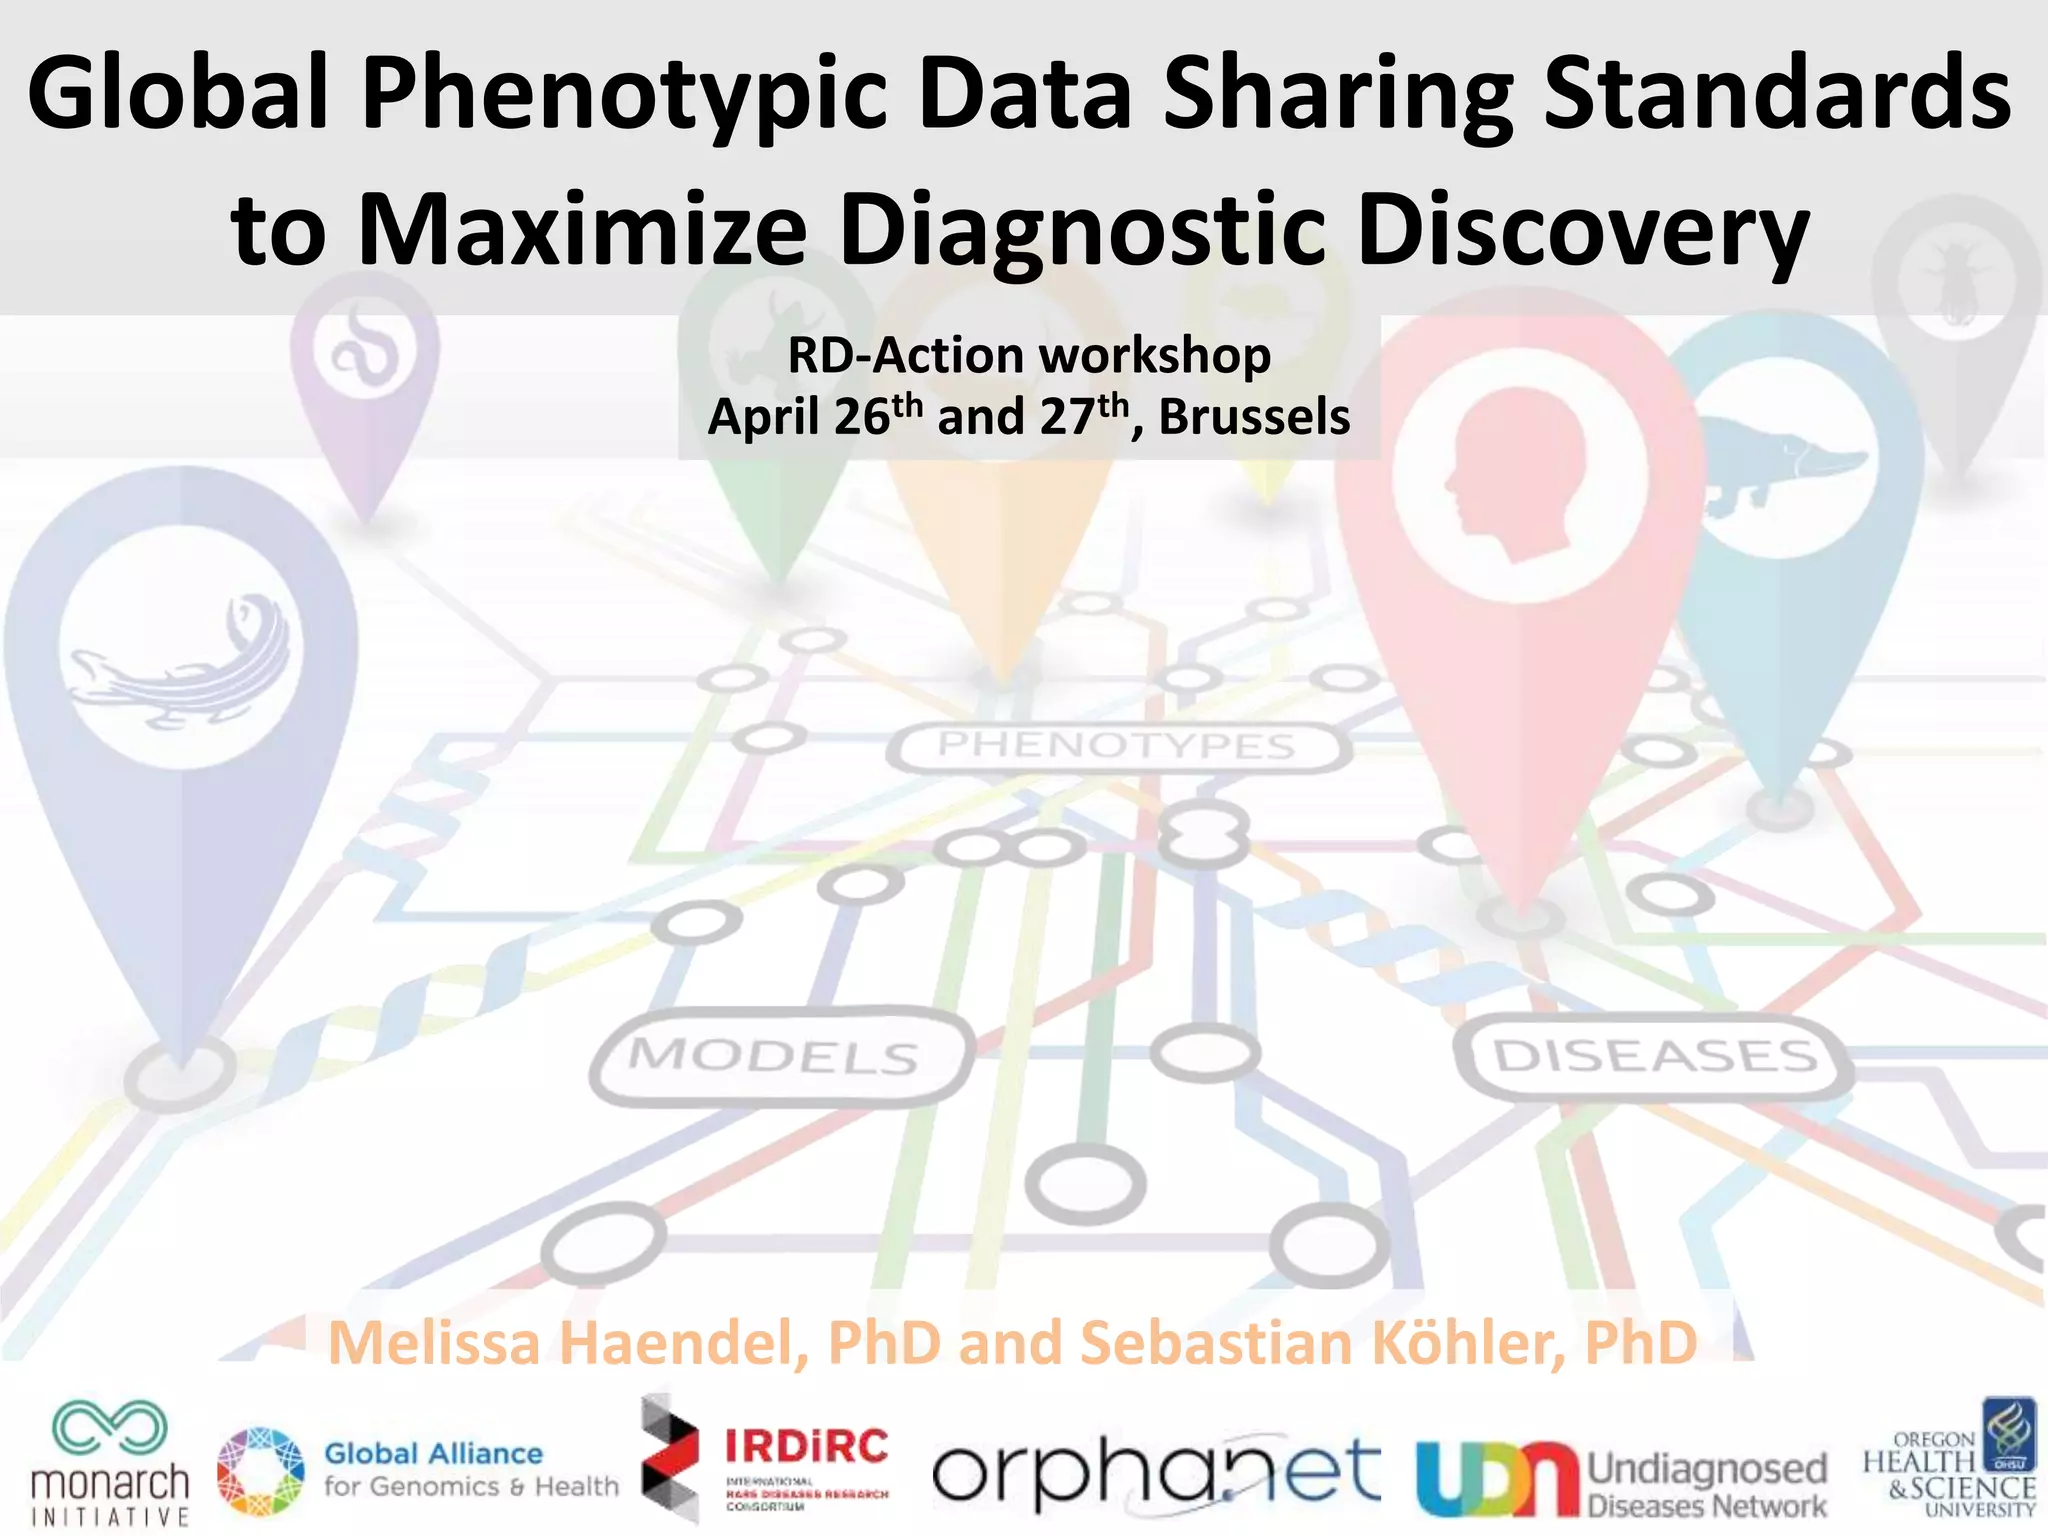
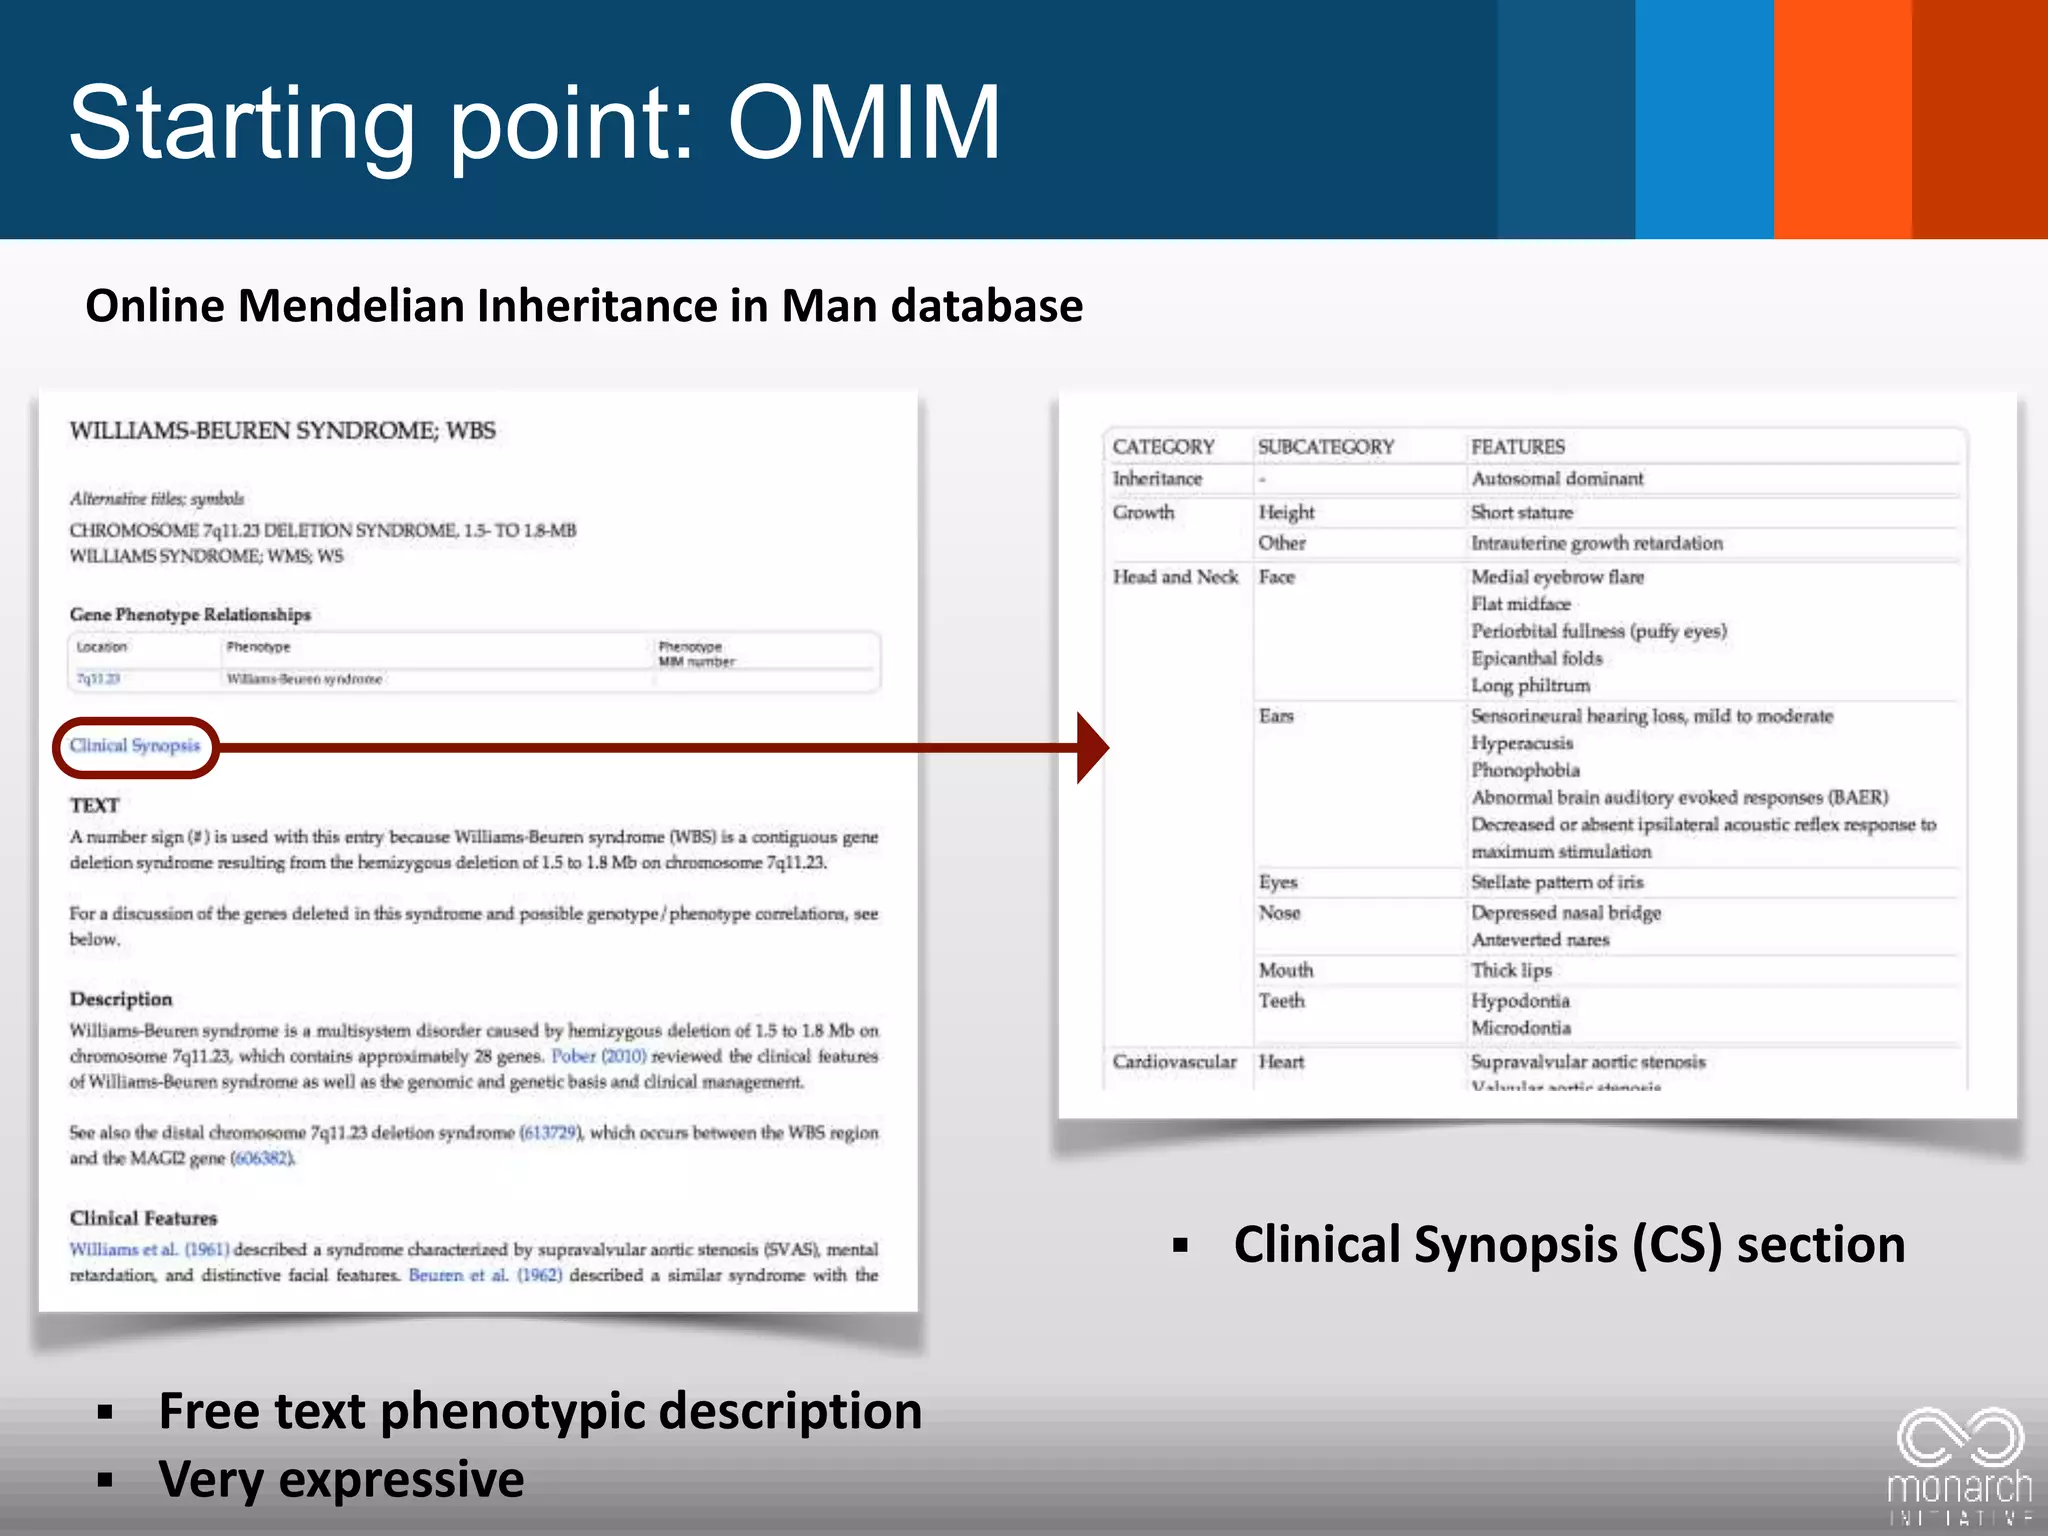
The document discusses global standards for sharing phenotypic data to enhance diagnostic discovery, highlighting the Human Phenotype Ontology (HPO) as a tool for annotating and standardizing clinical features. It emphasizes the need for interoperability among various databases and the inclusion of patient and environmental data for improved disease characterization. The introduction of Phenopackets is proposed as a standardized method for phenotype data exchange to support research and clinical applications.
![What do we mean by phenotype?
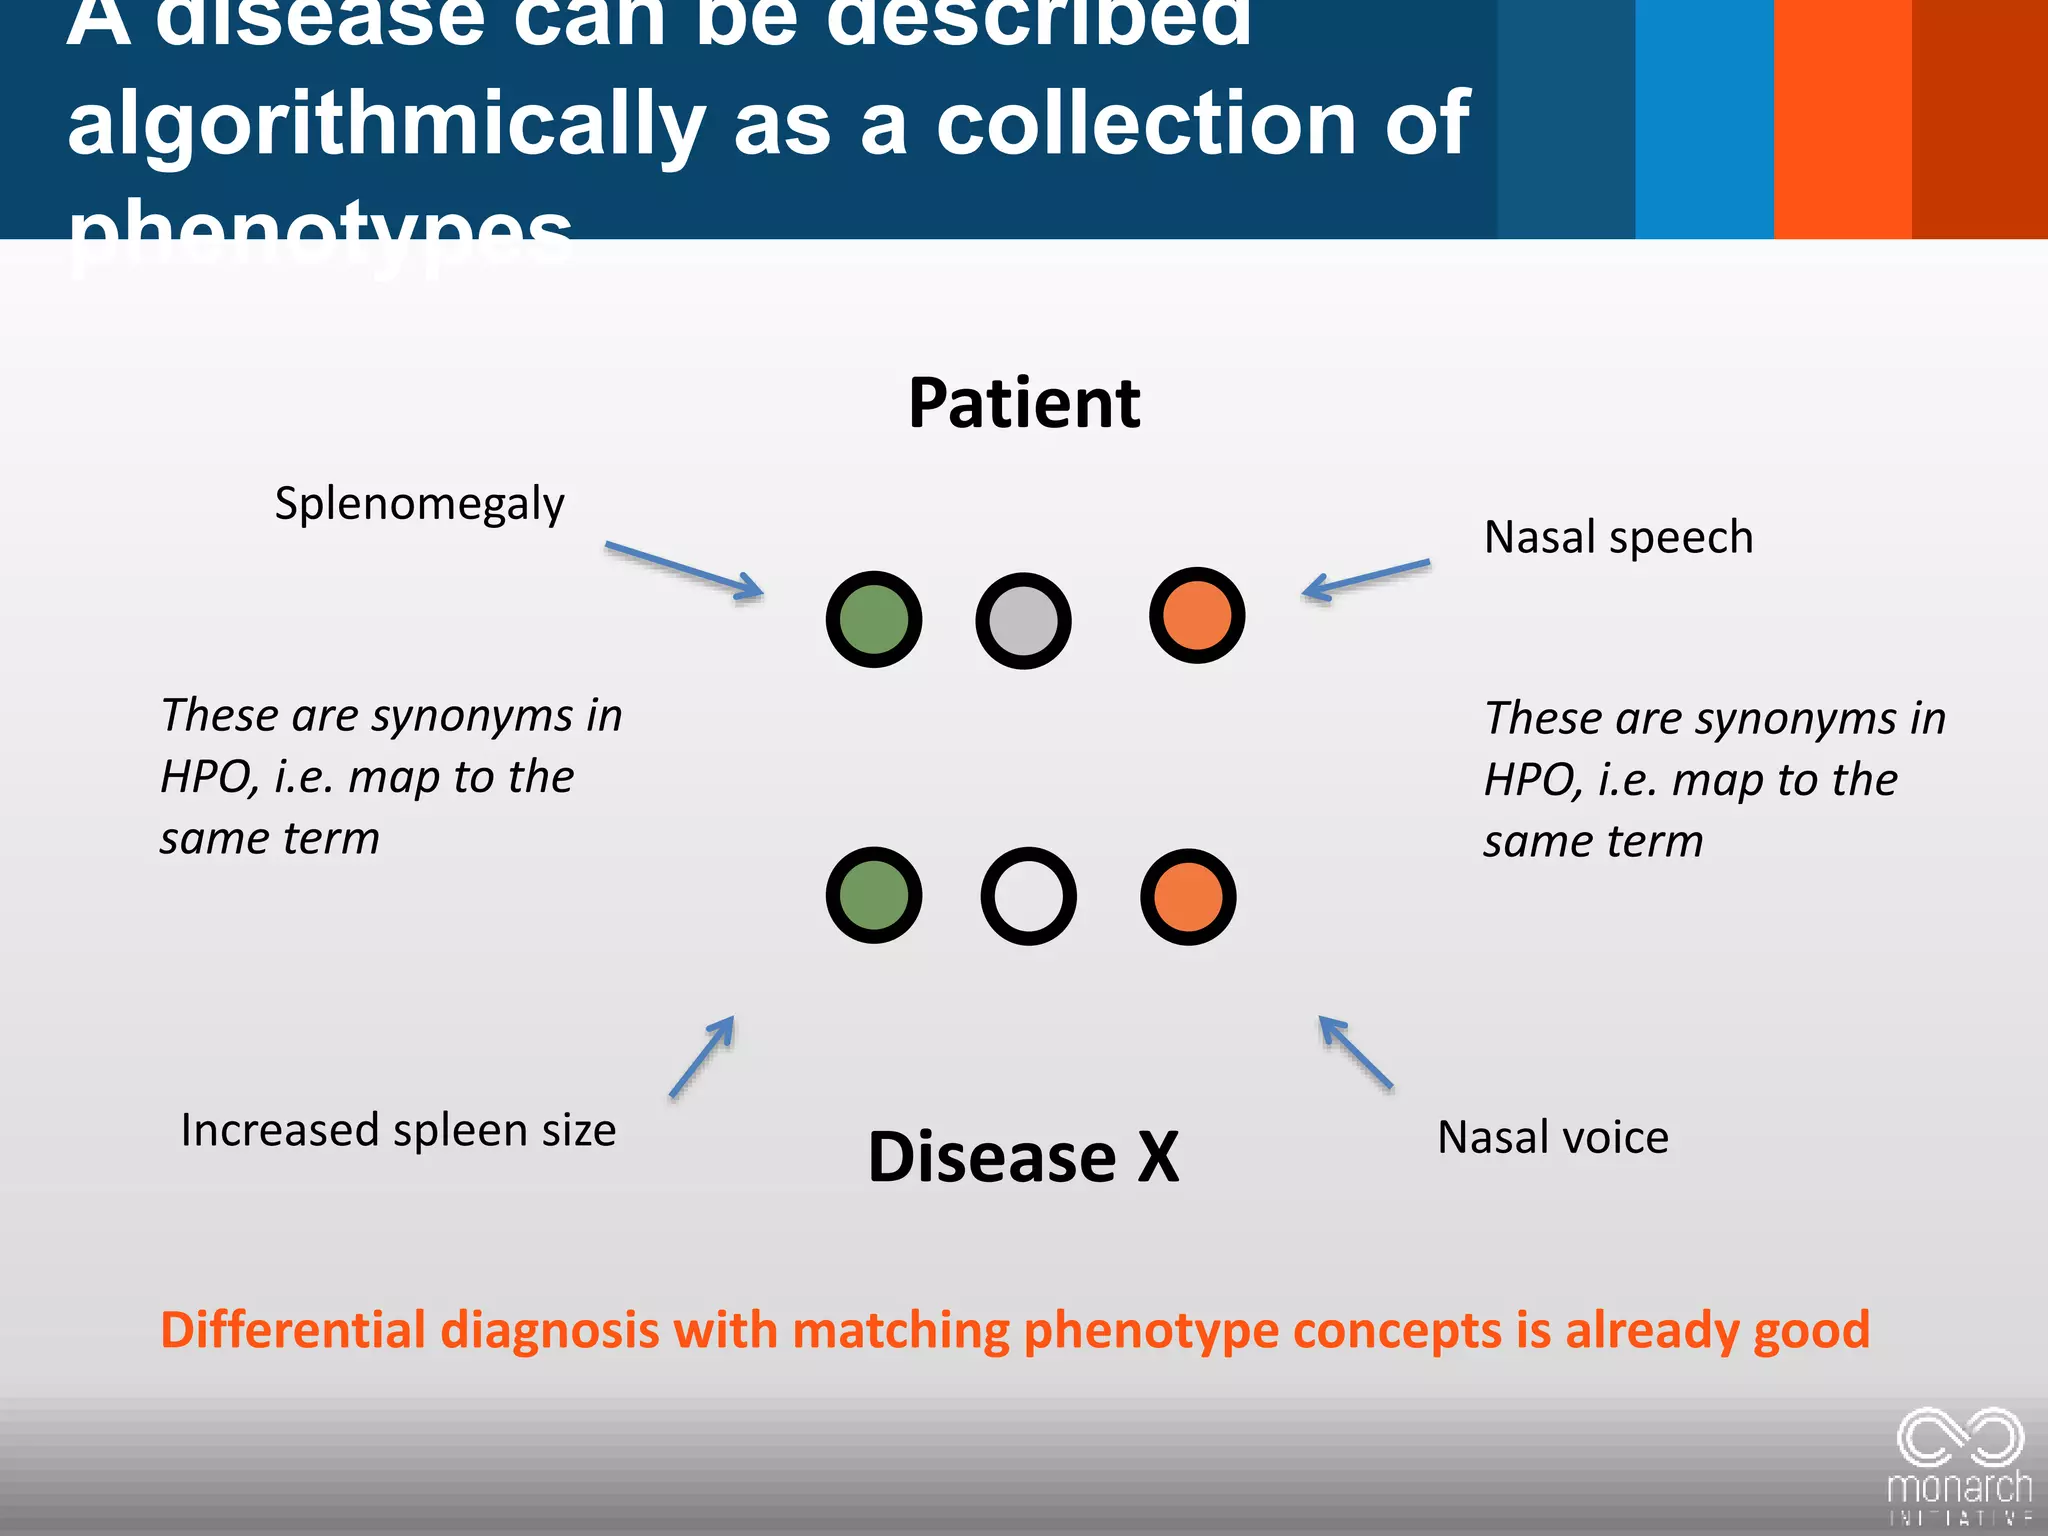
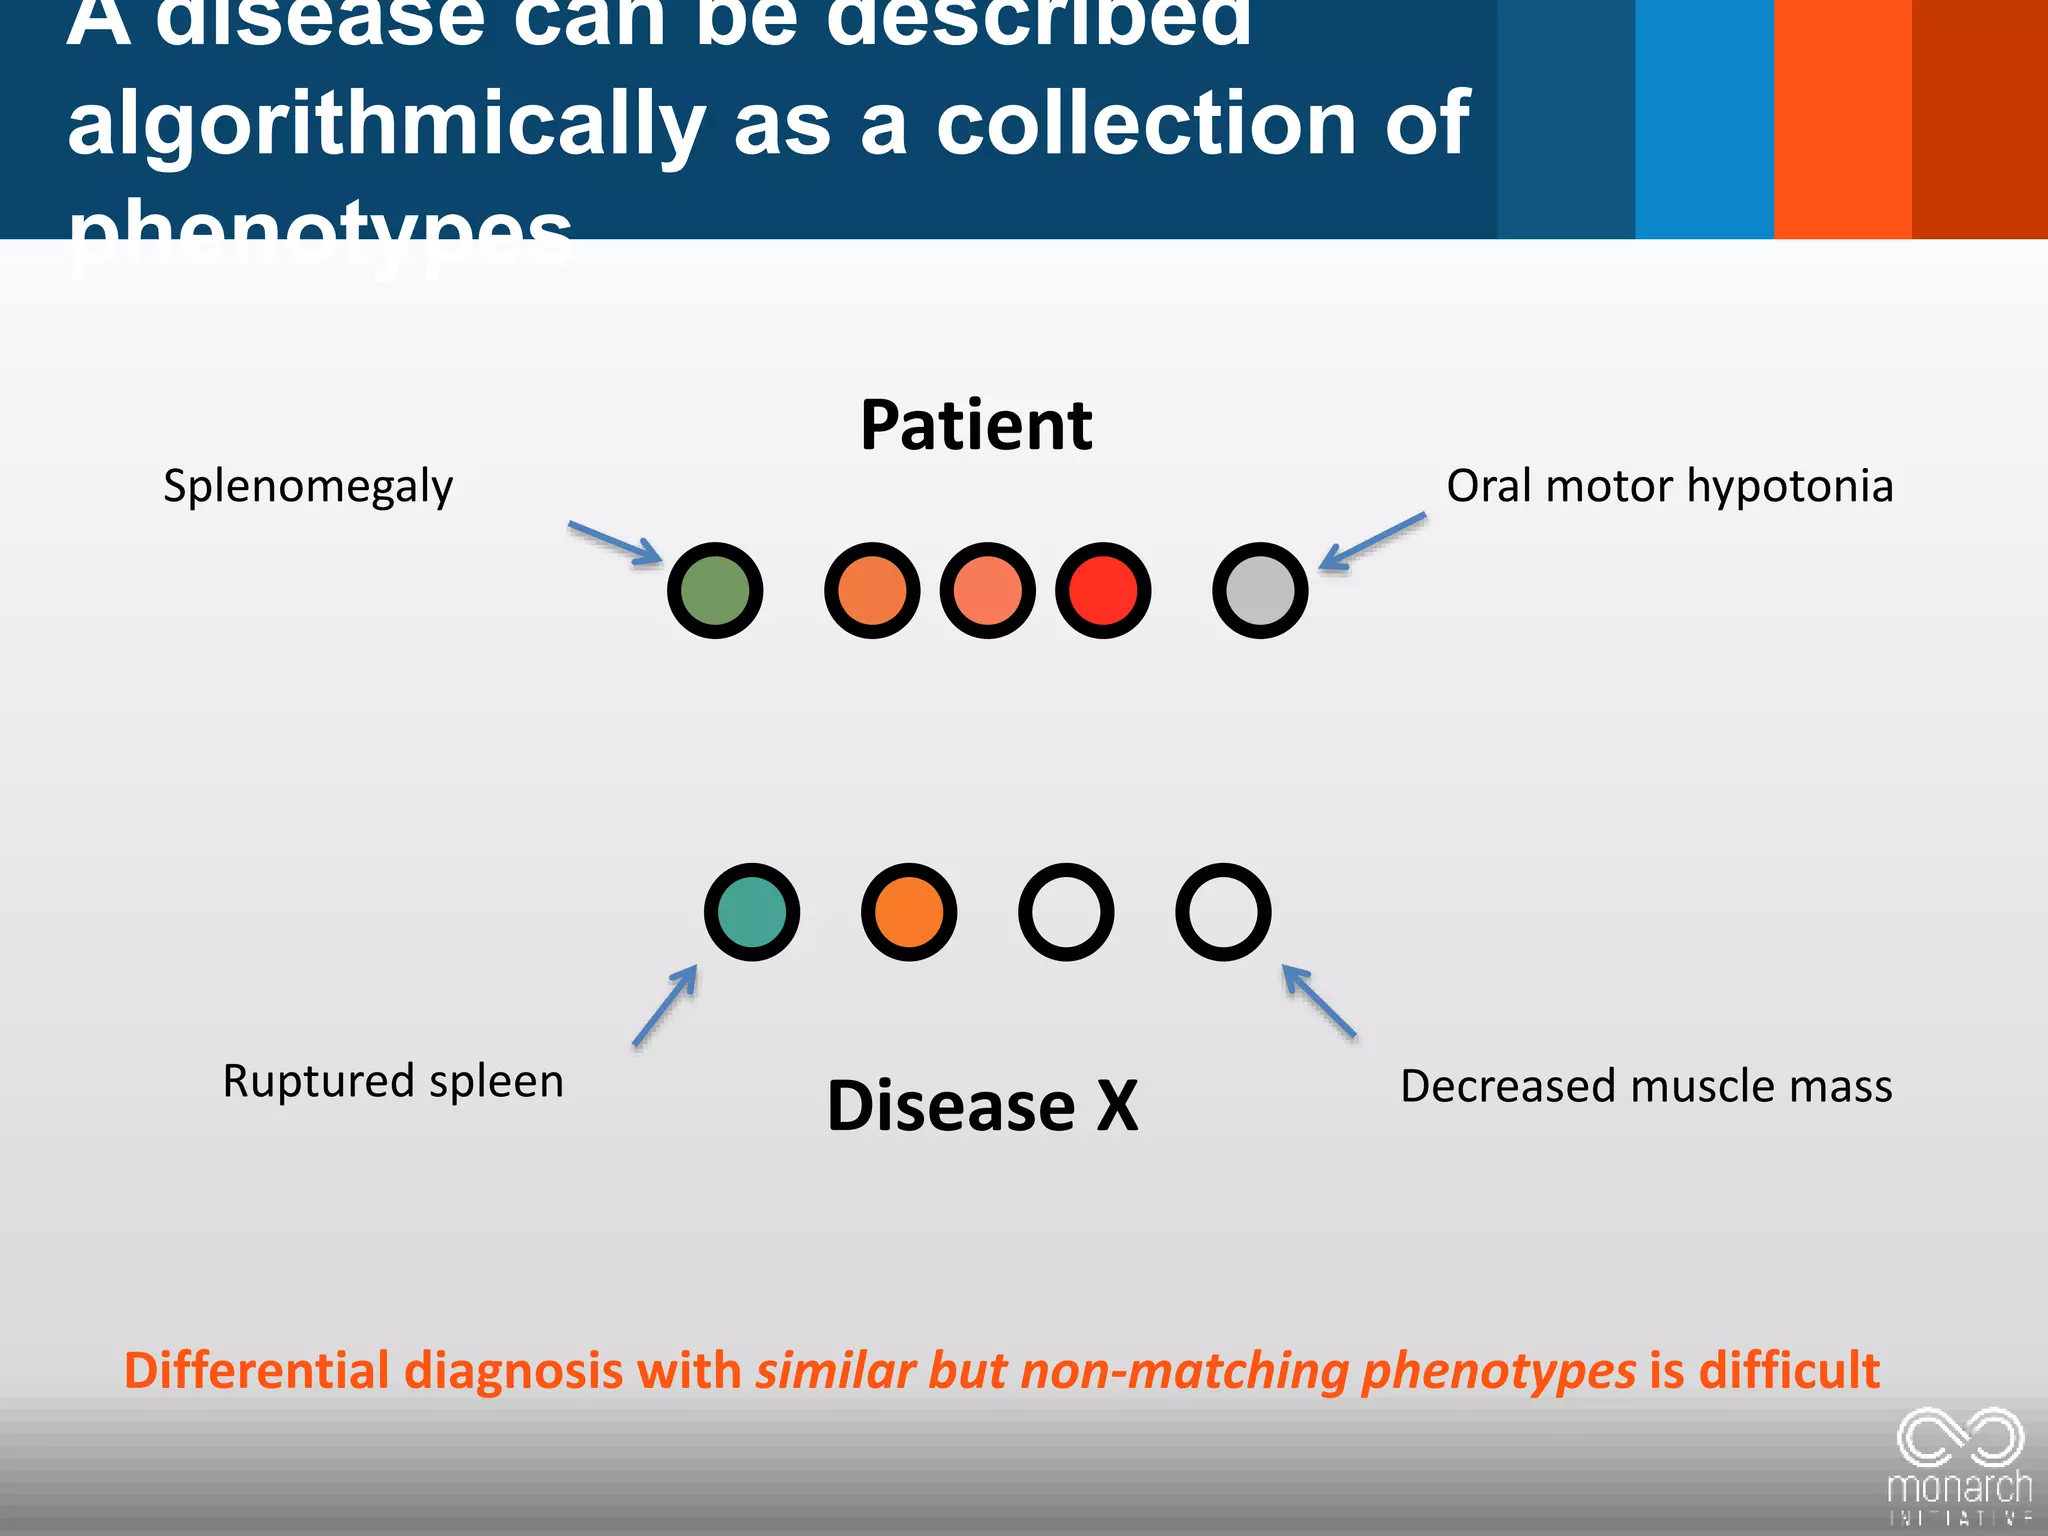
= Phenotypic abnormality = clinical feature
Constellation/Pattern clinical features
defines a disease:
– [Disease X]... is a rare developmental disorder defined by
the combination of aplasia cutis congenita of the scalp
vertex and terminal transverse limb defects. In addition,
vascular anomalies such as cutis marmorata
telangiectatica ... are recurrently seen.
(Yes, this is a simplification)](https://image.slidesharecdn.com/brusselsmerged2017-04-23-170427124214/75/Global-phenotypic-data-sharing-standards-to-maximize-diagnostic-discovery-3-2048.jpg)

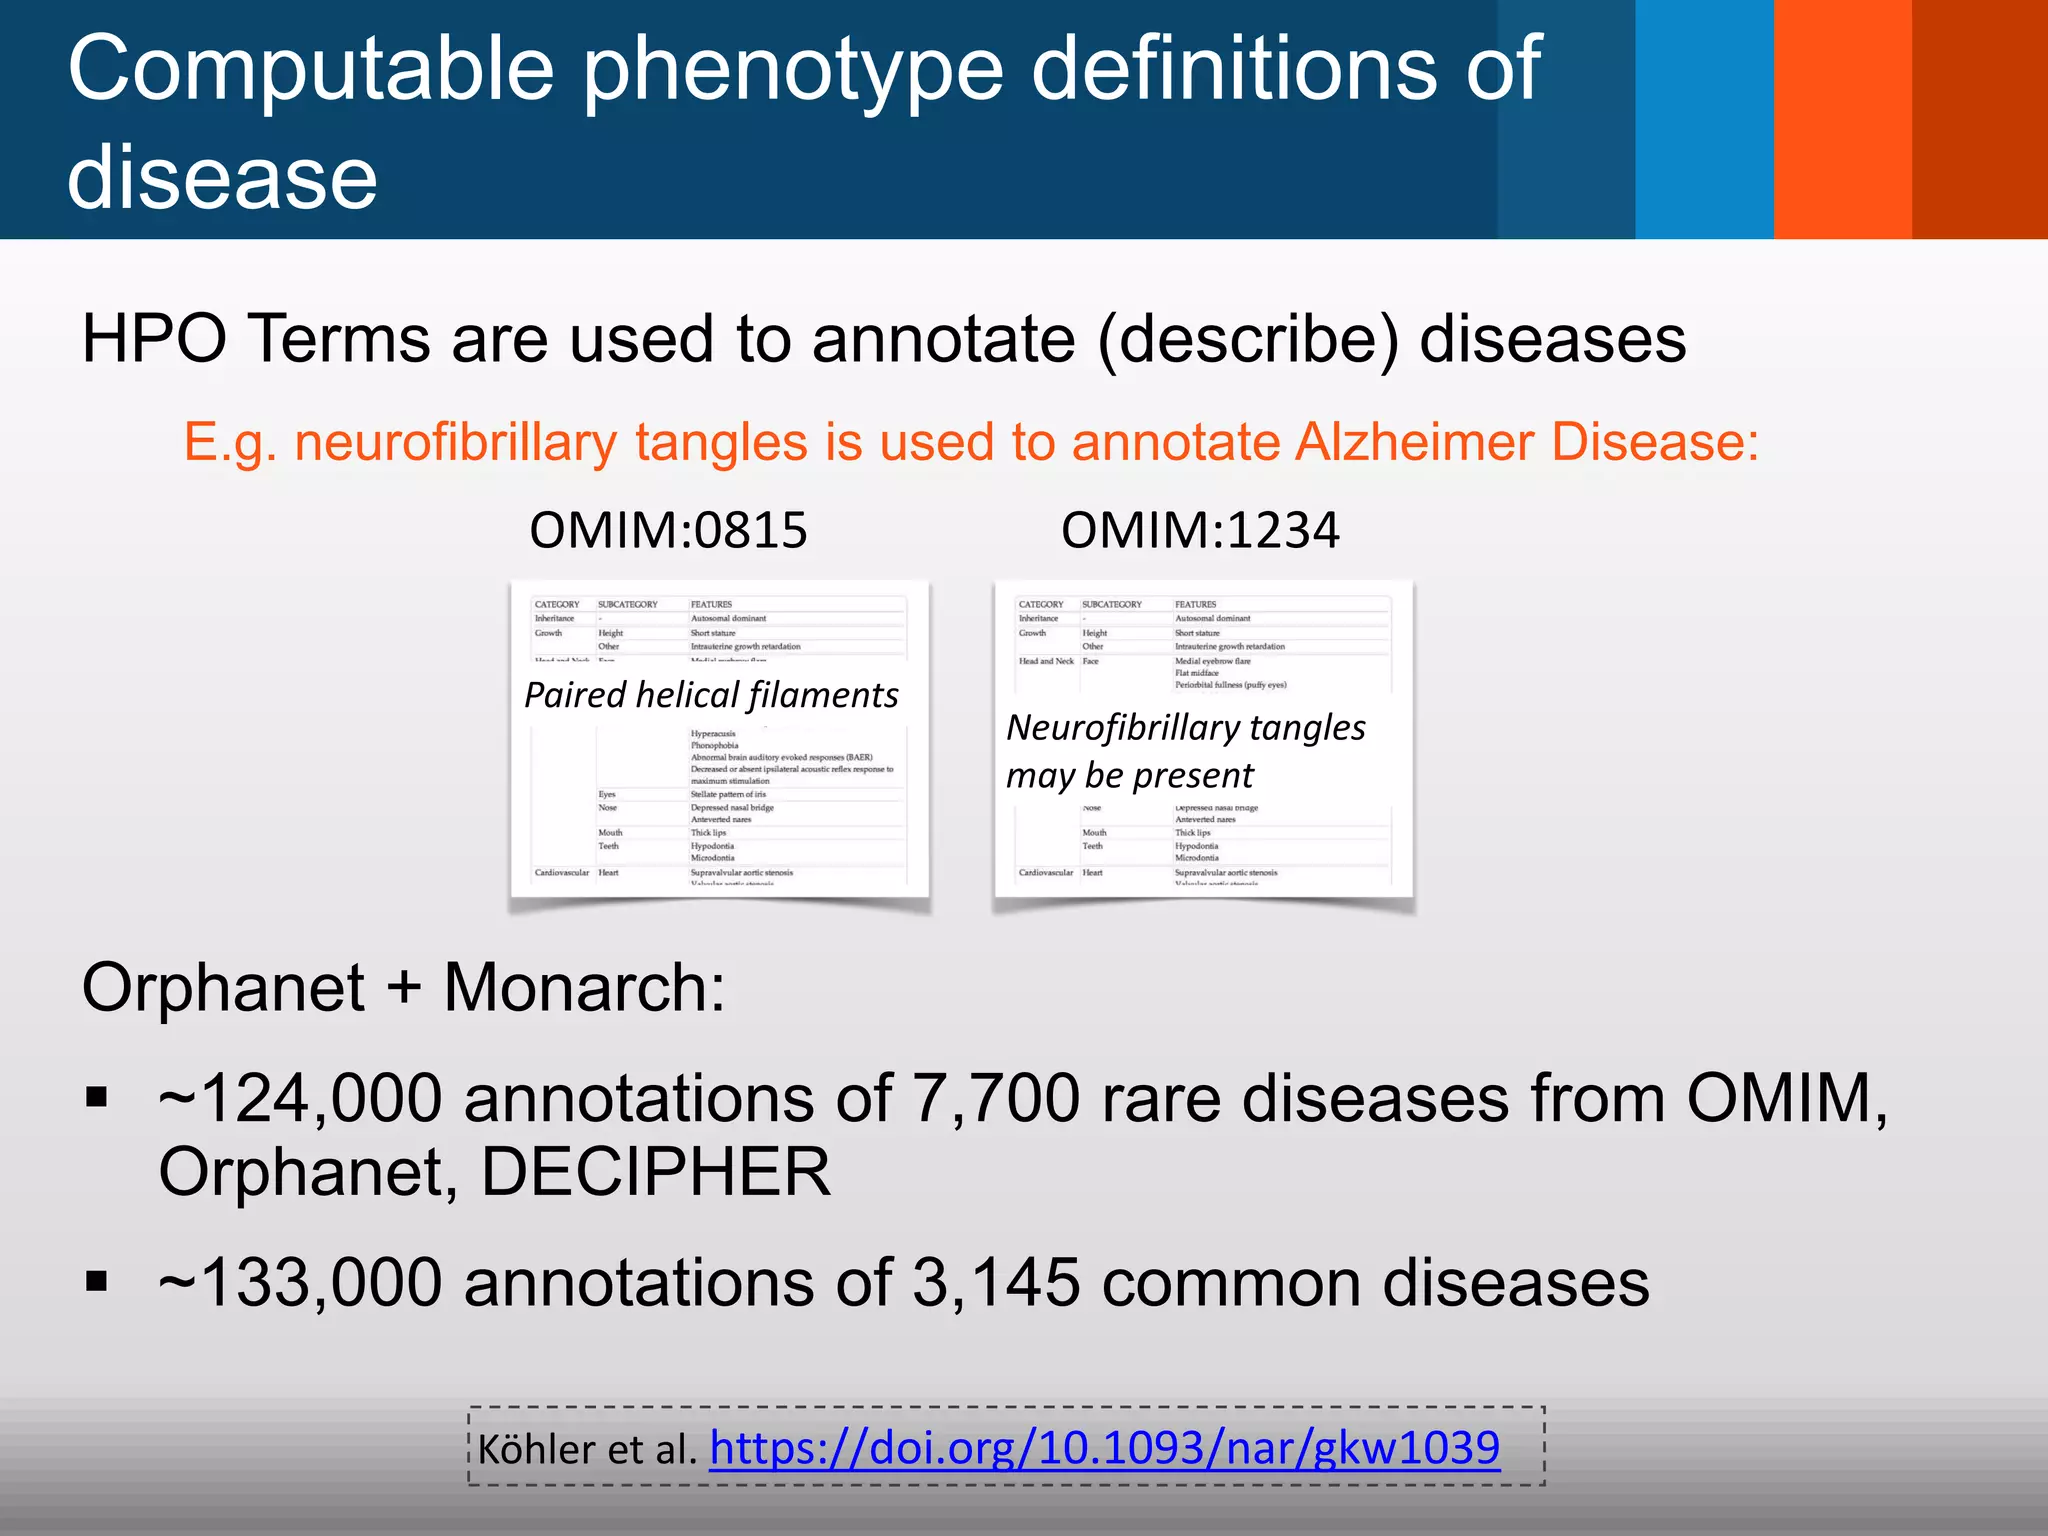
![The Human Phenotype Ontology (HPO)
Synonyms merged into one term
Textual definitions for each term
id: HP:0002185
name: Neurofibrillary tangles
def: Pathological protein
aggregates formed by
hyperphosphorylation of a
microtubule-associated protein
known as tau, causing it to
aggregate in an insoluble form.
[HPO:sdoelken]
synonym: Neurofibrillary tangles
may be present EXACT []
synonym: Paired helical filaments
EXACT []
abnormality of the
nervous system
neurofibrillary
tangles
cerebral inclusion
bodies
gait ataxia
gait
disturbance
ataxia
phenotypic
abnormality
abnormality of
movement
abnormality of the
central nervous
system
incoordination](https://image.slidesharecdn.com/brusselsmerged2017-04-23-170427124214/75/Global-phenotypic-data-sharing-standards-to-maximize-diagnostic-discovery-9-2048.jpg)