Download as PDF, PPTX


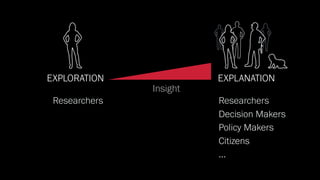
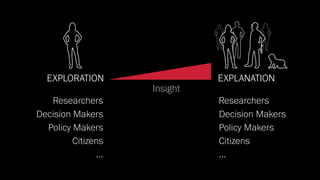
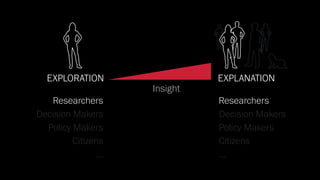


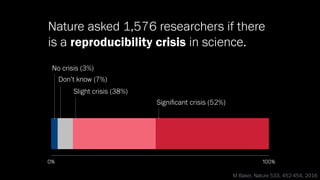


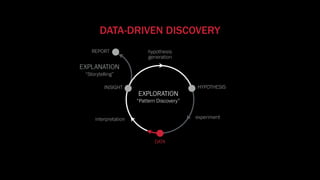
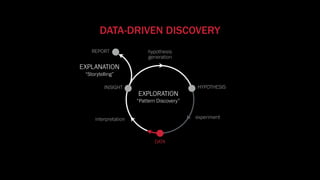


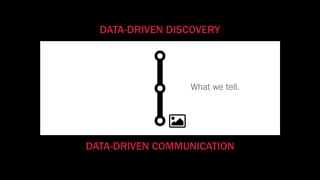

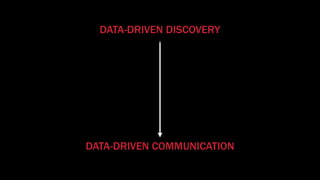


The document discusses the significance of data visualization in biomedical sciences, highlighting its role in aiding researchers, decision makers, and the public in understanding complex data. It addresses the reproducibility crisis in science, emphasizing how effective visualization can help in hypothesis generation, exploration, and storytelling. The author presents various visualization methods and tools to improve insight and facilitate data-driven discoveries.