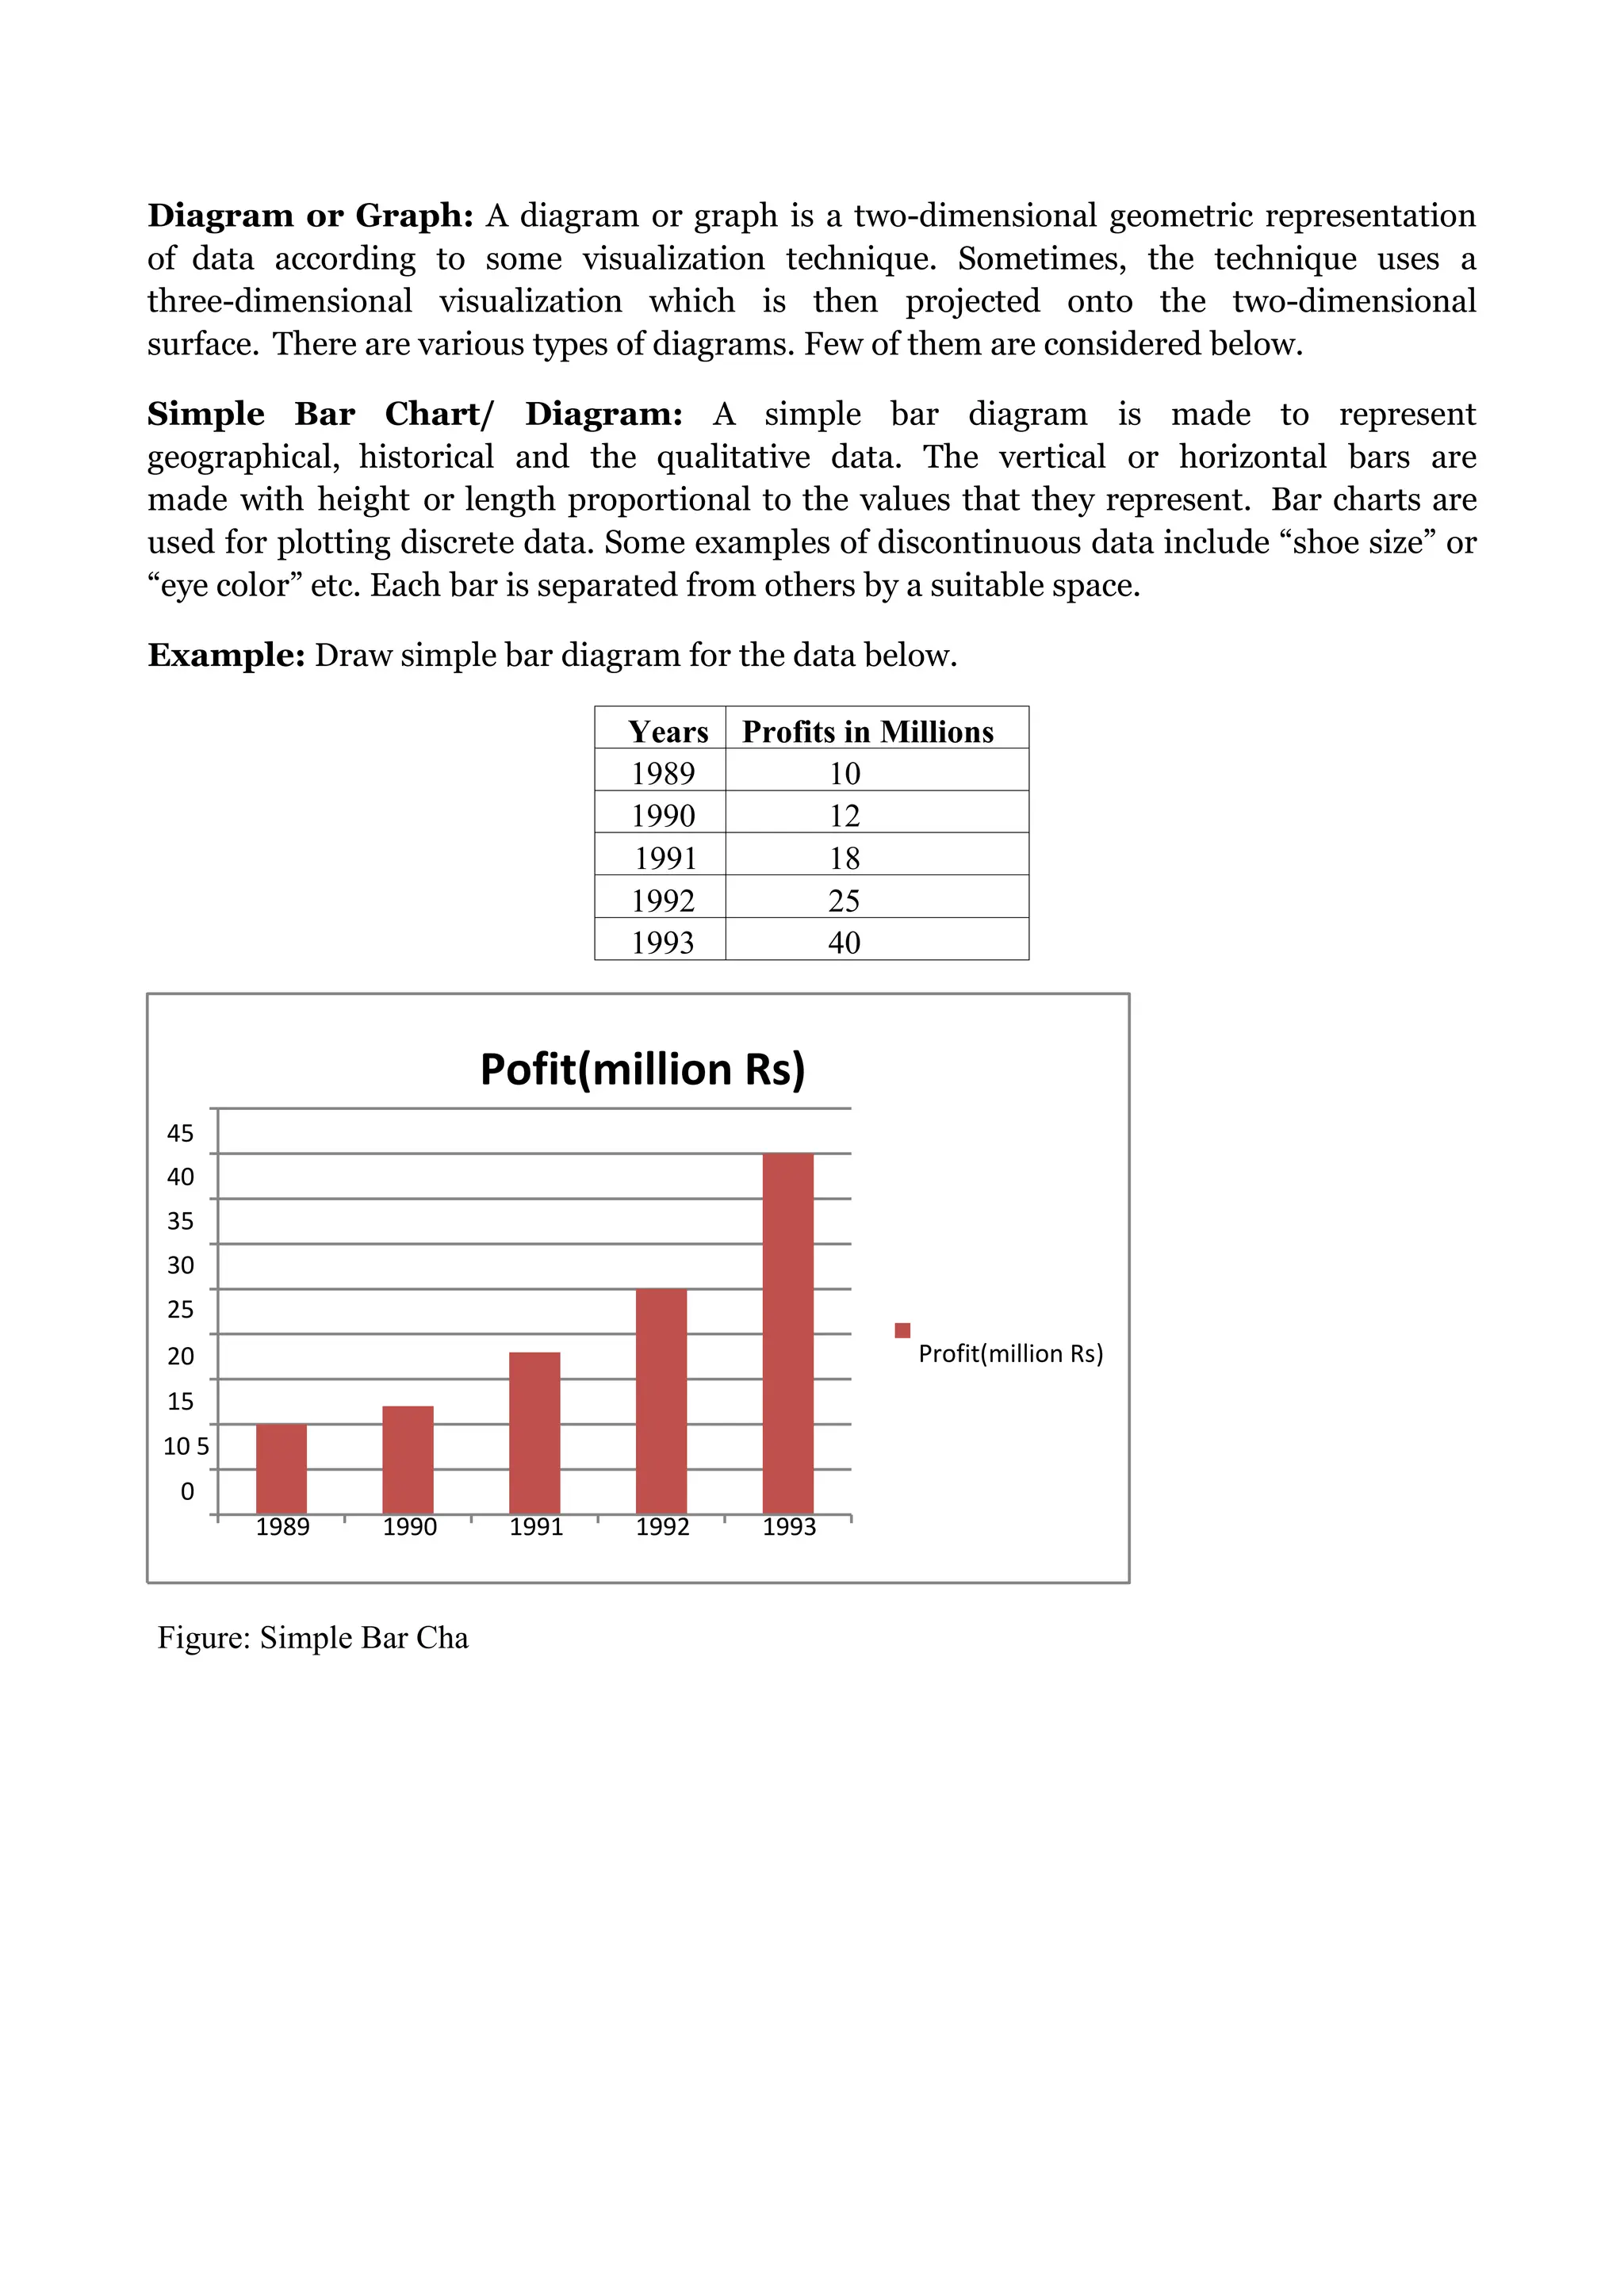
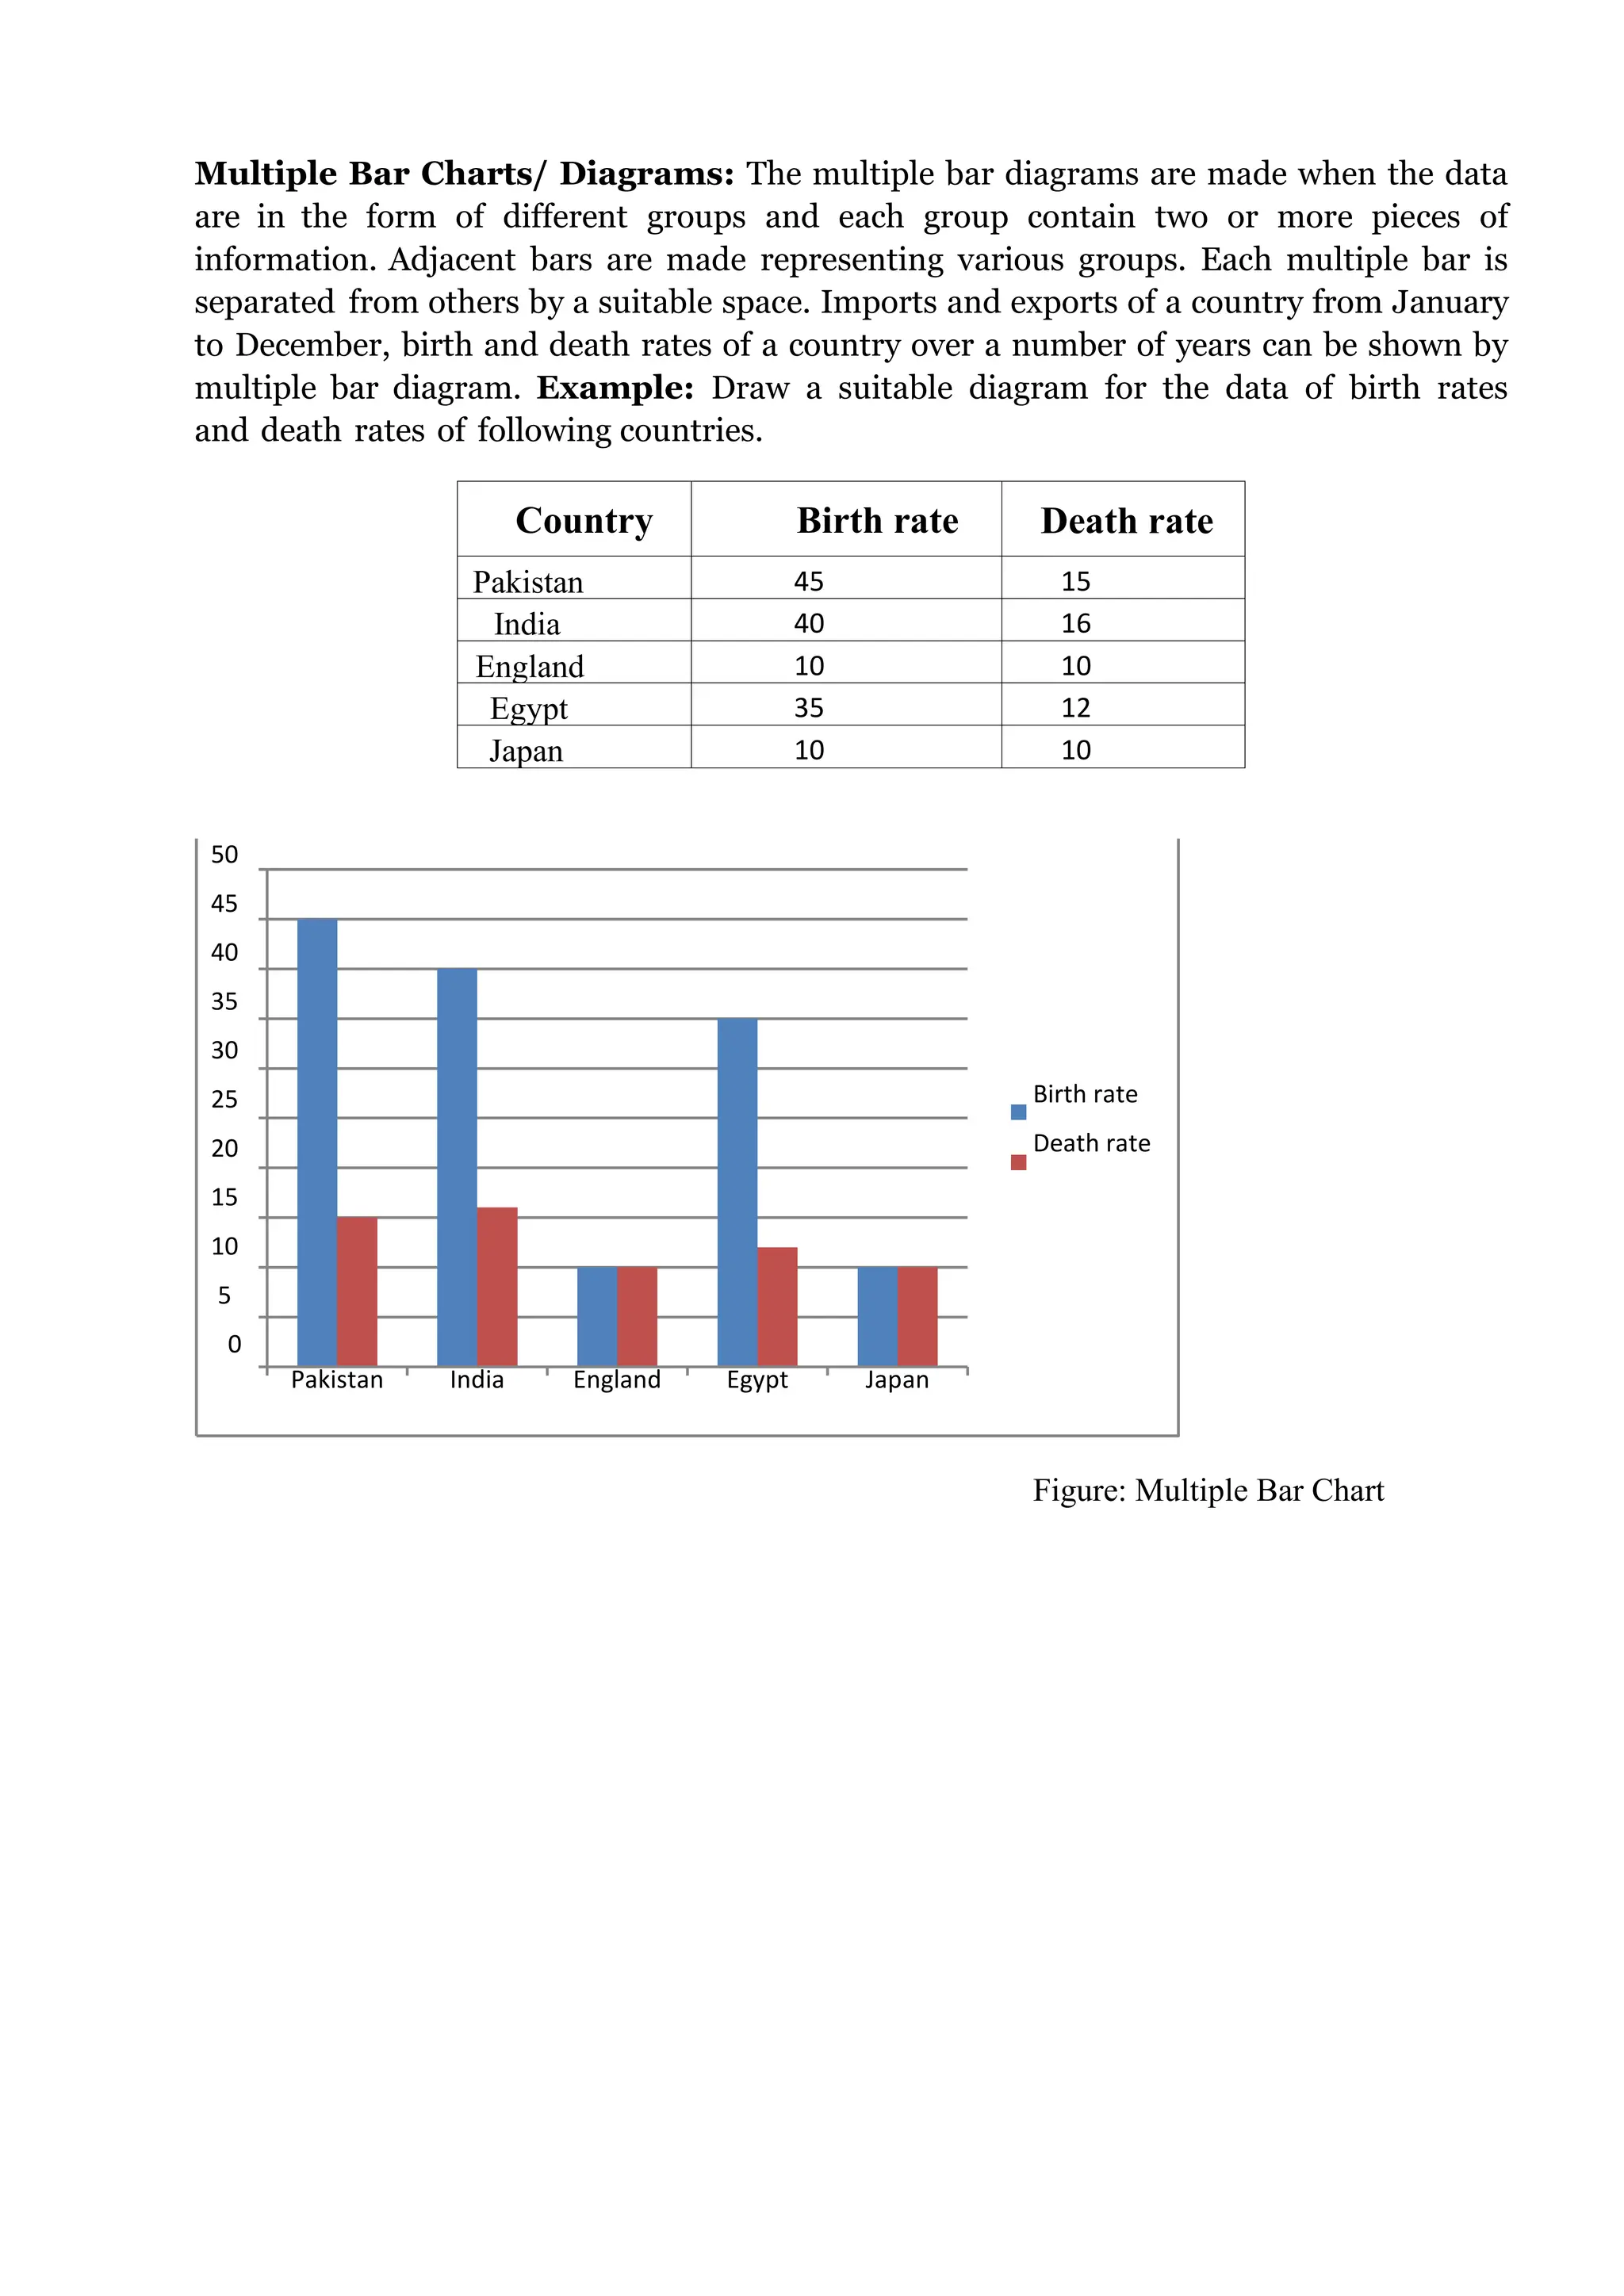
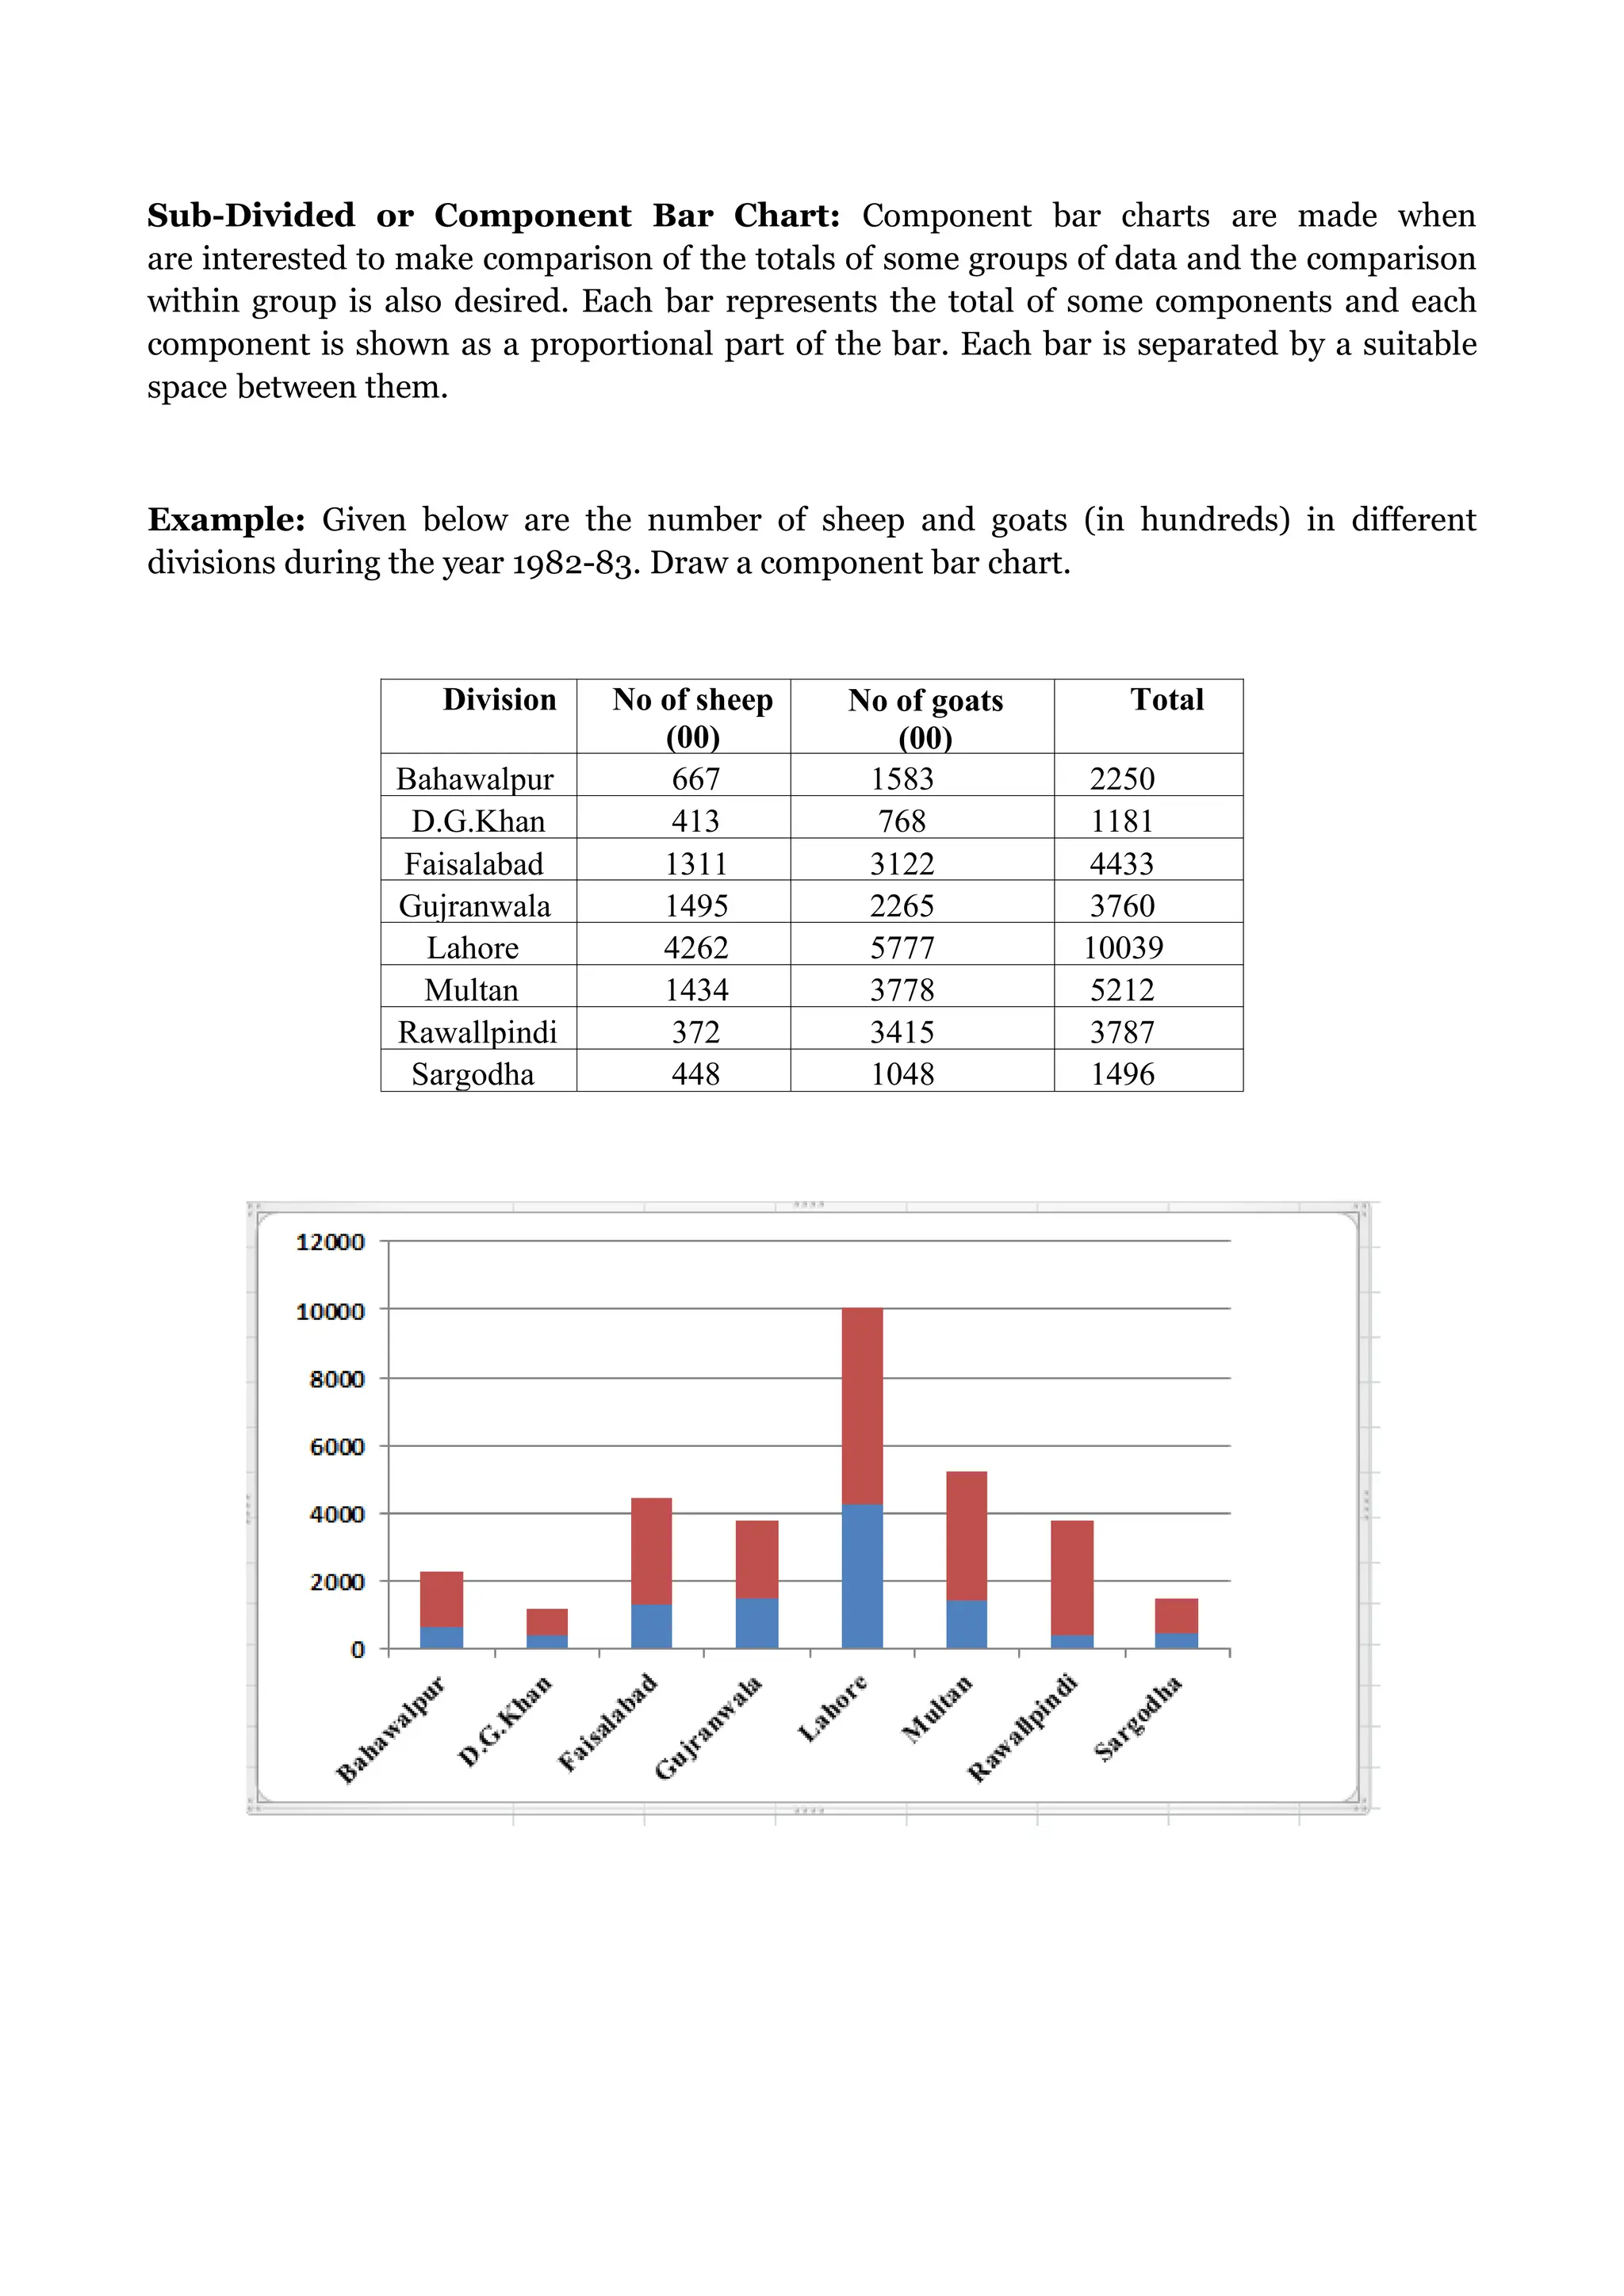
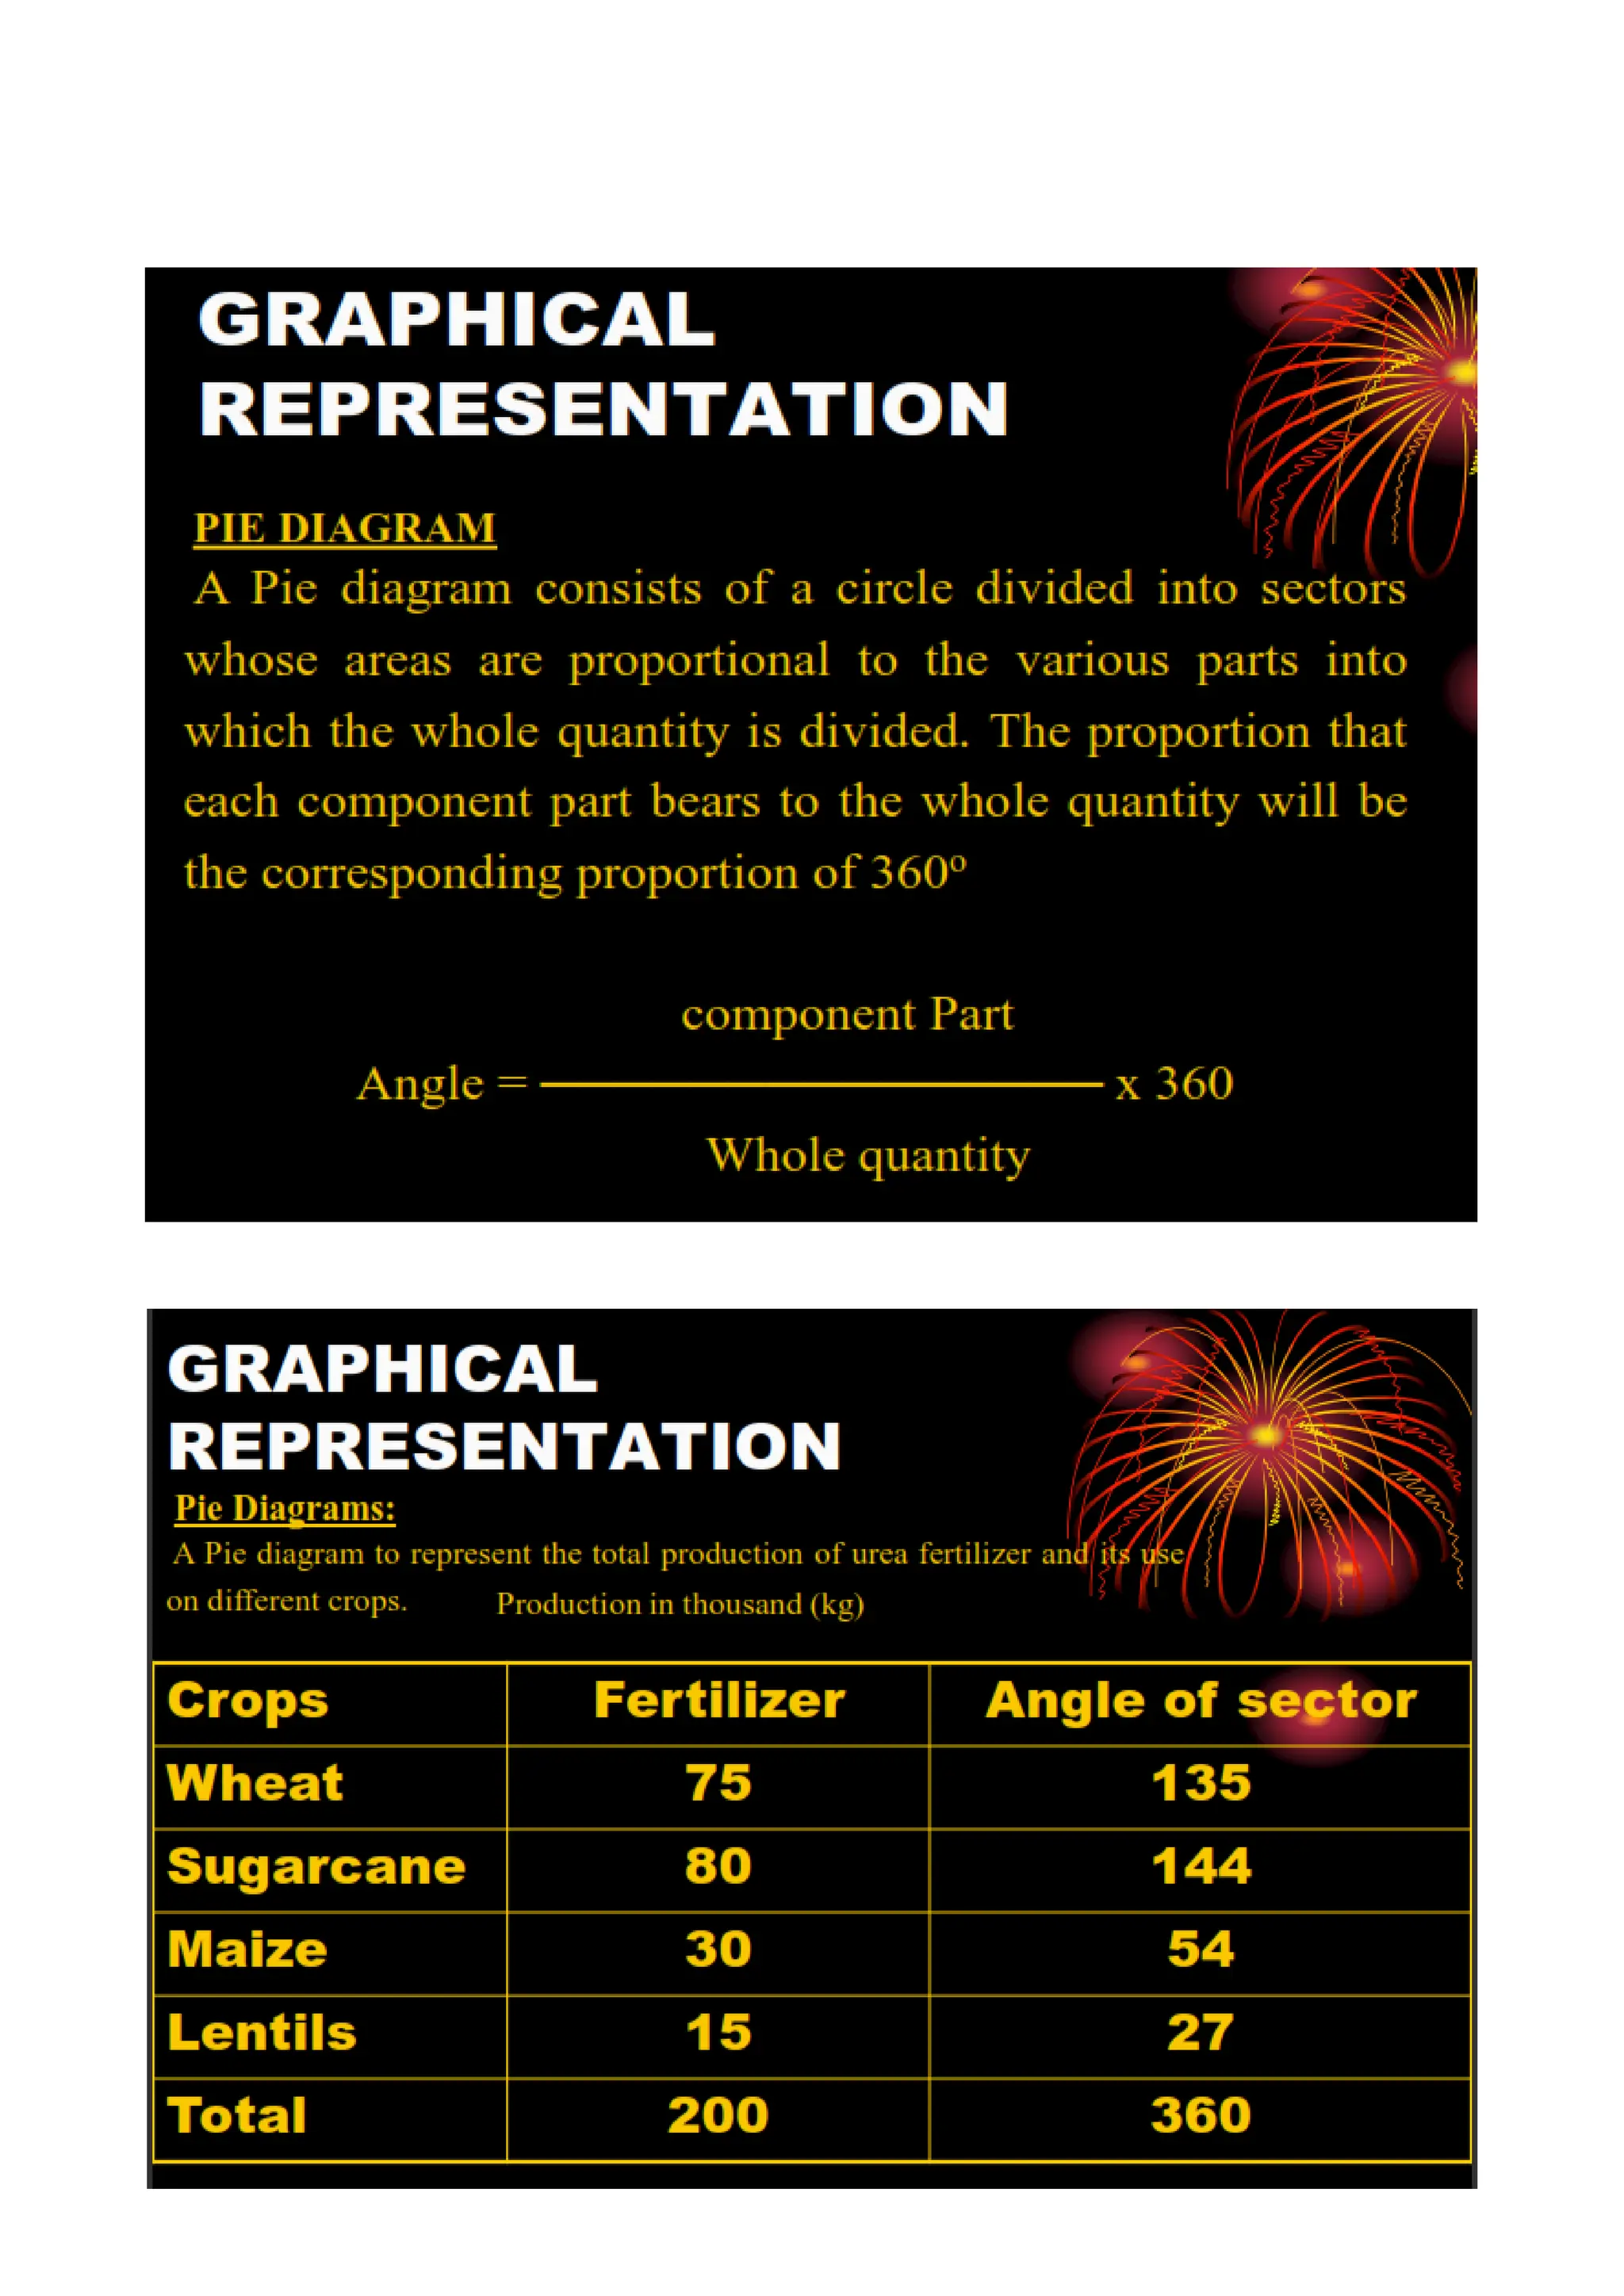
The document discusses various methods for presenting statistical data, highlighting the use of diagrams and graphs as more visually appealing alternatives to numeric tables. It describes different types of bar charts, including simple, multiple, and component bar charts, each suited for different types of data representation. Examples provided include data for profits, birth and death rates, and animal populations to illustrate the application of these chart types.