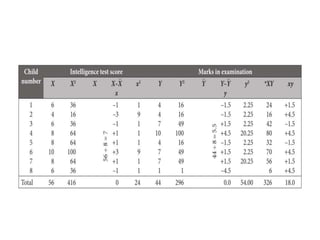
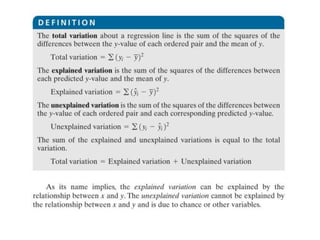
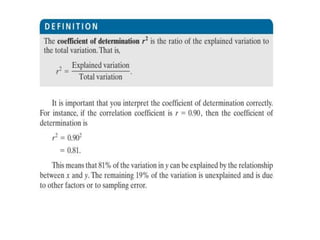
Program: Pharm-D 4th
Semester: II (2019-20)
Course: Bio-Statistics
Course code: PHAR-03428
Class Teacher: DR. LIAQUAT AHMAD
email: liaquatahmad@uvas.edu.pk
Lecture # 25-27
Simple Regression Definition
A regression model is a mathematical
equation that describes the relationship
between two or more variables. A
simple regression model includes only
two variables: one independent and one
dependent. The dependent variable is
the one being explained, and the
independent variable is the one used to
explain the variation in the dependent
variable.
Linear Regression Definition
Simple regression model that gives a straight-line
relationship between two variables is called a linear
regression model.
For example the relationship between food
expenditure (dependent variable) and income
(independent variable)
There is a relationship between CGPA and the time
to study.
Linear means straight line
Multiple Regression
Multiple regression analysis is a straight forward
extension of simple regression analysis which
allows more than one independent variable.
OR
When we are considering the relationship
between one dependent variable and more than
one independent variable, we use Multiple
Regression.
Calculate regression line for the following data using
reticulocytes (x) and lymphocytes (Y). Also calculate
standard error of estimate and r2.
Linear Regression Model
The regression model is
y = a + bx + Є,
a is called the y-intercept or constant term, b is
the slope, and Є is the random error term. The
dependent and independent variables are y and x,
respectively.
SIMPLE LINEAR REGRESSION
ANALYSIS
y = a + bx
Y - is the dependent variable
a is the constant term known as intercept
B is slope of the line or the regression coefficient
x – is the independent variable
SIMPLE LINEAR REGRESSION
ANALYSIS
In the model
ŷ = a + bx,
a and b, which are calculated using sample data,
are called the estimates of a and b
=
Purpose of Simple Linear Regression
The purpose of simple linear regression analysis
is to answer three questions :
Is there a relationship between the two variables?
How strong is the relationship (e.g. trivial, weak,
or strong)?
What is the direction of the relationship (high
scores are predictive of high or low scores)?
Interpreting the Regression
Equation: the Intercept
The intercept is the point on the vertical axis
where the regression line crosses the axis. It is
the predicted value for the dependent variable
when the independent variable has a value of
zero. This may or may not be useful information
depending on the context of the problem.
Interpreting the Regression
Equation: the Slope
The slope is interpreted as the amount of change in
the predicted value of the dependent variable
associated with a one unit change in the value of the
independent variable. If the slope has a negative
sign, the direction of the relationship is negative or
inverse, meaning that the scores on the two
variables move in opposite directions. If the slope
has a positive sign, the direction of the relationship
is positive or direct, meaning that the scores on the
two variables move in the same direction.
Example
Using X as the independent and Y the dependent variable
Interpretation of a and b cont.
Interpretation of b
The value of b in the regression model gives the
change in y due to change of one unit in x
We can state that, on average, a 1 increase in age
of a person will increase the weight by
Weight = 4.675 + 0.92 (1)
= 5.595
Interpreting the Regression
Equation: the Slope equals 0
If there is no relationship between two variables,
the slope of the regression line is zero and the
regression line is parallel to the horizontal axis.
A slope of zero means that the predicted value of
the dependent variable will not change, no matter
what value of the independent variable is used.
Error Sum of Squares (SSE)
The error sum of squares, denoted SSE, is
the values of a and b that give the minimum SSE
are called the least square estimates of A and B,
and the regression line obtained with these
estimates is called the least square line.
the least squares regression line ŷ = a + bx
Standard Deviation of Regression Line
or Standard error of estimate
Standard Error of estimate
COEFFICIENT OF DETERMINATION
The coefficient of determination, denoted by r2,
represents the proportion of SST that is
explained by the use of the regression model.
The computational formula for r2 is and 0 ≤ r2 ≤
1
Example # 2
Statistics

Simple Linear Regression explanation.pptx

  • 1.
    Program: Pharm-D 4th Semester:II (2019-20) Course: Bio-Statistics Course code: PHAR-03428 Class Teacher: DR. LIAQUAT AHMAD email: liaquatahmad@uvas.edu.pk Lecture # 25-27
  • 2.
    Simple Regression Definition Aregression model is a mathematical equation that describes the relationship between two or more variables. A simple regression model includes only two variables: one independent and one dependent. The dependent variable is the one being explained, and the independent variable is the one used to explain the variation in the dependent variable.
  • 3.
    Linear Regression Definition Simpleregression model that gives a straight-line relationship between two variables is called a linear regression model. For example the relationship between food expenditure (dependent variable) and income (independent variable) There is a relationship between CGPA and the time to study. Linear means straight line
  • 4.
    Multiple Regression Multiple regressionanalysis is a straight forward extension of simple regression analysis which allows more than one independent variable. OR When we are considering the relationship between one dependent variable and more than one independent variable, we use Multiple Regression.
  • 7.
    Calculate regression linefor the following data using reticulocytes (x) and lymphocytes (Y). Also calculate standard error of estimate and r2.
  • 8.
    Linear Regression Model Theregression model is y = a + bx + Є, a is called the y-intercept or constant term, b is the slope, and Є is the random error term. The dependent and independent variables are y and x, respectively.
  • 9.
    SIMPLE LINEAR REGRESSION ANALYSIS y= a + bx Y - is the dependent variable a is the constant term known as intercept B is slope of the line or the regression coefficient x – is the independent variable
  • 10.
    SIMPLE LINEAR REGRESSION ANALYSIS Inthe model ŷ = a + bx, a and b, which are calculated using sample data, are called the estimates of a and b =
  • 13.
    Purpose of SimpleLinear Regression The purpose of simple linear regression analysis is to answer three questions : Is there a relationship between the two variables? How strong is the relationship (e.g. trivial, weak, or strong)? What is the direction of the relationship (high scores are predictive of high or low scores)?
  • 14.
    Interpreting the Regression Equation:the Intercept The intercept is the point on the vertical axis where the regression line crosses the axis. It is the predicted value for the dependent variable when the independent variable has a value of zero. This may or may not be useful information depending on the context of the problem.
  • 15.
    Interpreting the Regression Equation:the Slope The slope is interpreted as the amount of change in the predicted value of the dependent variable associated with a one unit change in the value of the independent variable. If the slope has a negative sign, the direction of the relationship is negative or inverse, meaning that the scores on the two variables move in opposite directions. If the slope has a positive sign, the direction of the relationship is positive or direct, meaning that the scores on the two variables move in the same direction.
  • 16.
    Example Using X asthe independent and Y the dependent variable
  • 20.
    Interpretation of aand b cont. Interpretation of b The value of b in the regression model gives the change in y due to change of one unit in x We can state that, on average, a 1 increase in age of a person will increase the weight by Weight = 4.675 + 0.92 (1) = 5.595
  • 21.
    Interpreting the Regression Equation:the Slope equals 0 If there is no relationship between two variables, the slope of the regression line is zero and the regression line is parallel to the horizontal axis. A slope of zero means that the predicted value of the dependent variable will not change, no matter what value of the independent variable is used.
  • 22.
    Error Sum ofSquares (SSE) The error sum of squares, denoted SSE, is the values of a and b that give the minimum SSE are called the least square estimates of A and B, and the regression line obtained with these estimates is called the least square line. the least squares regression line ŷ = a + bx
  • 23.
    Standard Deviation ofRegression Line or Standard error of estimate
  • 25.
  • 26.
    COEFFICIENT OF DETERMINATION Thecoefficient of determination, denoted by r2, represents the proportion of SST that is explained by the use of the regression model. The computational formula for r2 is and 0 ≤ r2 ≤ 1
  • 29.
  • 31.