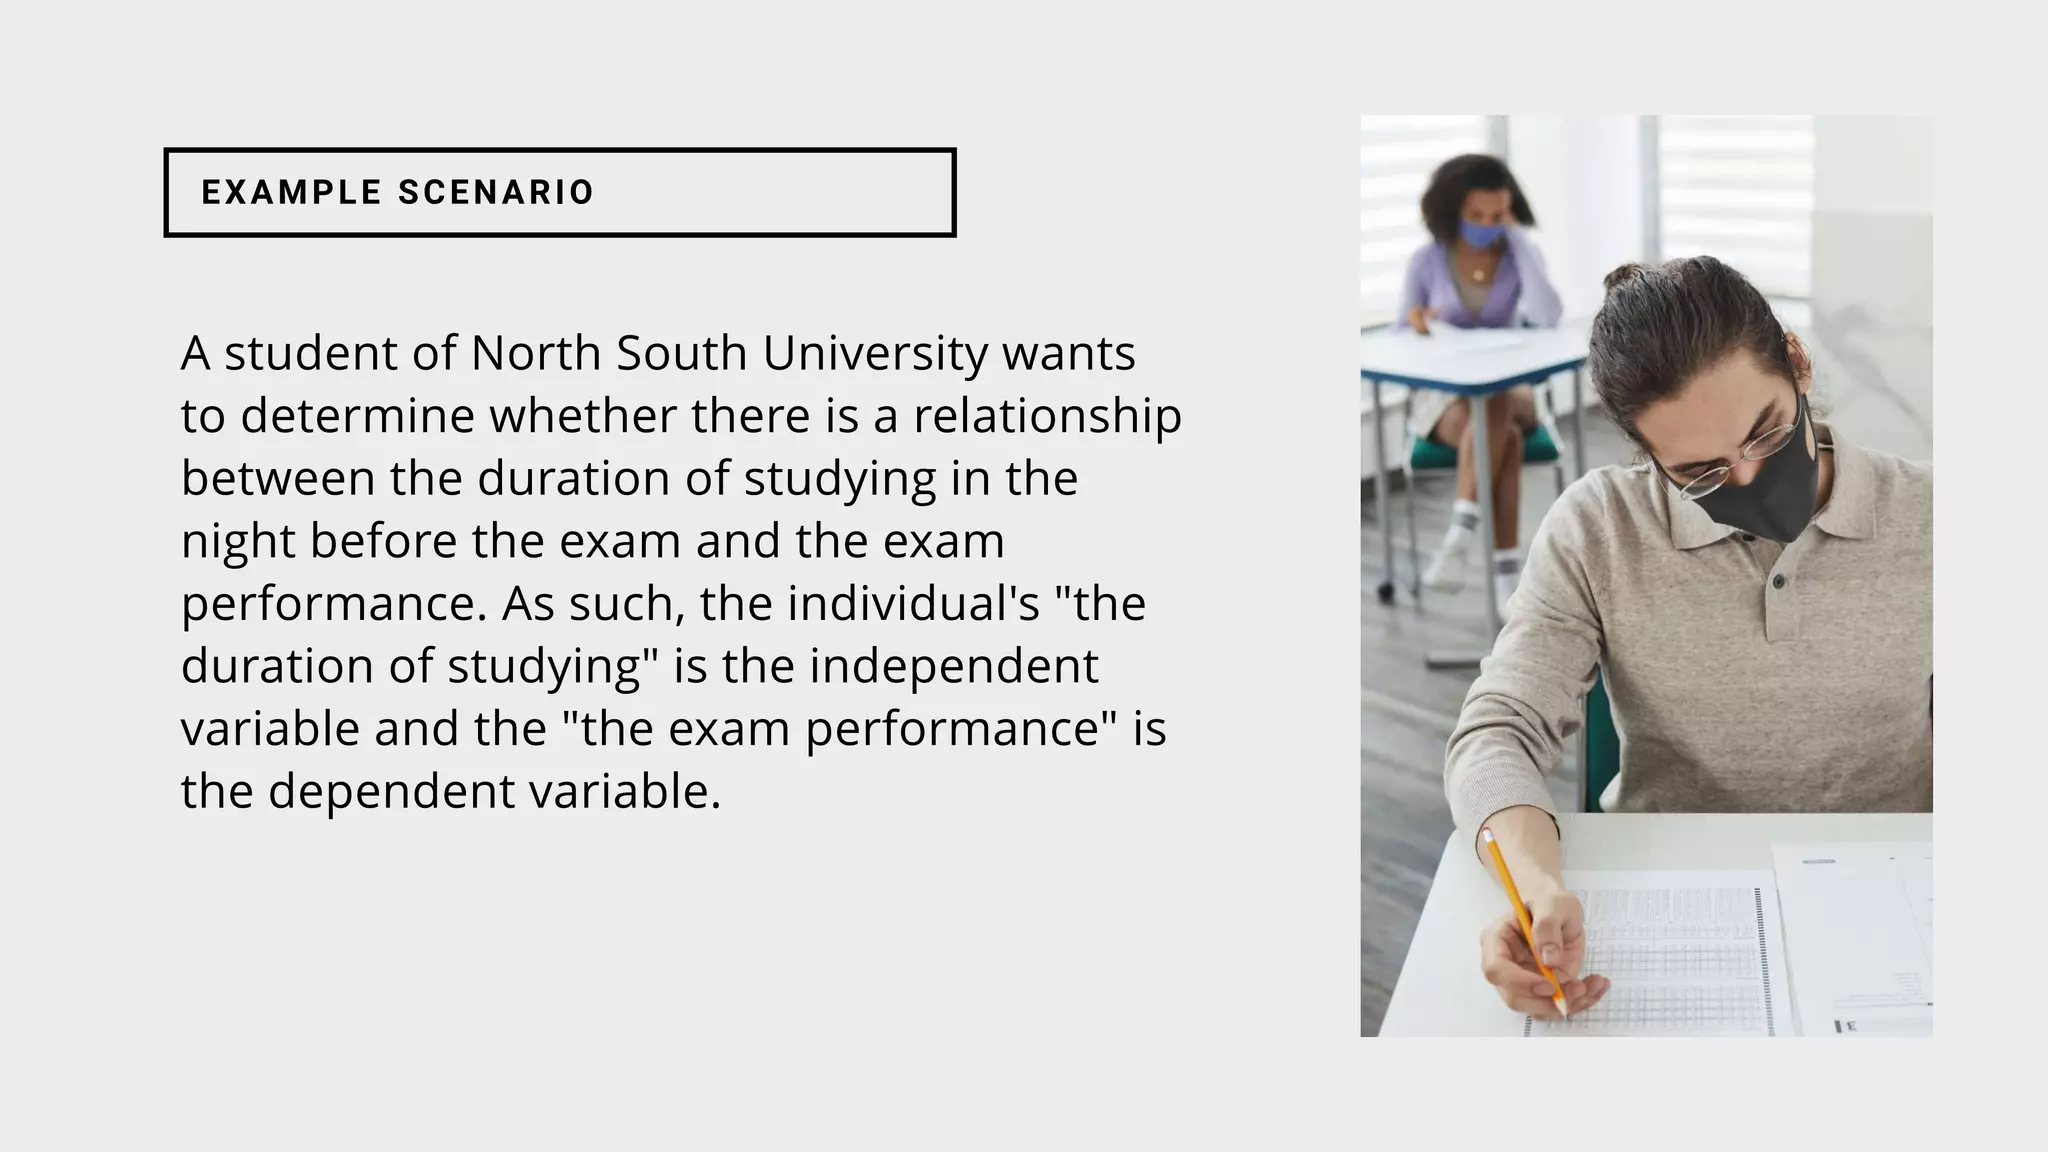
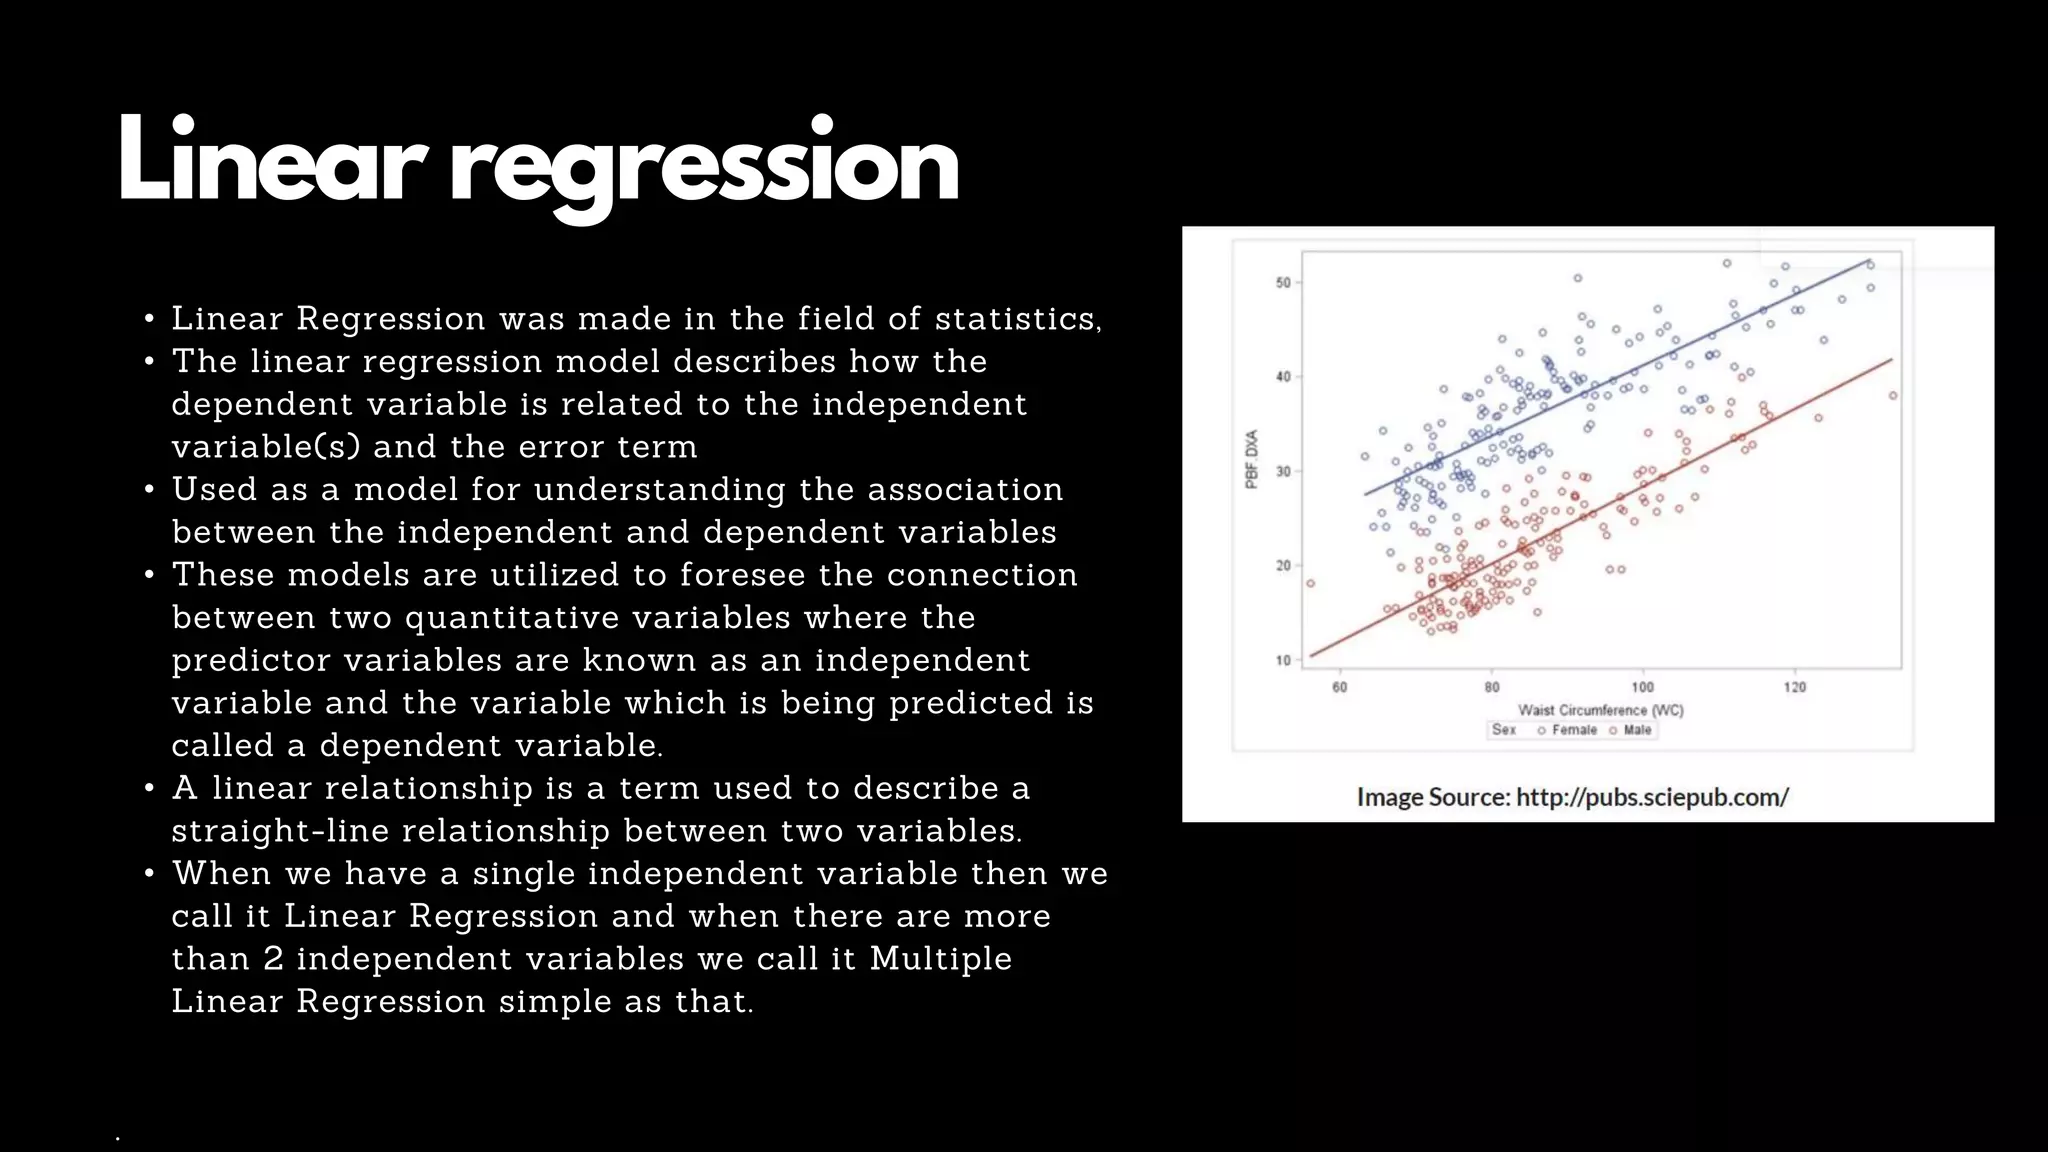
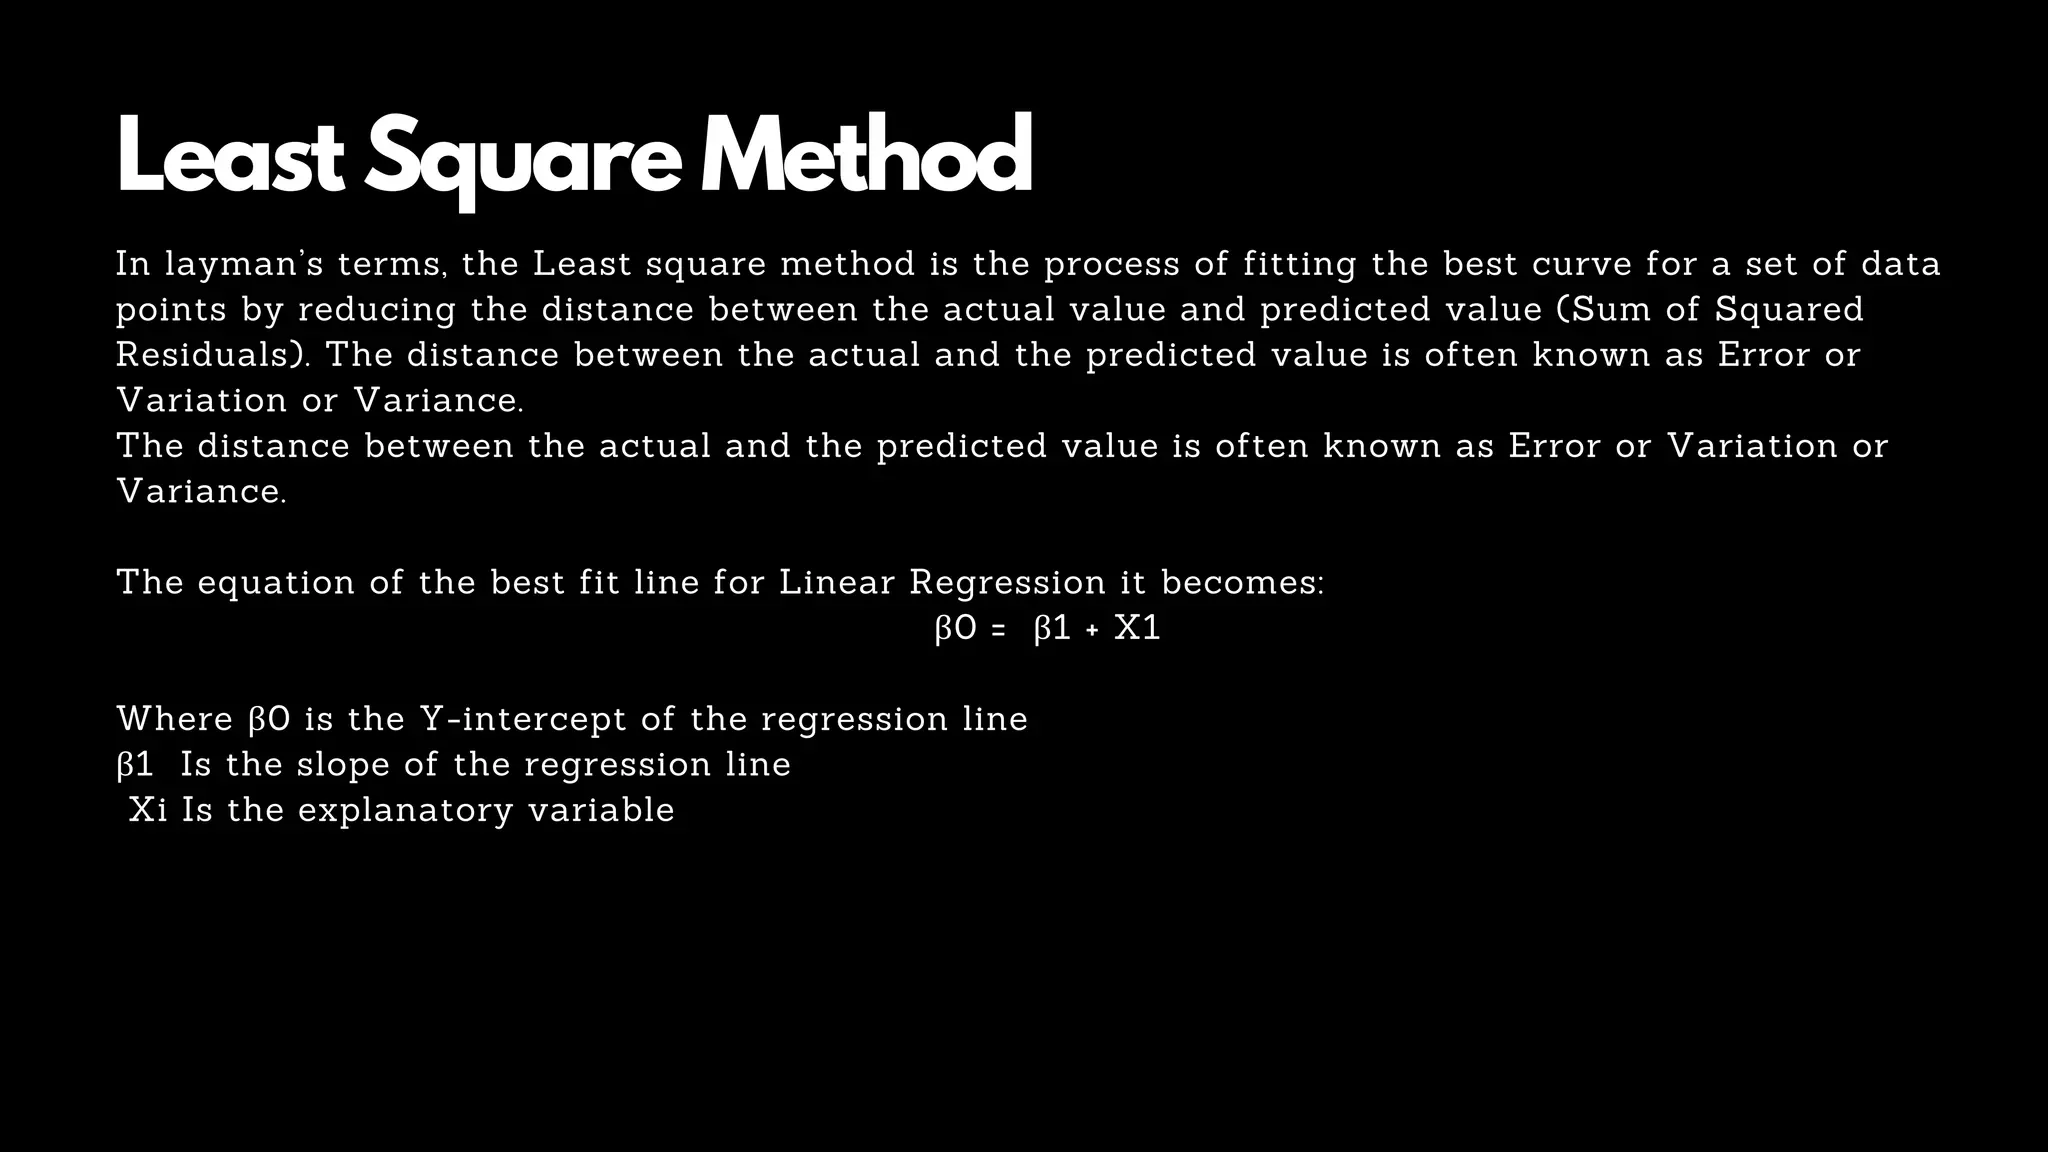
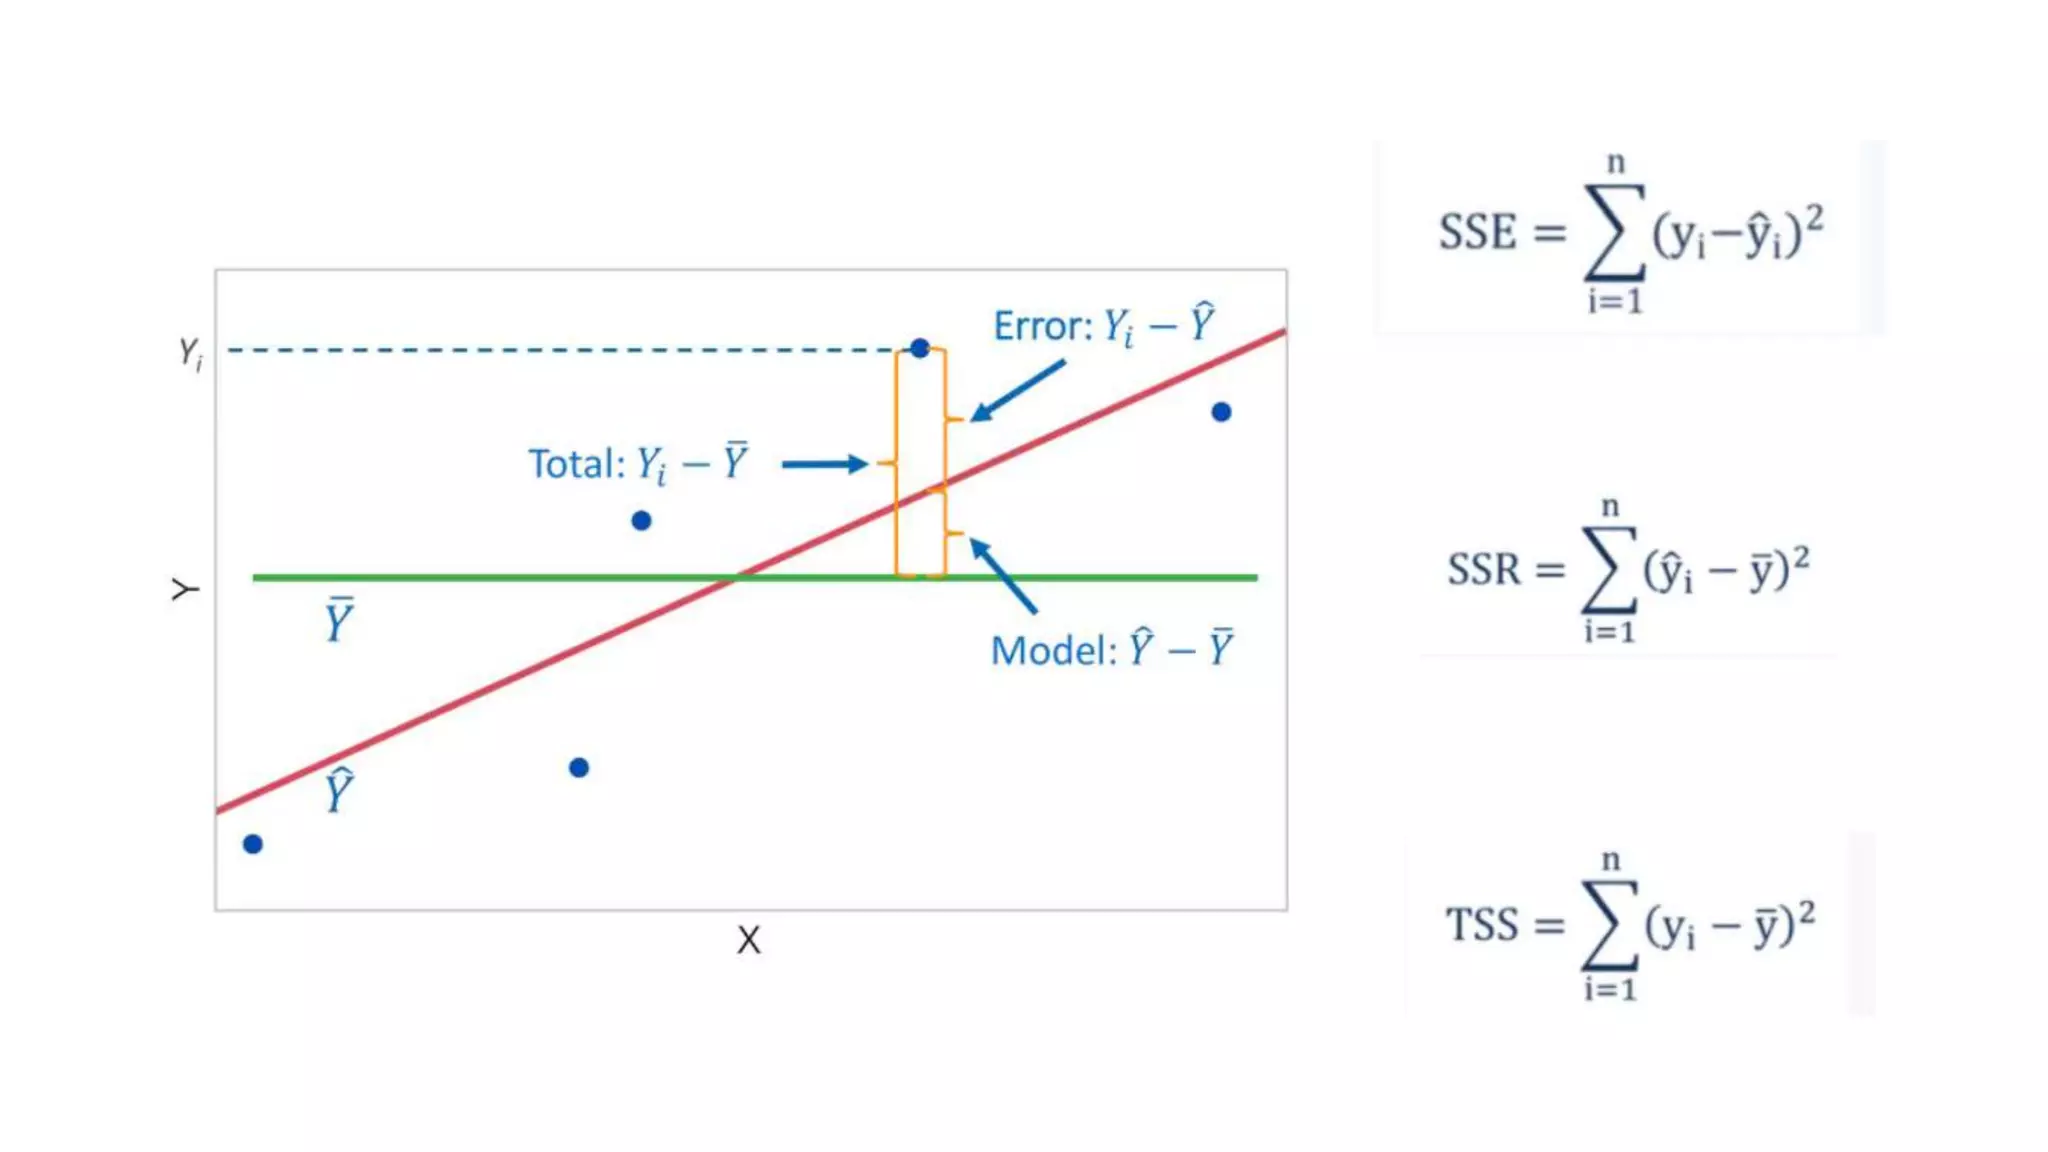
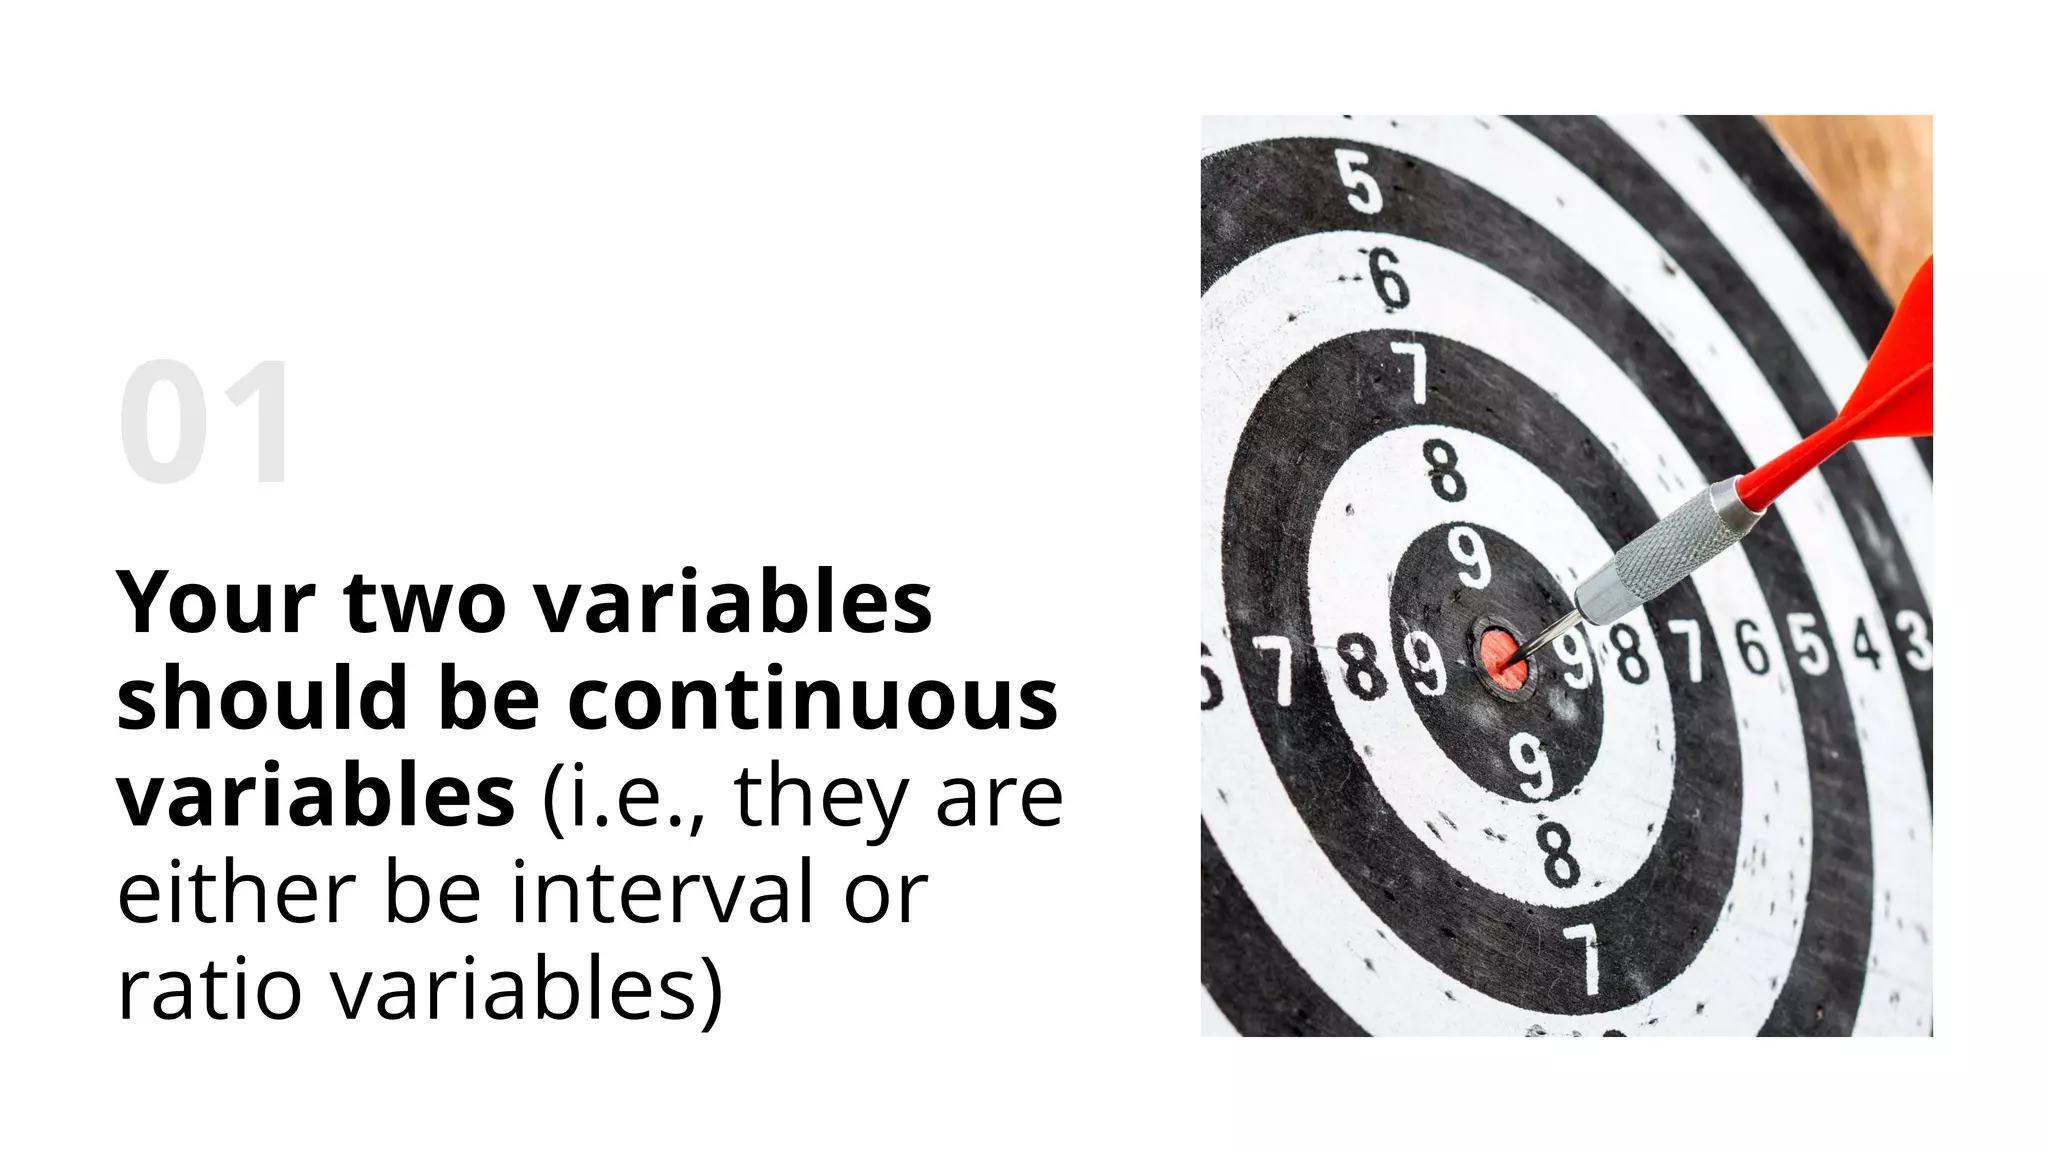
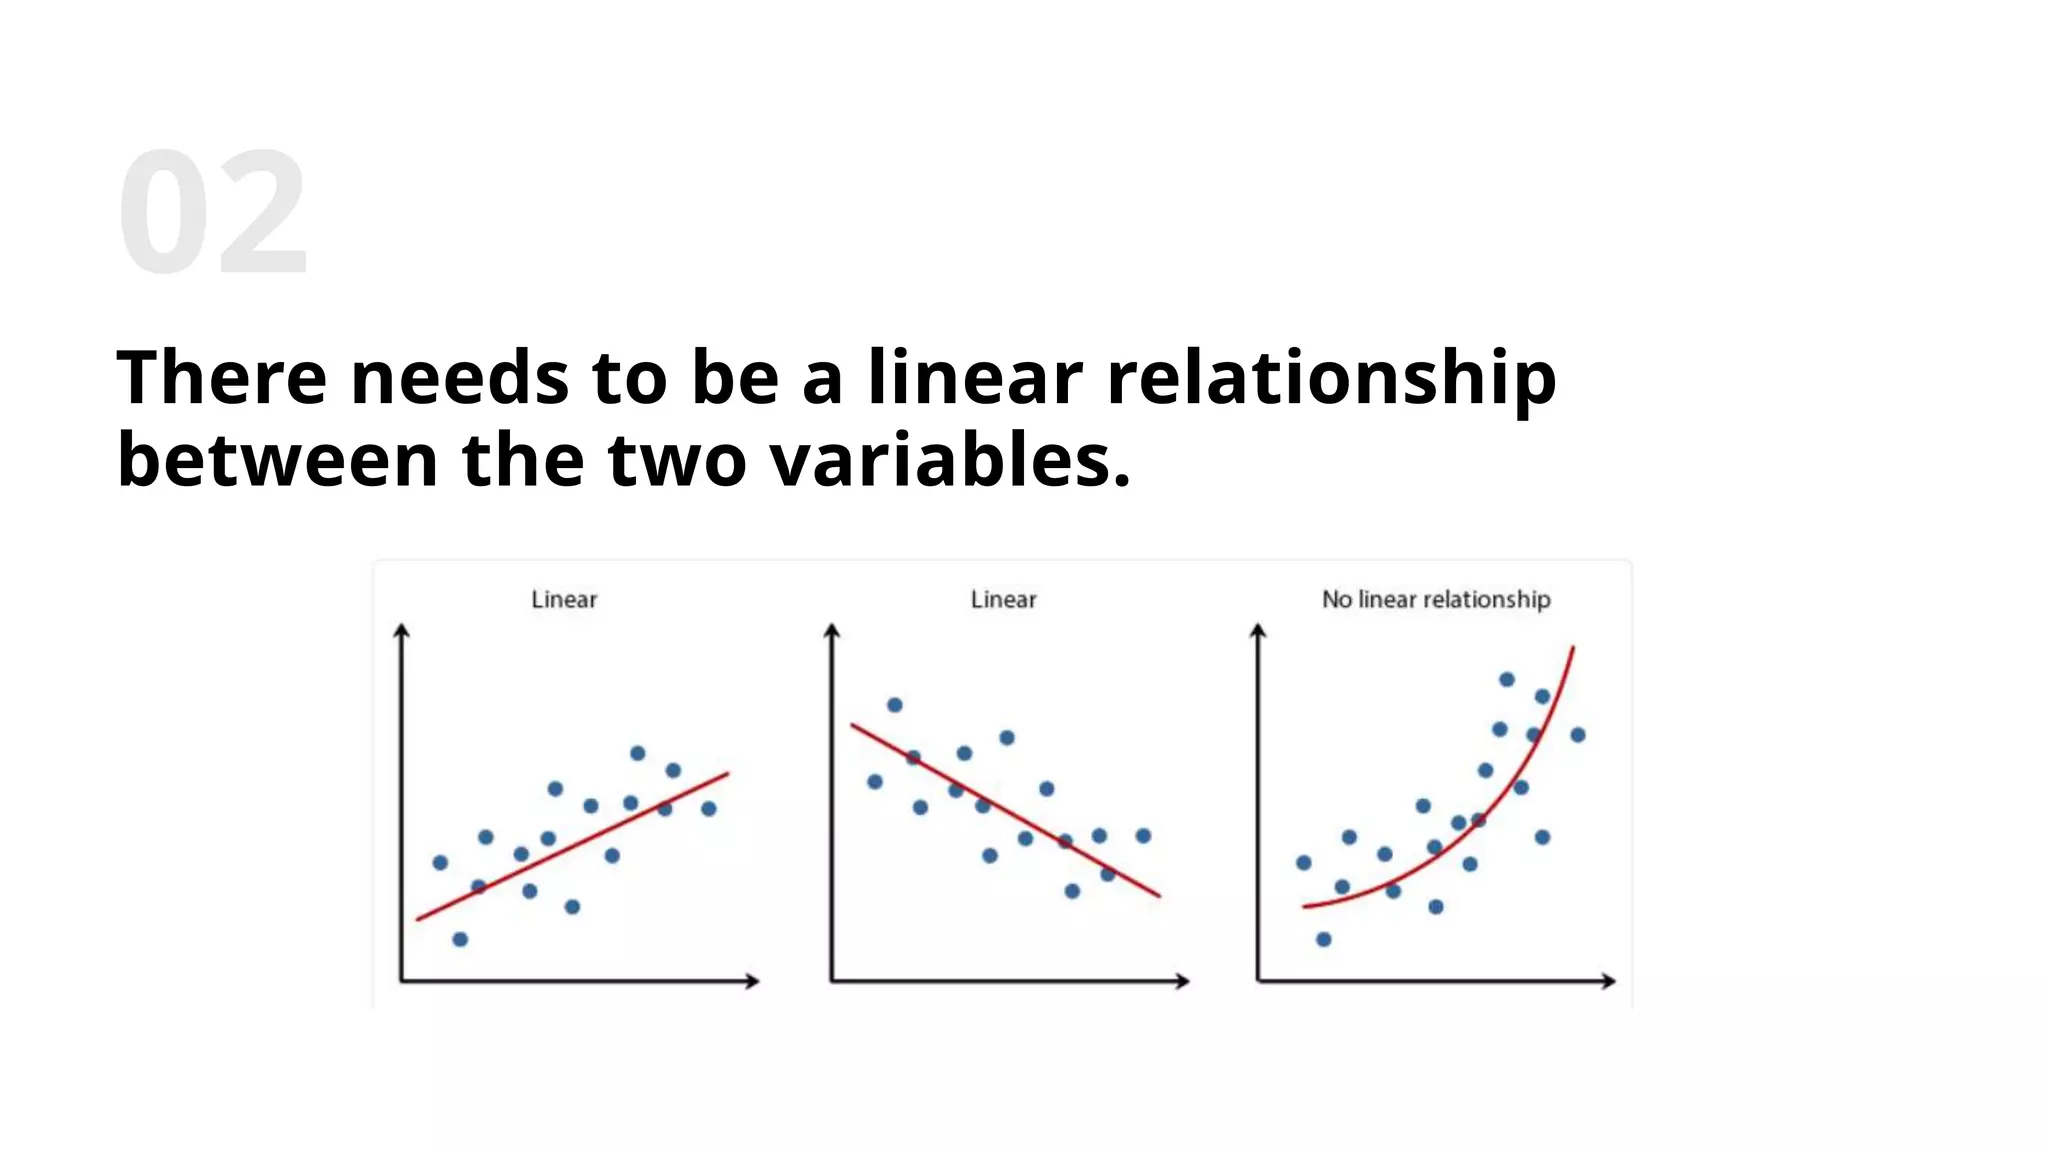
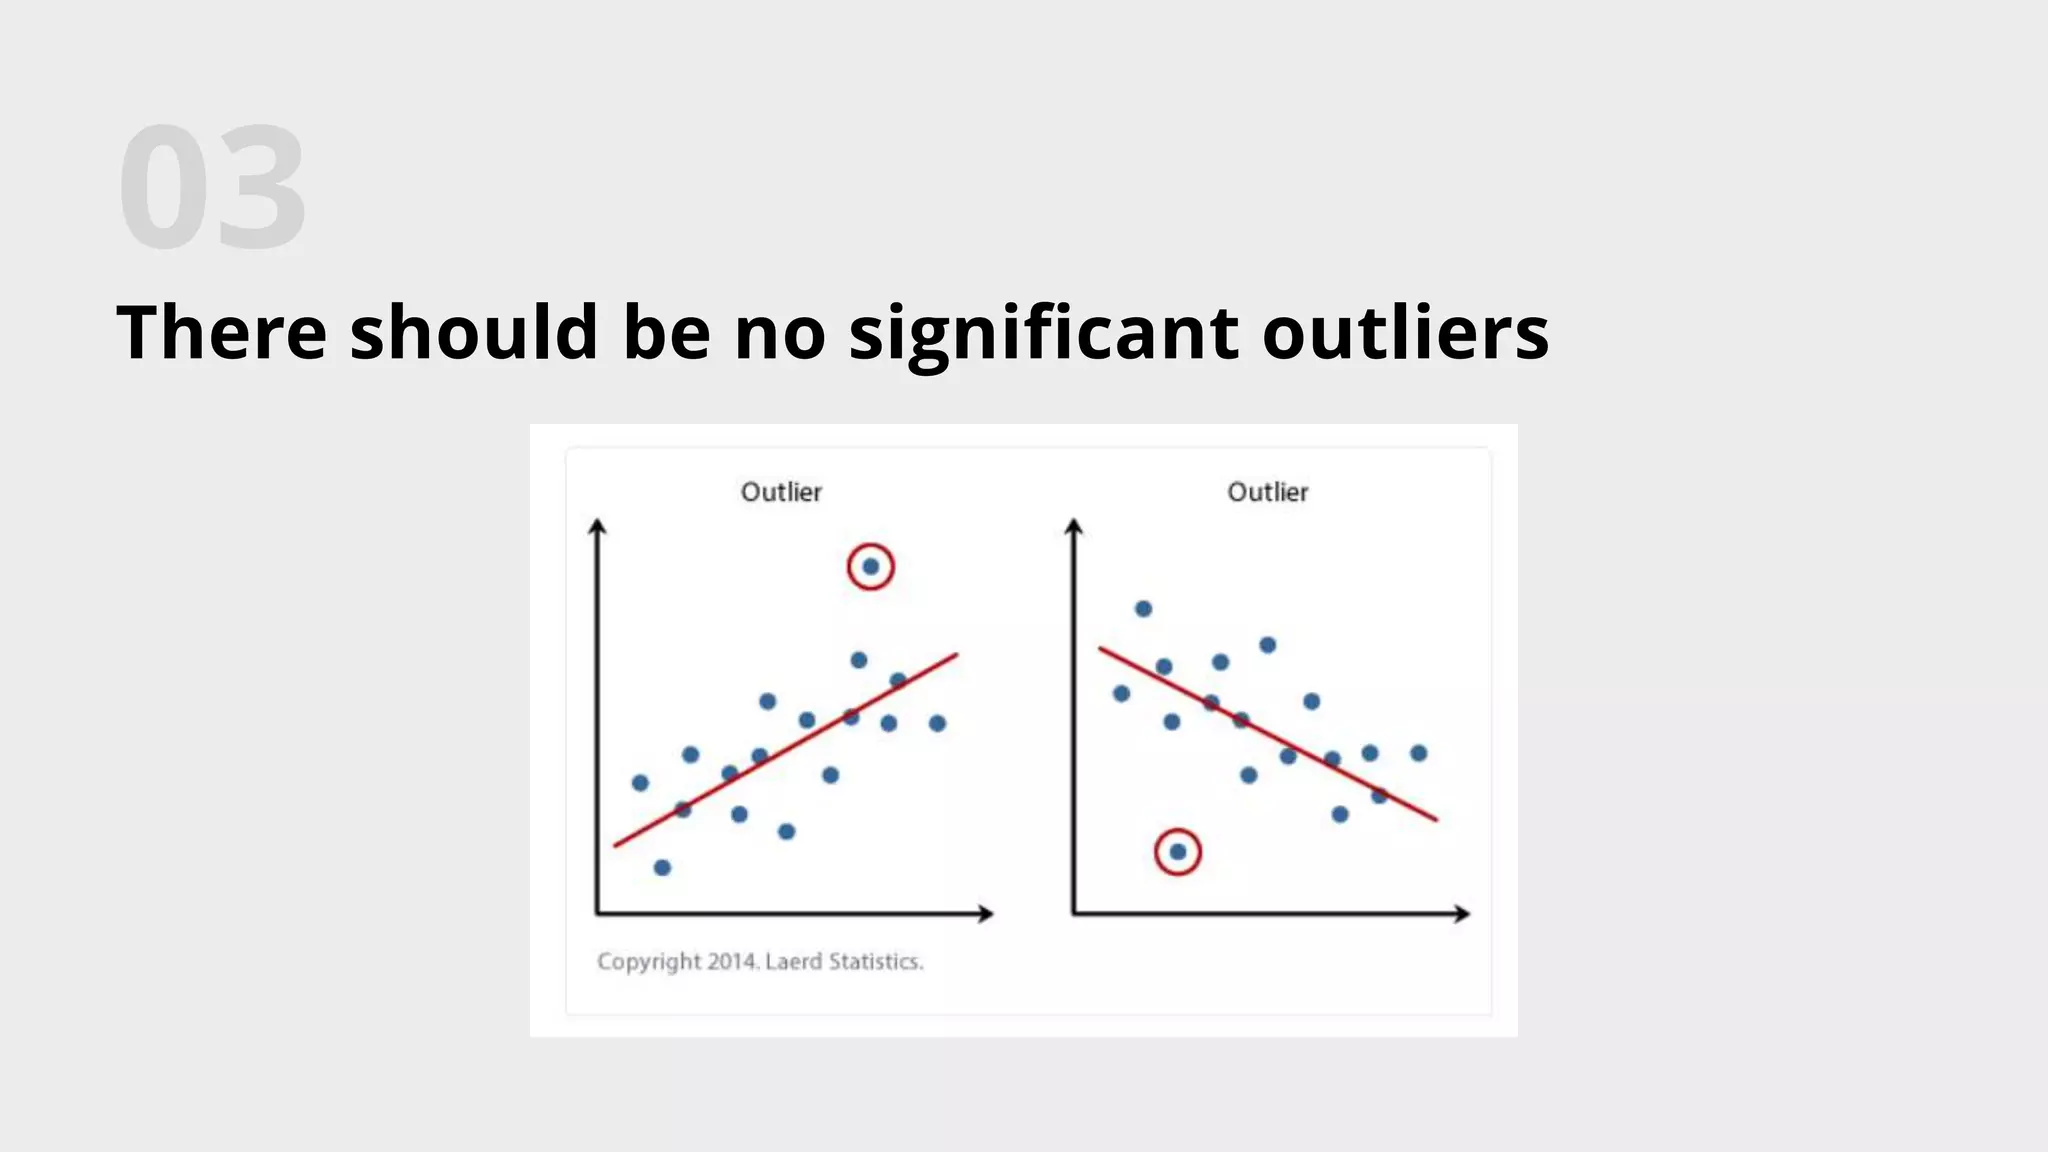
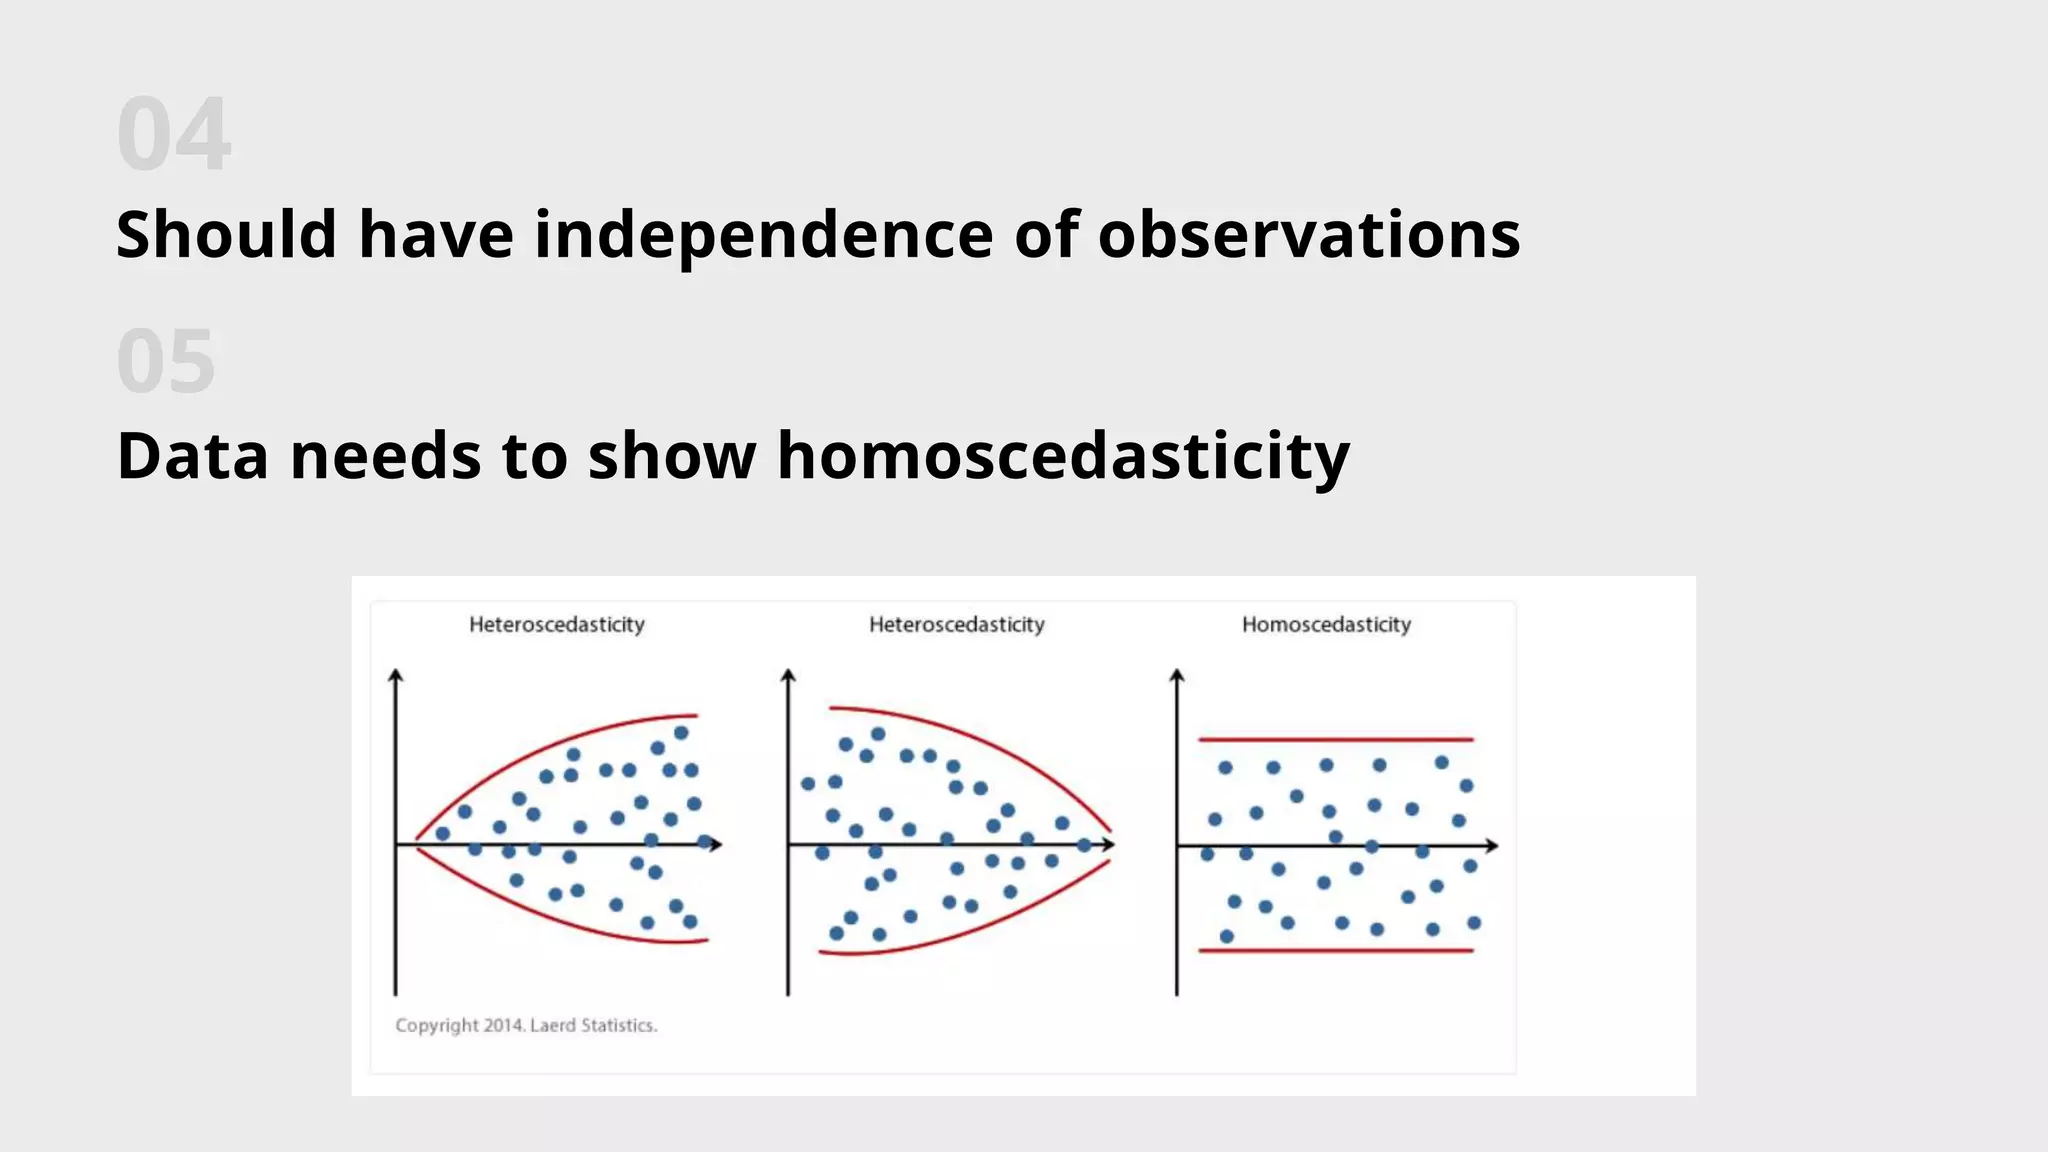
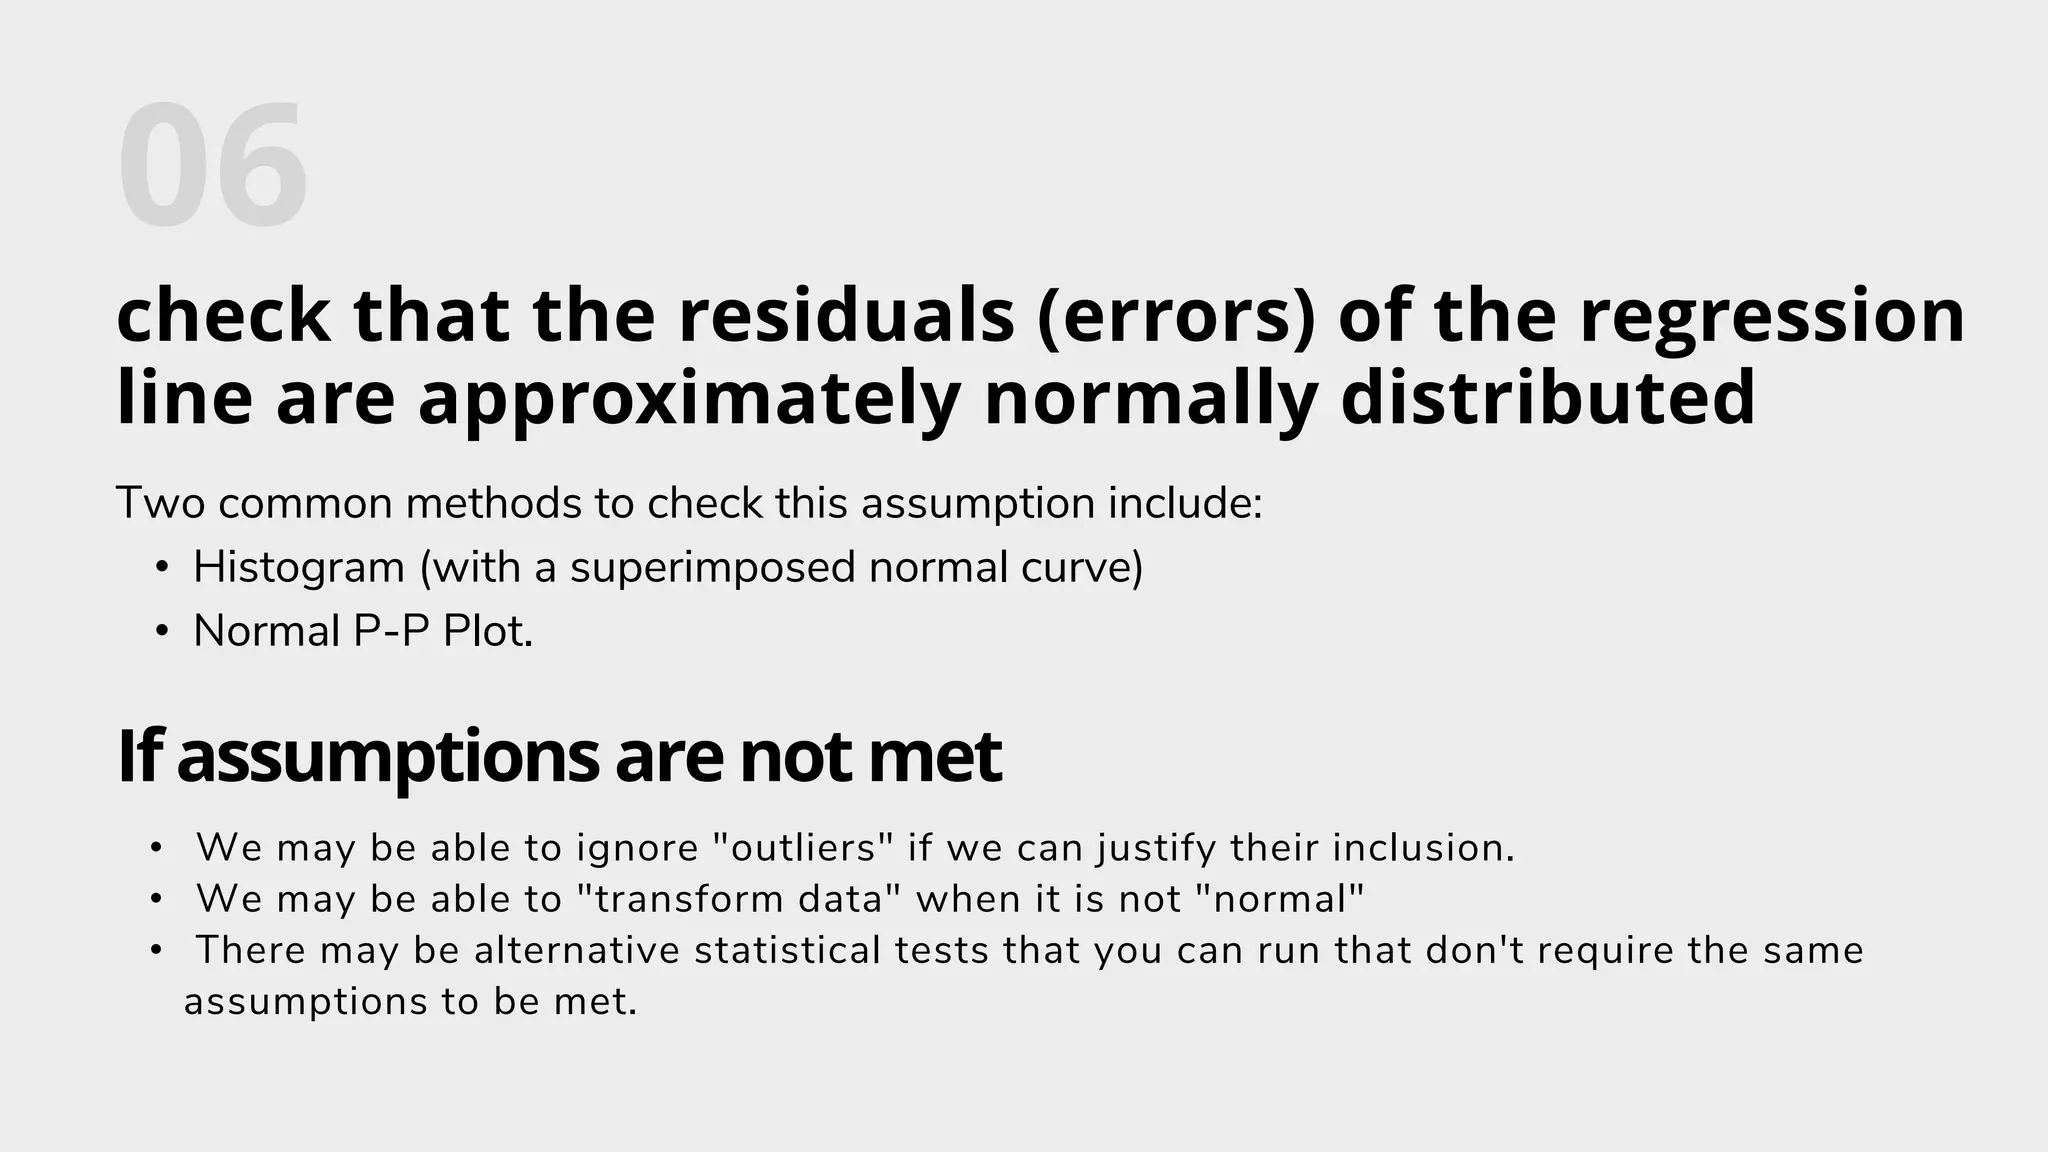
Presented By:
Dr. Nur Tasmia Taharat
Dr. Anika Naziat Mazumdar
Dr. Aktar Jahan Priya
How to select the appropriate
method for our study of Interest?
Assigned By:
Azaz Bin Sharif
Assistant Professor, Full Time Faculty
North South University
EXAMPLE SCENARIO
A student of North South University wants
to determine whether there is a relationship
between the duration of studying in the
night before the exam and the exam
performance. As such, the individual's "the
duration of studying" is the independent
variable and the "the exam performance" is
the dependent variable.
What kind of method we will
use for this Scenario?
LINEAR REGRESSION?
Linear regression
• Linear Regression was made in the field of statistics,
• The linear regression model describes how the
dependent variable is related to the independent
variable(s) and the error term
• Used as a model for understanding the association
between the independent and dependent variables
• These models are utilized to foresee the connection
between two quantitative variables where the
predictor variables are known as an independent
variable and the variable which is being predicted is
called a dependent variable.
• A linear relationship is a term used to describe a
straight-line relationship between two variables.
• When we have a single independent variable then we
call it Linear Regression and when there are more
than 2 independent variables we call it Multiple
Linear Regression simple as that.
.
What kind of relationship can a Linear Regression
show?
• Positive Relationship - The regression line between the two variables moves in the same direction
with an upward slope.
• Negative Relationship - The regression line between the two variables moves in the same direction
with a downward slope.
• No Relationship - The best fit line is flat (not sloped)
.
how do we know what kind of
relationship these variables have?
By using
• Correlation - tells us the direction of the relationship between X and Y but it doesn’t tell us how
positive or negative the relationship is.
• Covariance - tells us the direction of the relationship as well as the strength of the relationship
.
Least Square Method
In layman’s terms, the Least square method is the process of fitting the best curve for a set of data
points by reducing the distance between the actual value and predicted value (Sum of Squared
Residuals). The distance between the actual and the predicted value is often known as Error or
Variation or Variance.
The distance between the actual and the predicted value is often known as Error or Variation or
Variance.
The equation of the best fit line for Linear Regression it becomes:
β0 = β1 + X1
Where β0 is the Y-intercept of the regression line
β1 Is the slope of the regression line
Xi Is the explanatory variable
Your two variables
should be continuous
variables (i.e., they are
either be interval or
ratio variables)
There needs to be a linear relationship
between the two variables.
There should be no significant outliers
Should have independence of observations
Data needs to show homoscedasticity
check that the residuals (errors) of the regression
line are approximately normally distributed
Two common methods to check this assumption include:
• Histogram (with a superimposed normal curve)
• Normal P-P Plot.
If assumptions are not met
• We may be able to ignore "outliers" if we can justify their inclusion.
• We may be able to "transform data" when it is not "normal"
• There may be alternative statistical tests that you can run that don't require the same
assumptions to be met.
References
:
• https://statistics.laerd.com/features-assumptions.php
• https://www.analyticsvidhya.com/blog/2021/07/practical-applications-of-linear-
regression-models/
• https://statistics.laerd.com/spss-tutorials/linear-regression-using-spss-
statistics.php
• https://www.youtube.com/watch?v=NOVfLIyY_CA
• https://www.collegeraptor.com/find-colleges/articles/tips-tools-advice/choose-
right-research-topic-5-easy-steps/
• https://sites.google.com/site/econometricsacademy/econometrics-
models/linear-regression
For your time and patience

how to select the appropriate method for our study of interest

  • 1.
    Presented By: Dr. NurTasmia Taharat Dr. Anika Naziat Mazumdar Dr. Aktar Jahan Priya How to select the appropriate method for our study of Interest? Assigned By: Azaz Bin Sharif Assistant Professor, Full Time Faculty North South University
  • 2.
    EXAMPLE SCENARIO A studentof North South University wants to determine whether there is a relationship between the duration of studying in the night before the exam and the exam performance. As such, the individual's "the duration of studying" is the independent variable and the "the exam performance" is the dependent variable.
  • 3.
    What kind ofmethod we will use for this Scenario? LINEAR REGRESSION?
  • 4.
    Linear regression • LinearRegression was made in the field of statistics, • The linear regression model describes how the dependent variable is related to the independent variable(s) and the error term • Used as a model for understanding the association between the independent and dependent variables • These models are utilized to foresee the connection between two quantitative variables where the predictor variables are known as an independent variable and the variable which is being predicted is called a dependent variable. • A linear relationship is a term used to describe a straight-line relationship between two variables. • When we have a single independent variable then we call it Linear Regression and when there are more than 2 independent variables we call it Multiple Linear Regression simple as that. .
  • 5.
    What kind ofrelationship can a Linear Regression show? • Positive Relationship - The regression line between the two variables moves in the same direction with an upward slope. • Negative Relationship - The regression line between the two variables moves in the same direction with a downward slope. • No Relationship - The best fit line is flat (not sloped) .
  • 6.
    how do weknow what kind of relationship these variables have? By using • Correlation - tells us the direction of the relationship between X and Y but it doesn’t tell us how positive or negative the relationship is. • Covariance - tells us the direction of the relationship as well as the strength of the relationship .
  • 7.
    Least Square Method Inlayman’s terms, the Least square method is the process of fitting the best curve for a set of data points by reducing the distance between the actual value and predicted value (Sum of Squared Residuals). The distance between the actual and the predicted value is often known as Error or Variation or Variance. The distance between the actual and the predicted value is often known as Error or Variation or Variance. The equation of the best fit line for Linear Regression it becomes: β0 = β1 + X1 Where β0 is the Y-intercept of the regression line β1 Is the slope of the regression line Xi Is the explanatory variable
  • 9.
    Your two variables shouldbe continuous variables (i.e., they are either be interval or ratio variables)
  • 10.
    There needs tobe a linear relationship between the two variables.
  • 11.
    There should beno significant outliers
  • 12.
    Should have independenceof observations Data needs to show homoscedasticity
  • 13.
    check that theresiduals (errors) of the regression line are approximately normally distributed Two common methods to check this assumption include: • Histogram (with a superimposed normal curve) • Normal P-P Plot. If assumptions are not met • We may be able to ignore "outliers" if we can justify their inclusion. • We may be able to "transform data" when it is not "normal" • There may be alternative statistical tests that you can run that don't require the same assumptions to be met.
  • 14.
    References : • https://statistics.laerd.com/features-assumptions.php • https://www.analyticsvidhya.com/blog/2021/07/practical-applications-of-linear- regression-models/ •https://statistics.laerd.com/spss-tutorials/linear-regression-using-spss- statistics.php • https://www.youtube.com/watch?v=NOVfLIyY_CA • https://www.collegeraptor.com/find-colleges/articles/tips-tools-advice/choose- right-research-topic-5-easy-steps/ • https://sites.google.com/site/econometricsacademy/econometrics- models/linear-regression
  • 15.
    For your timeand patience