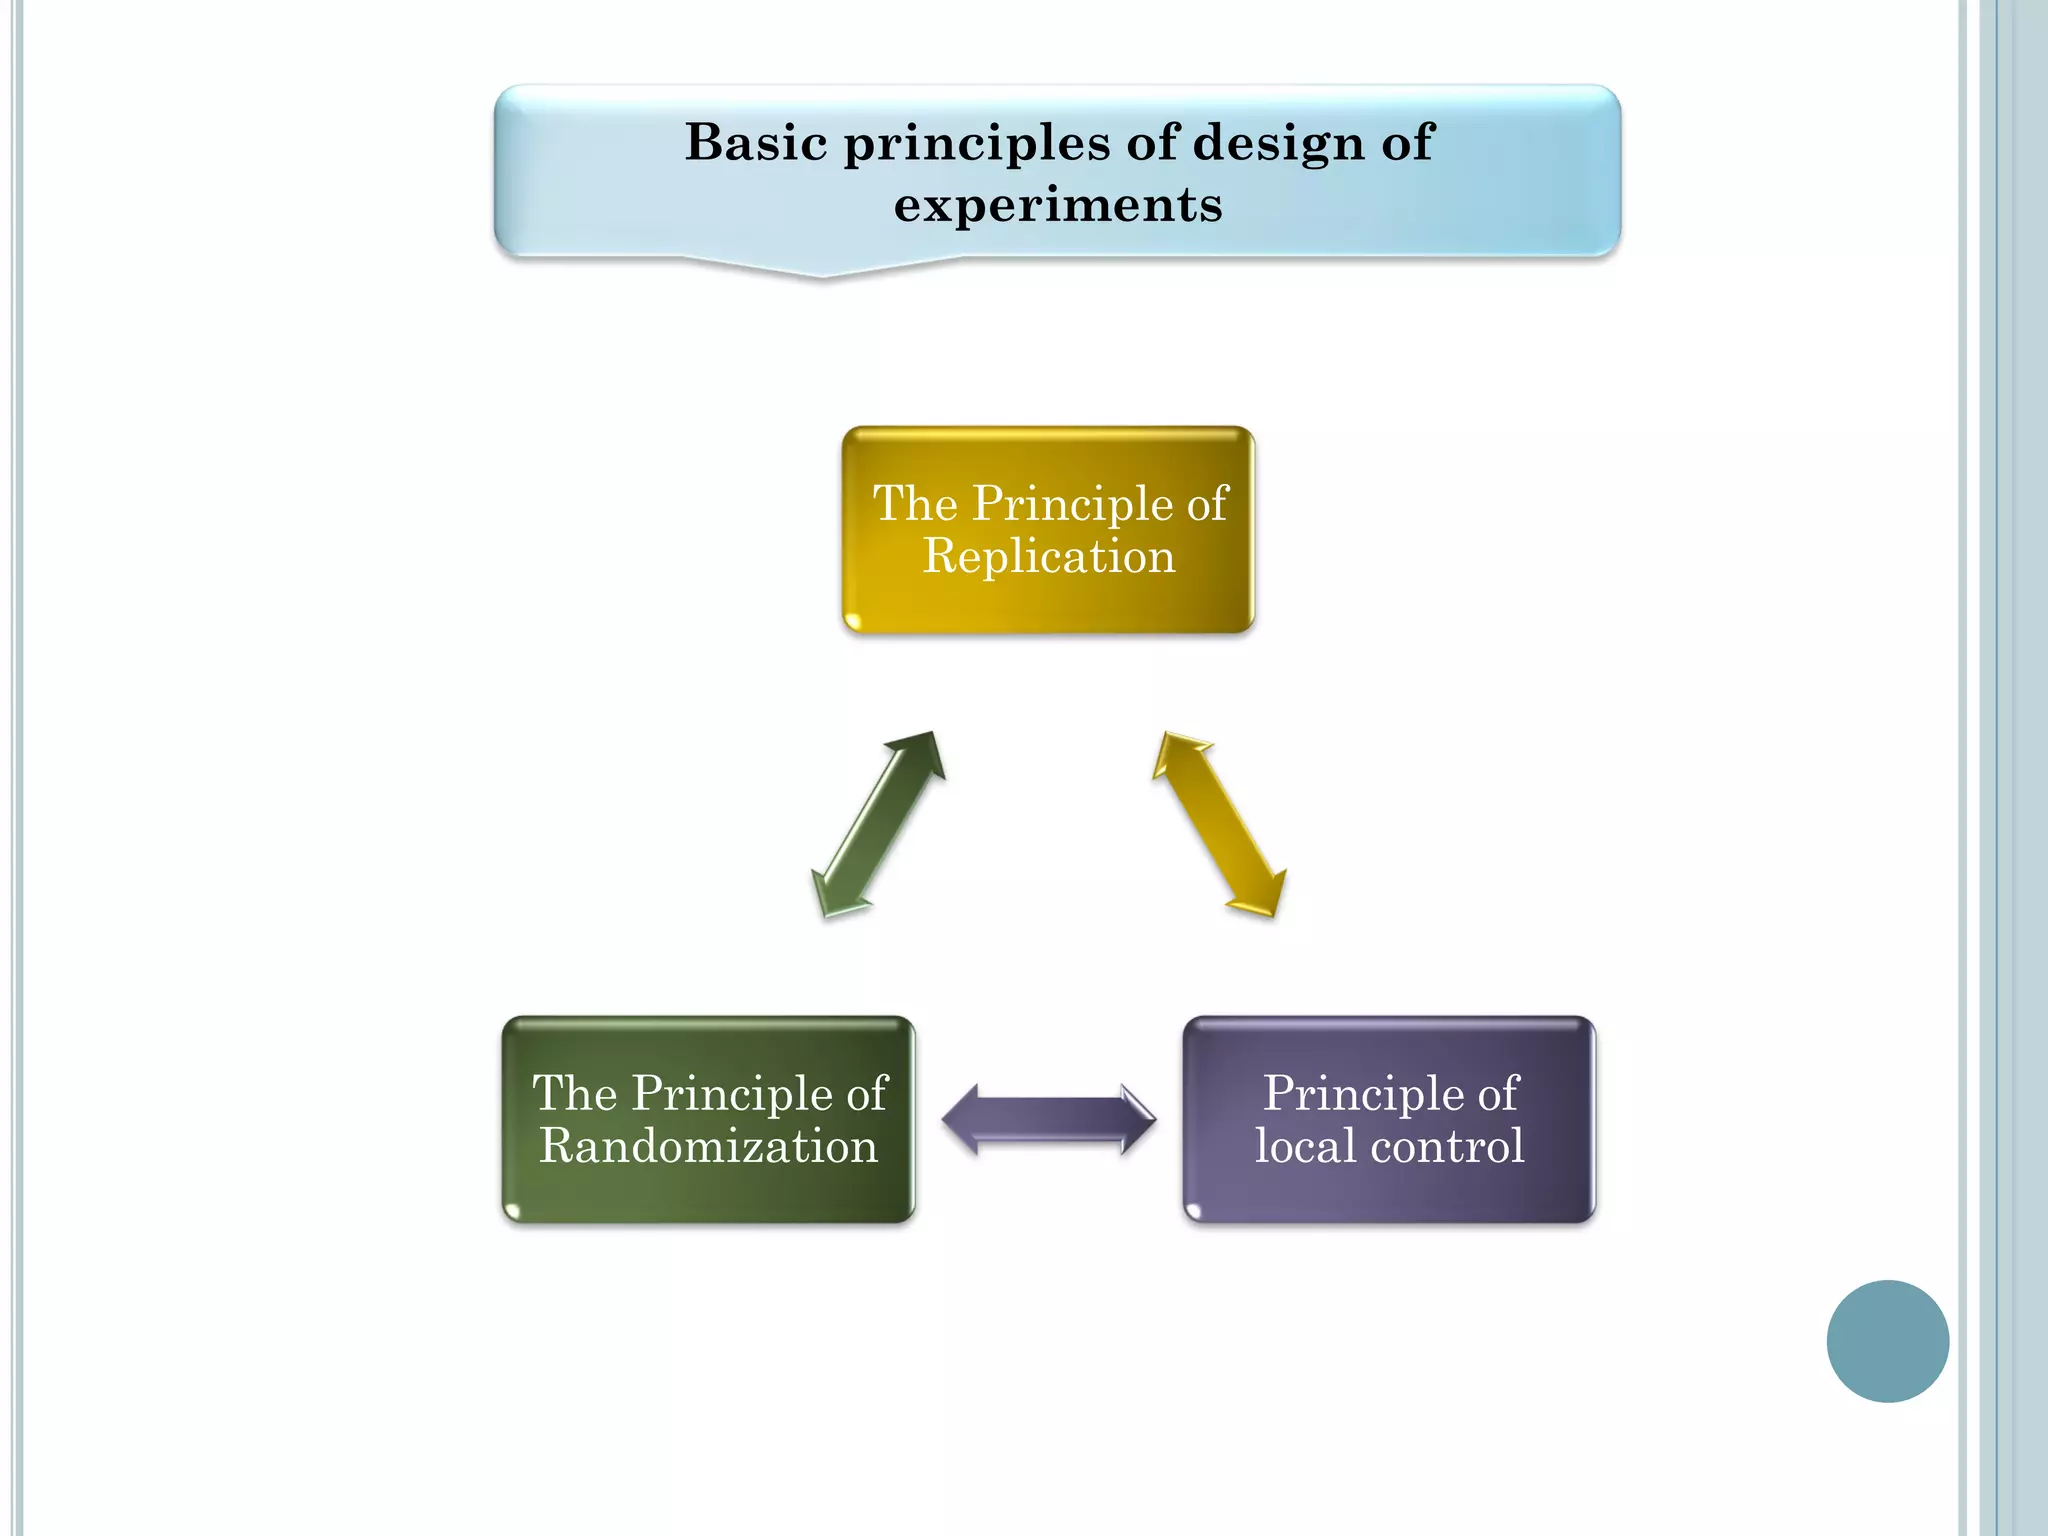
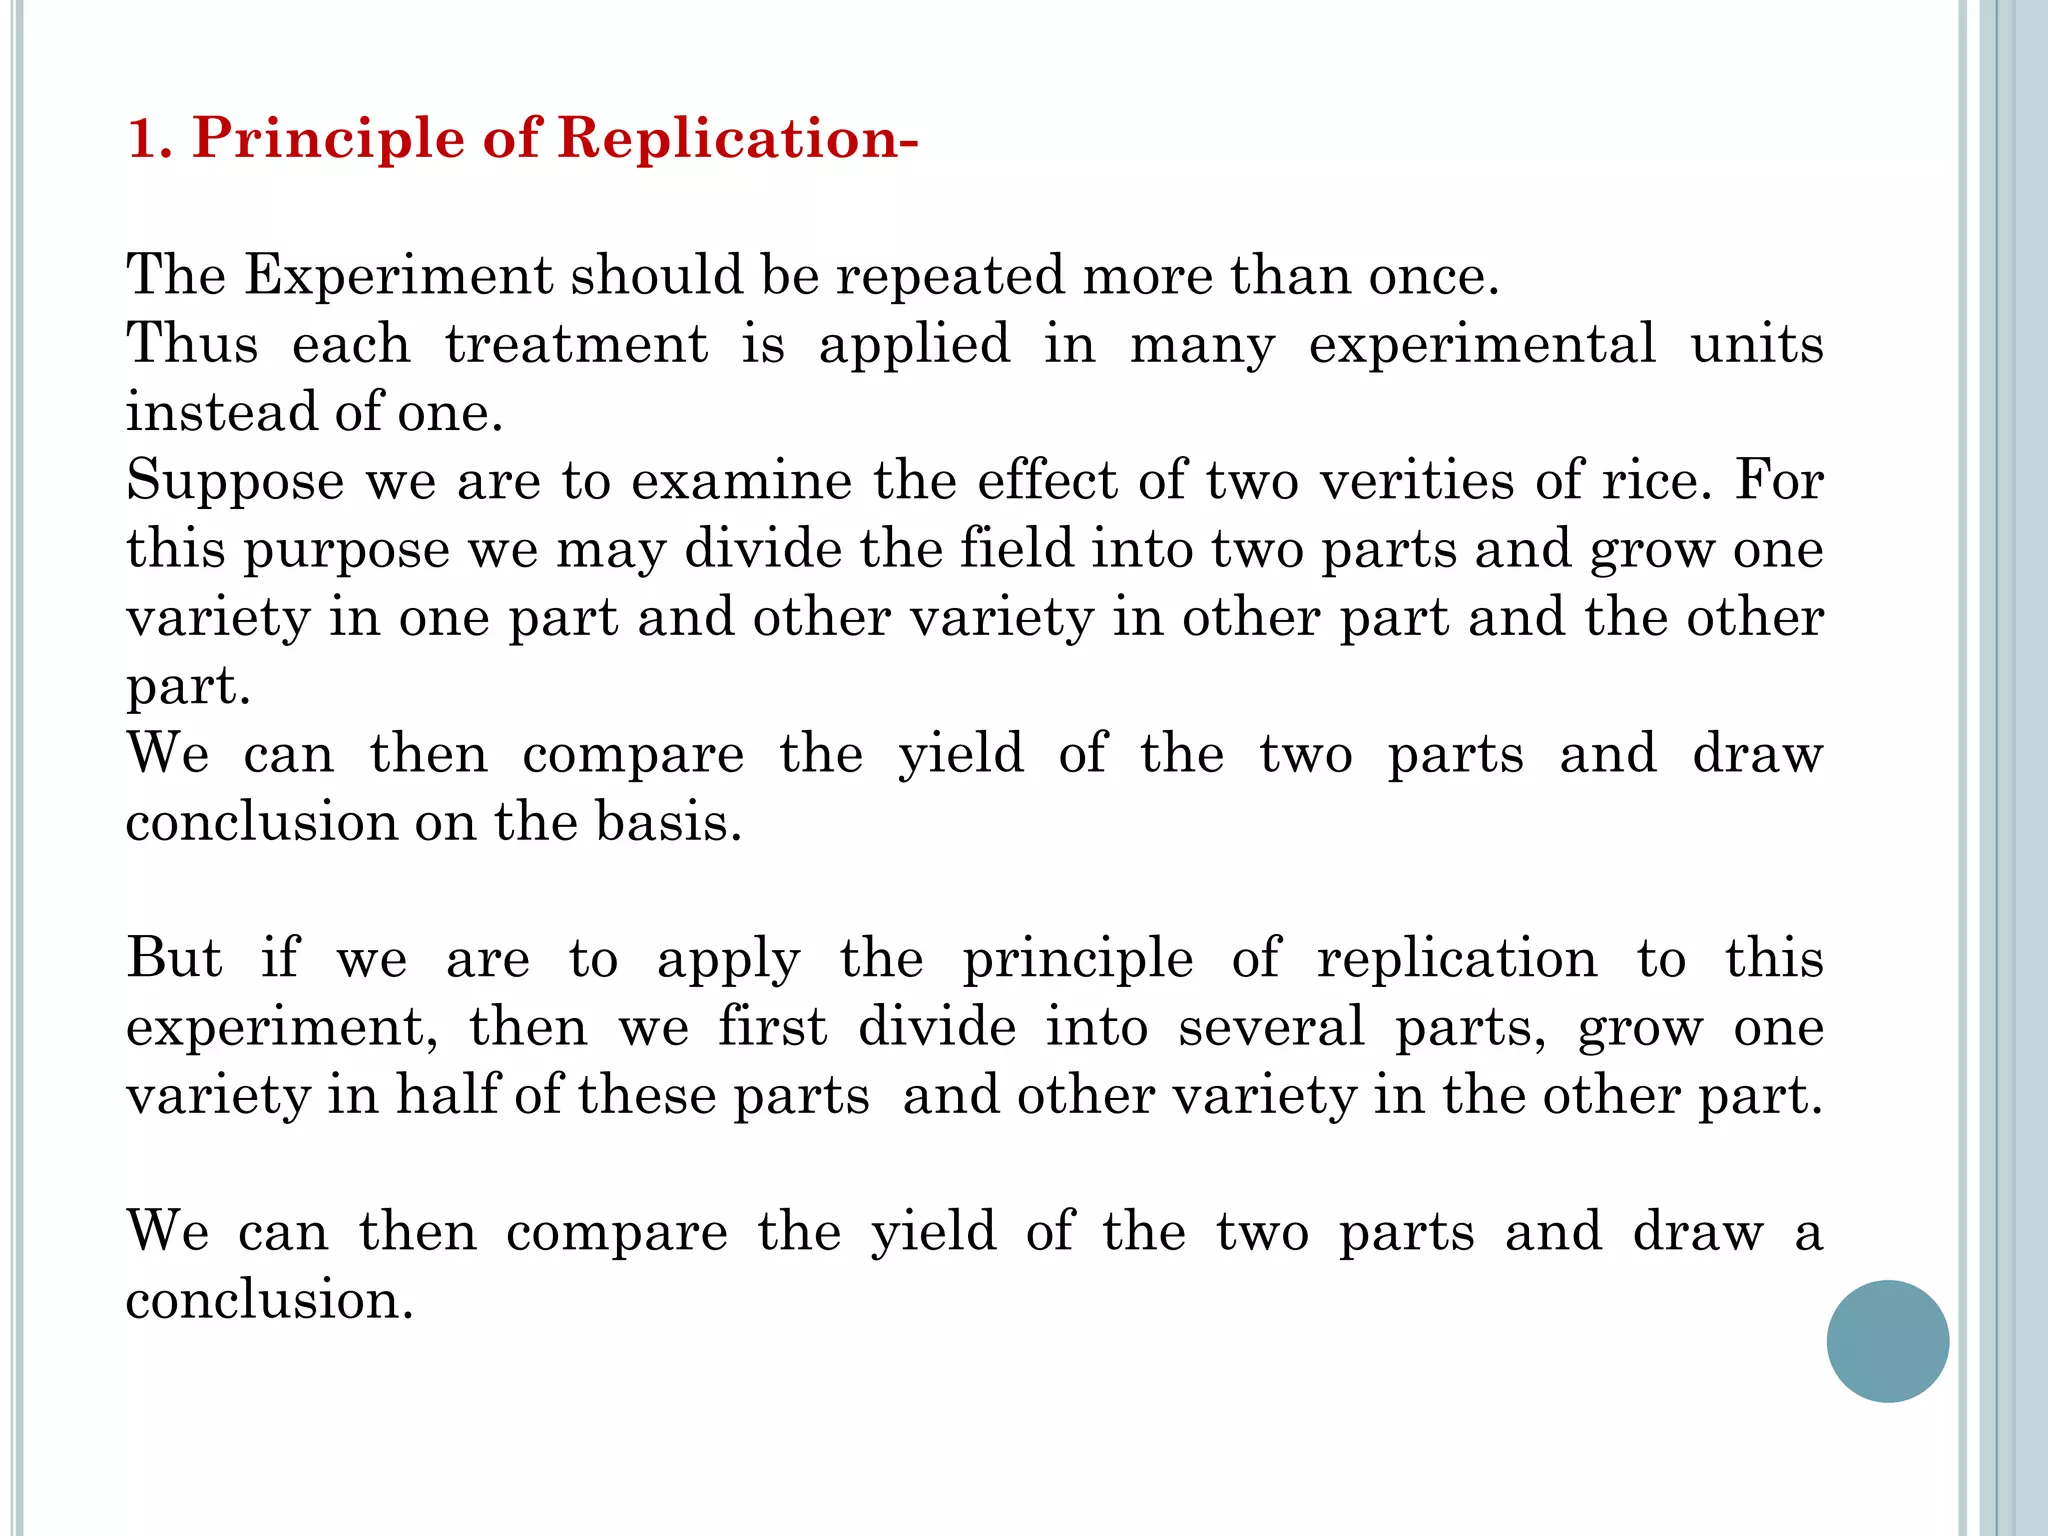
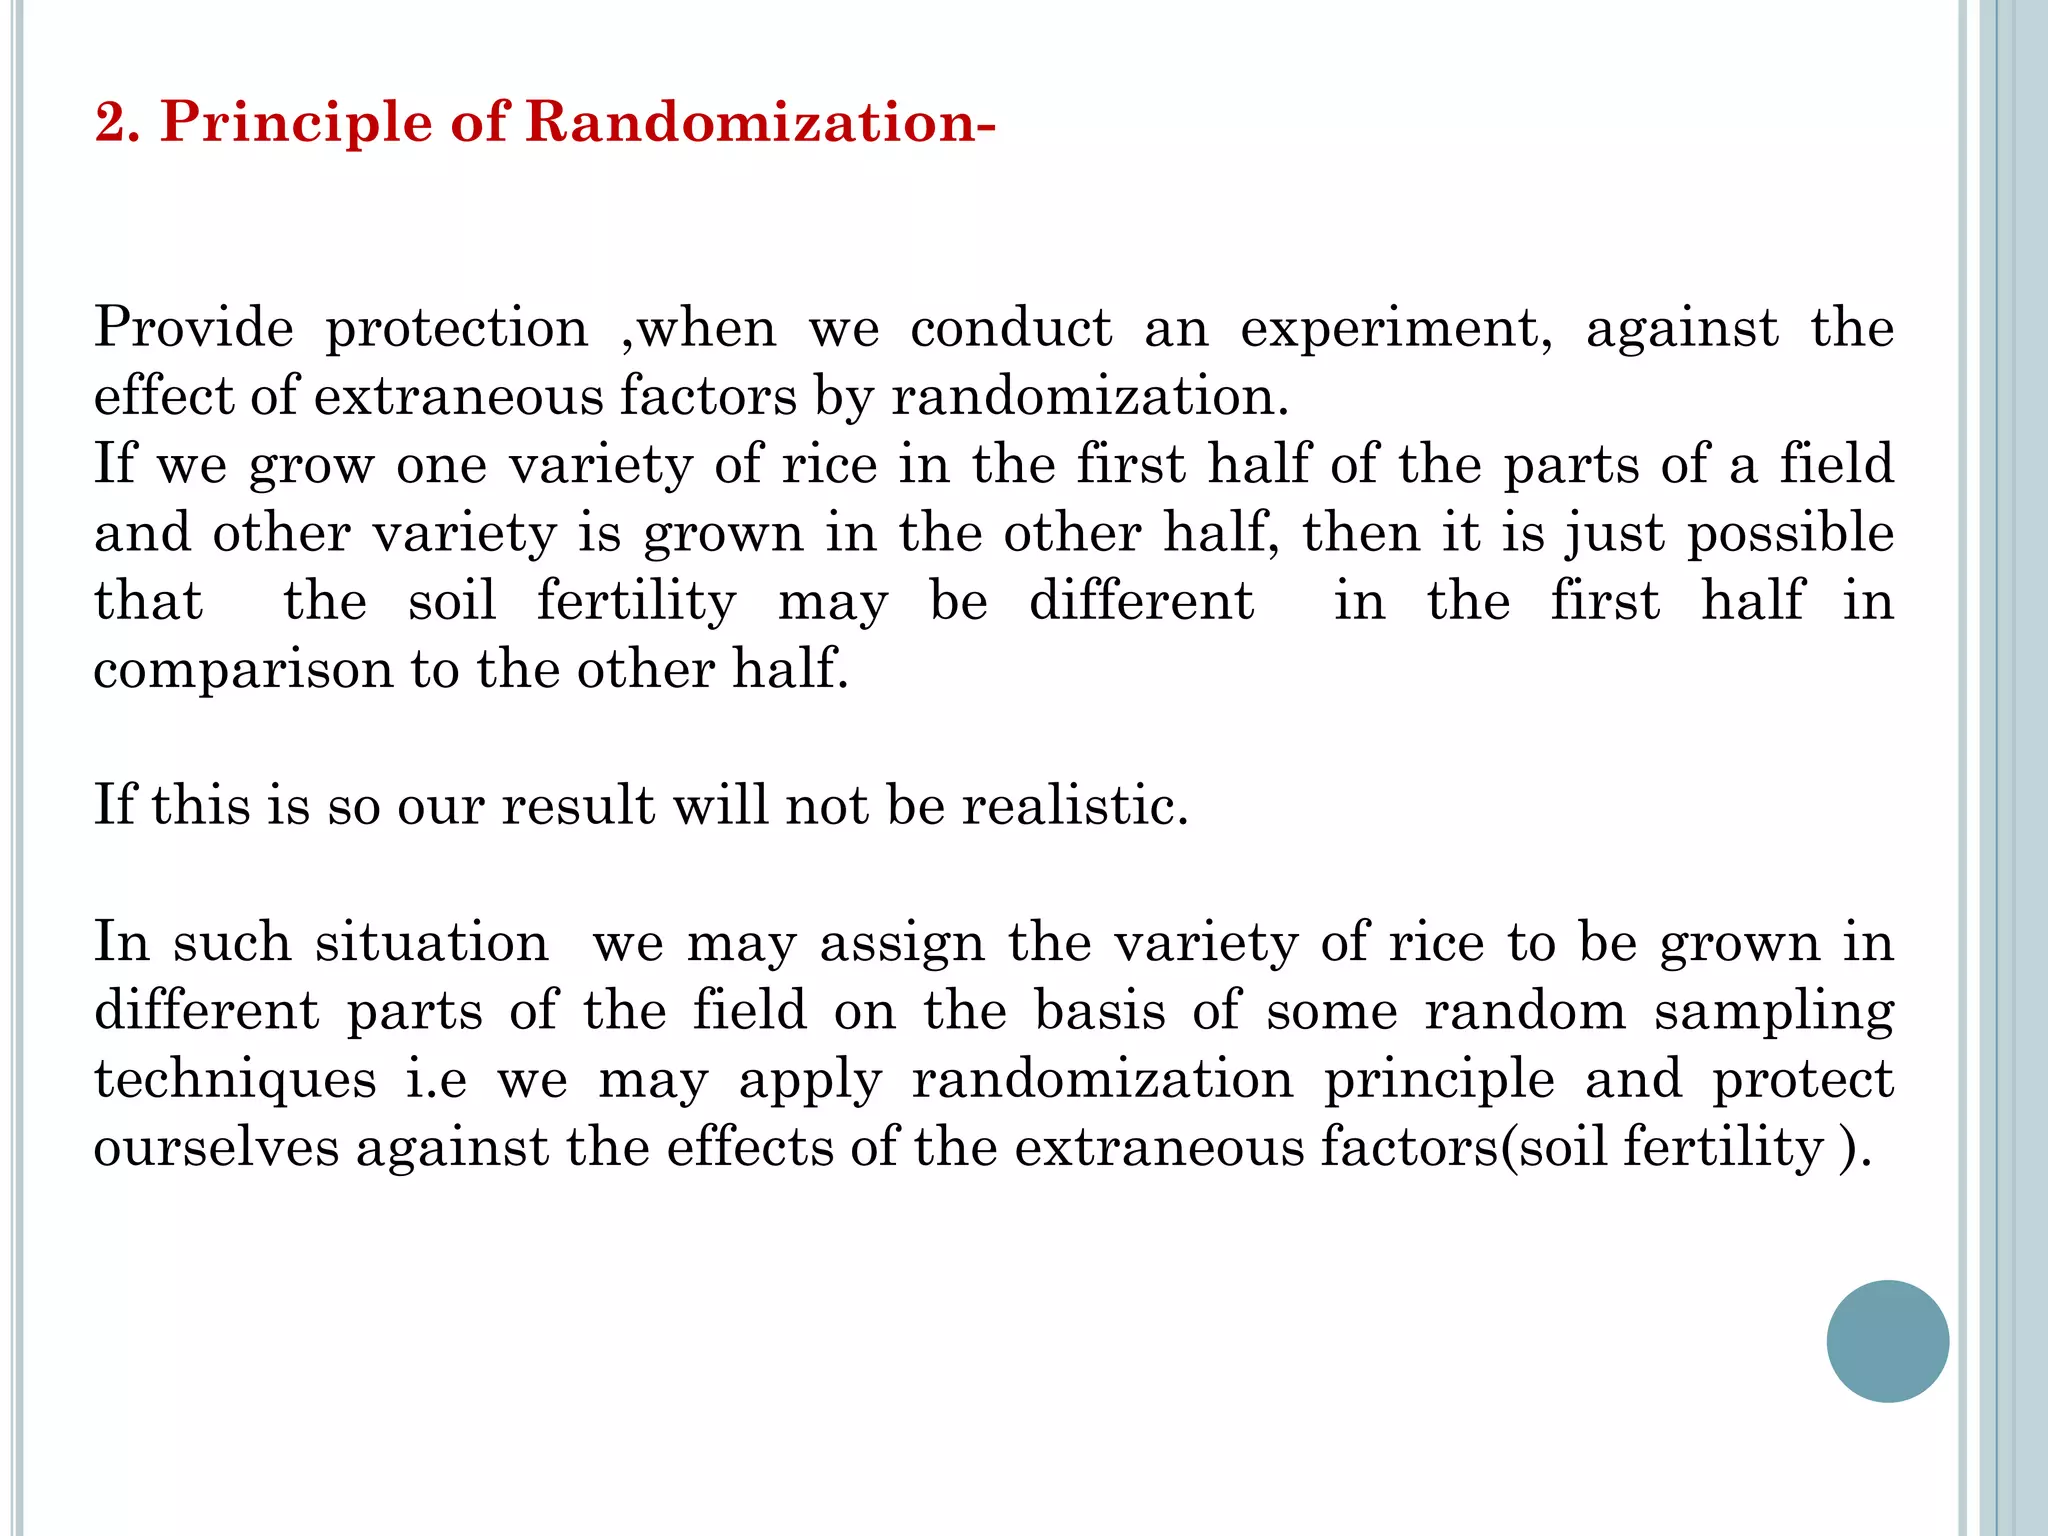
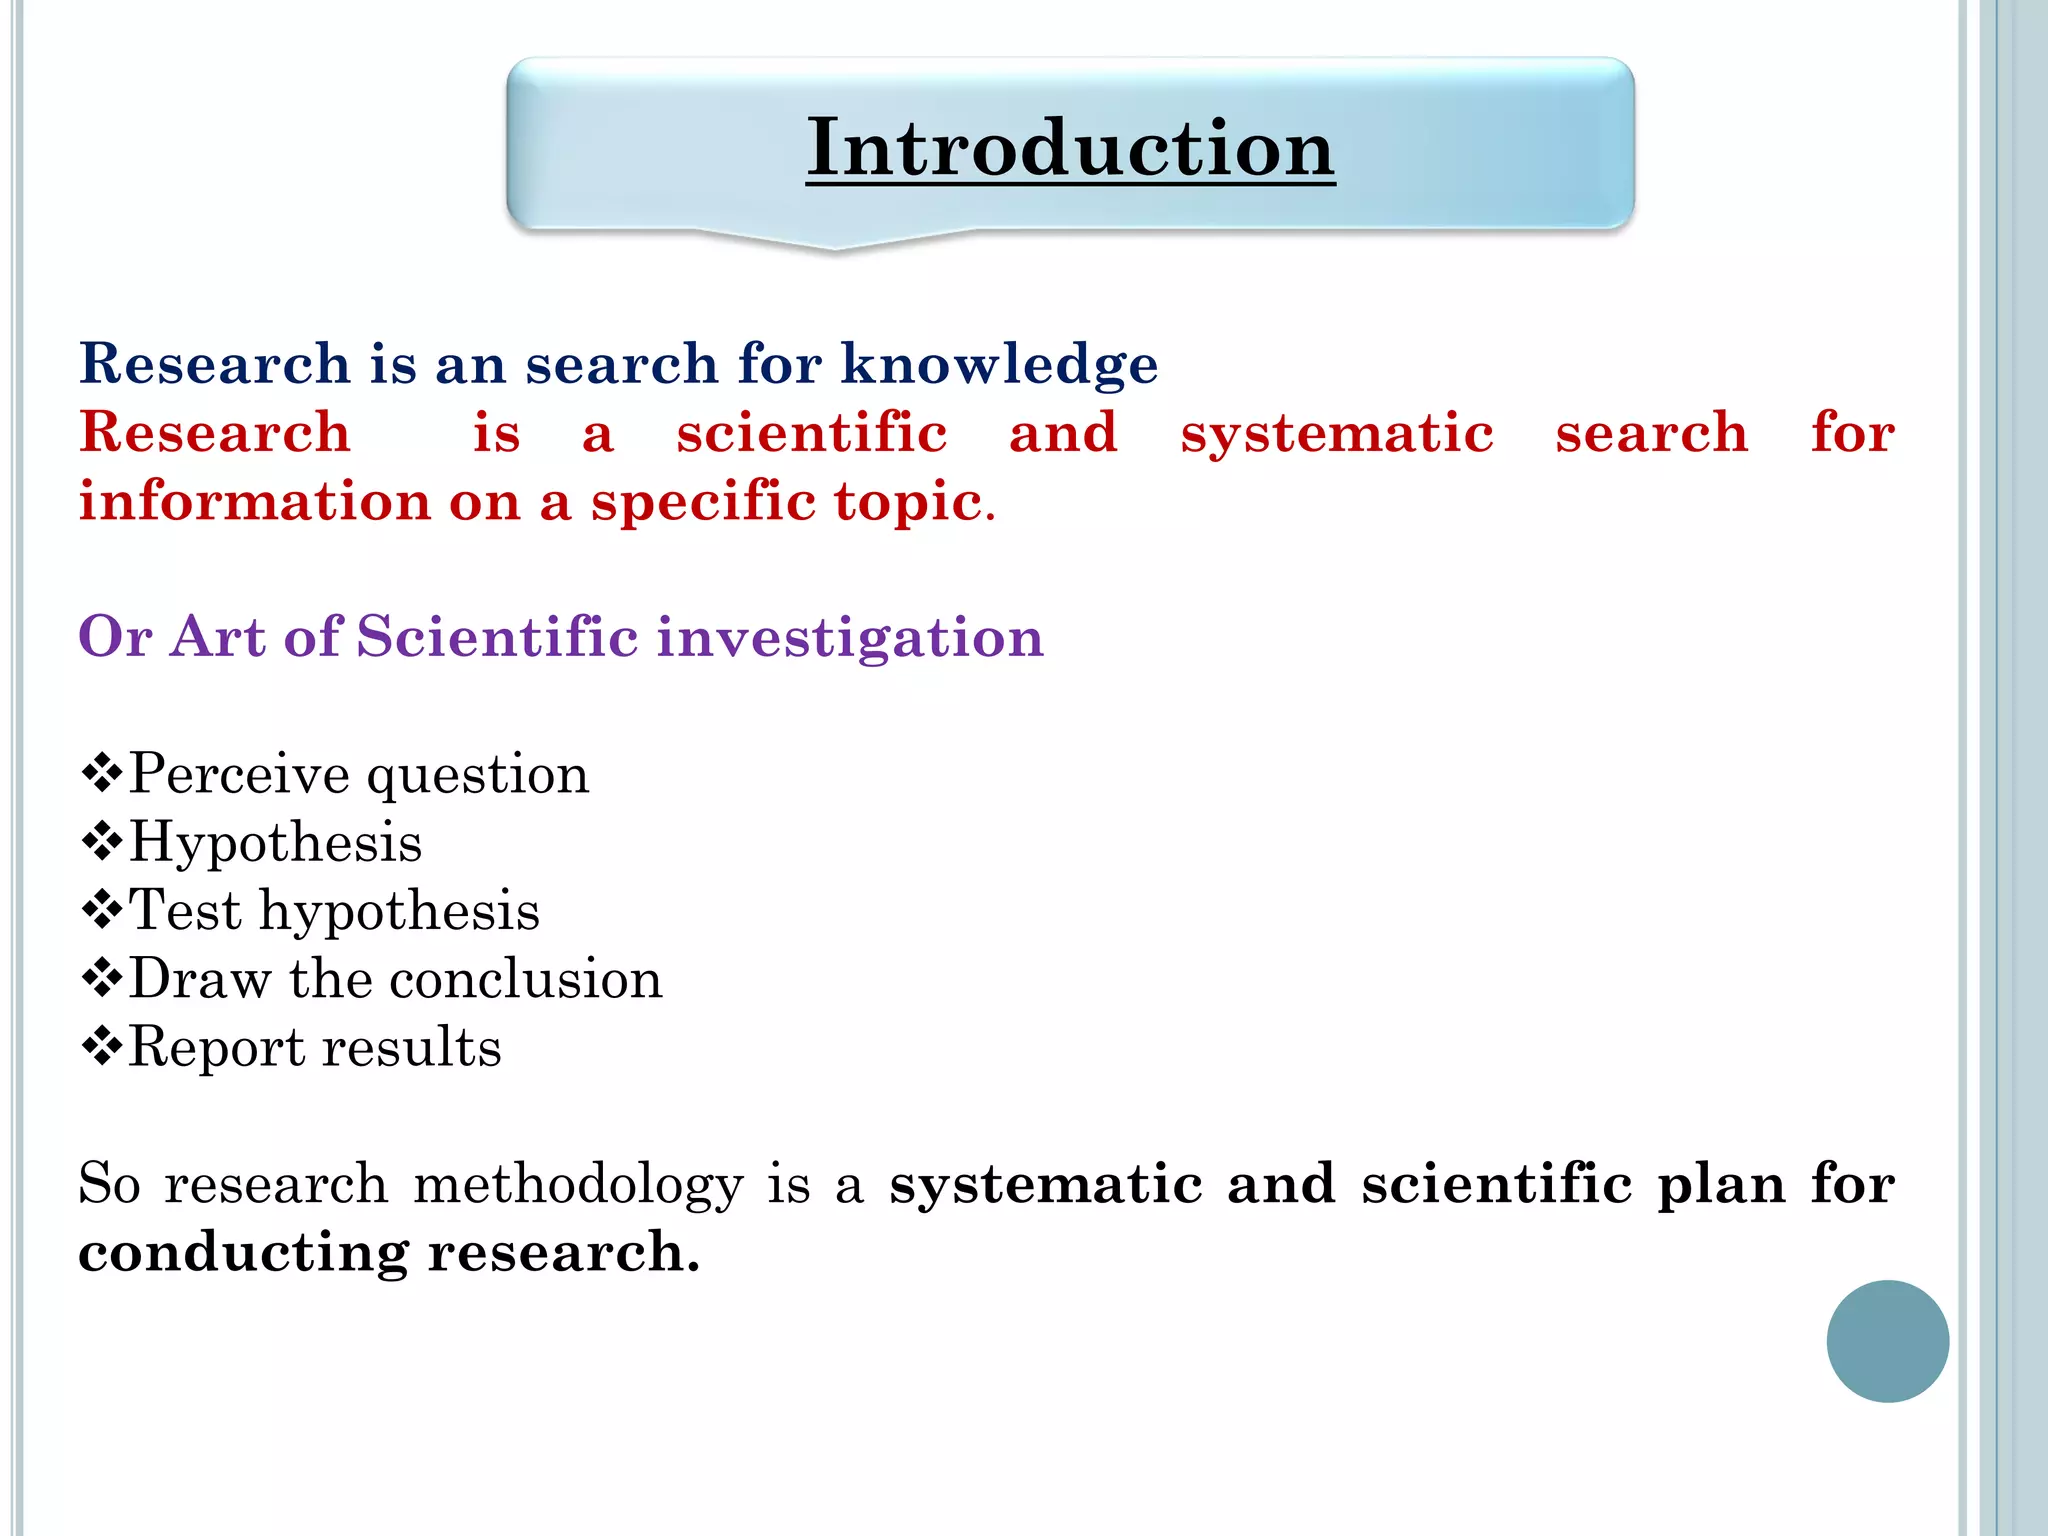
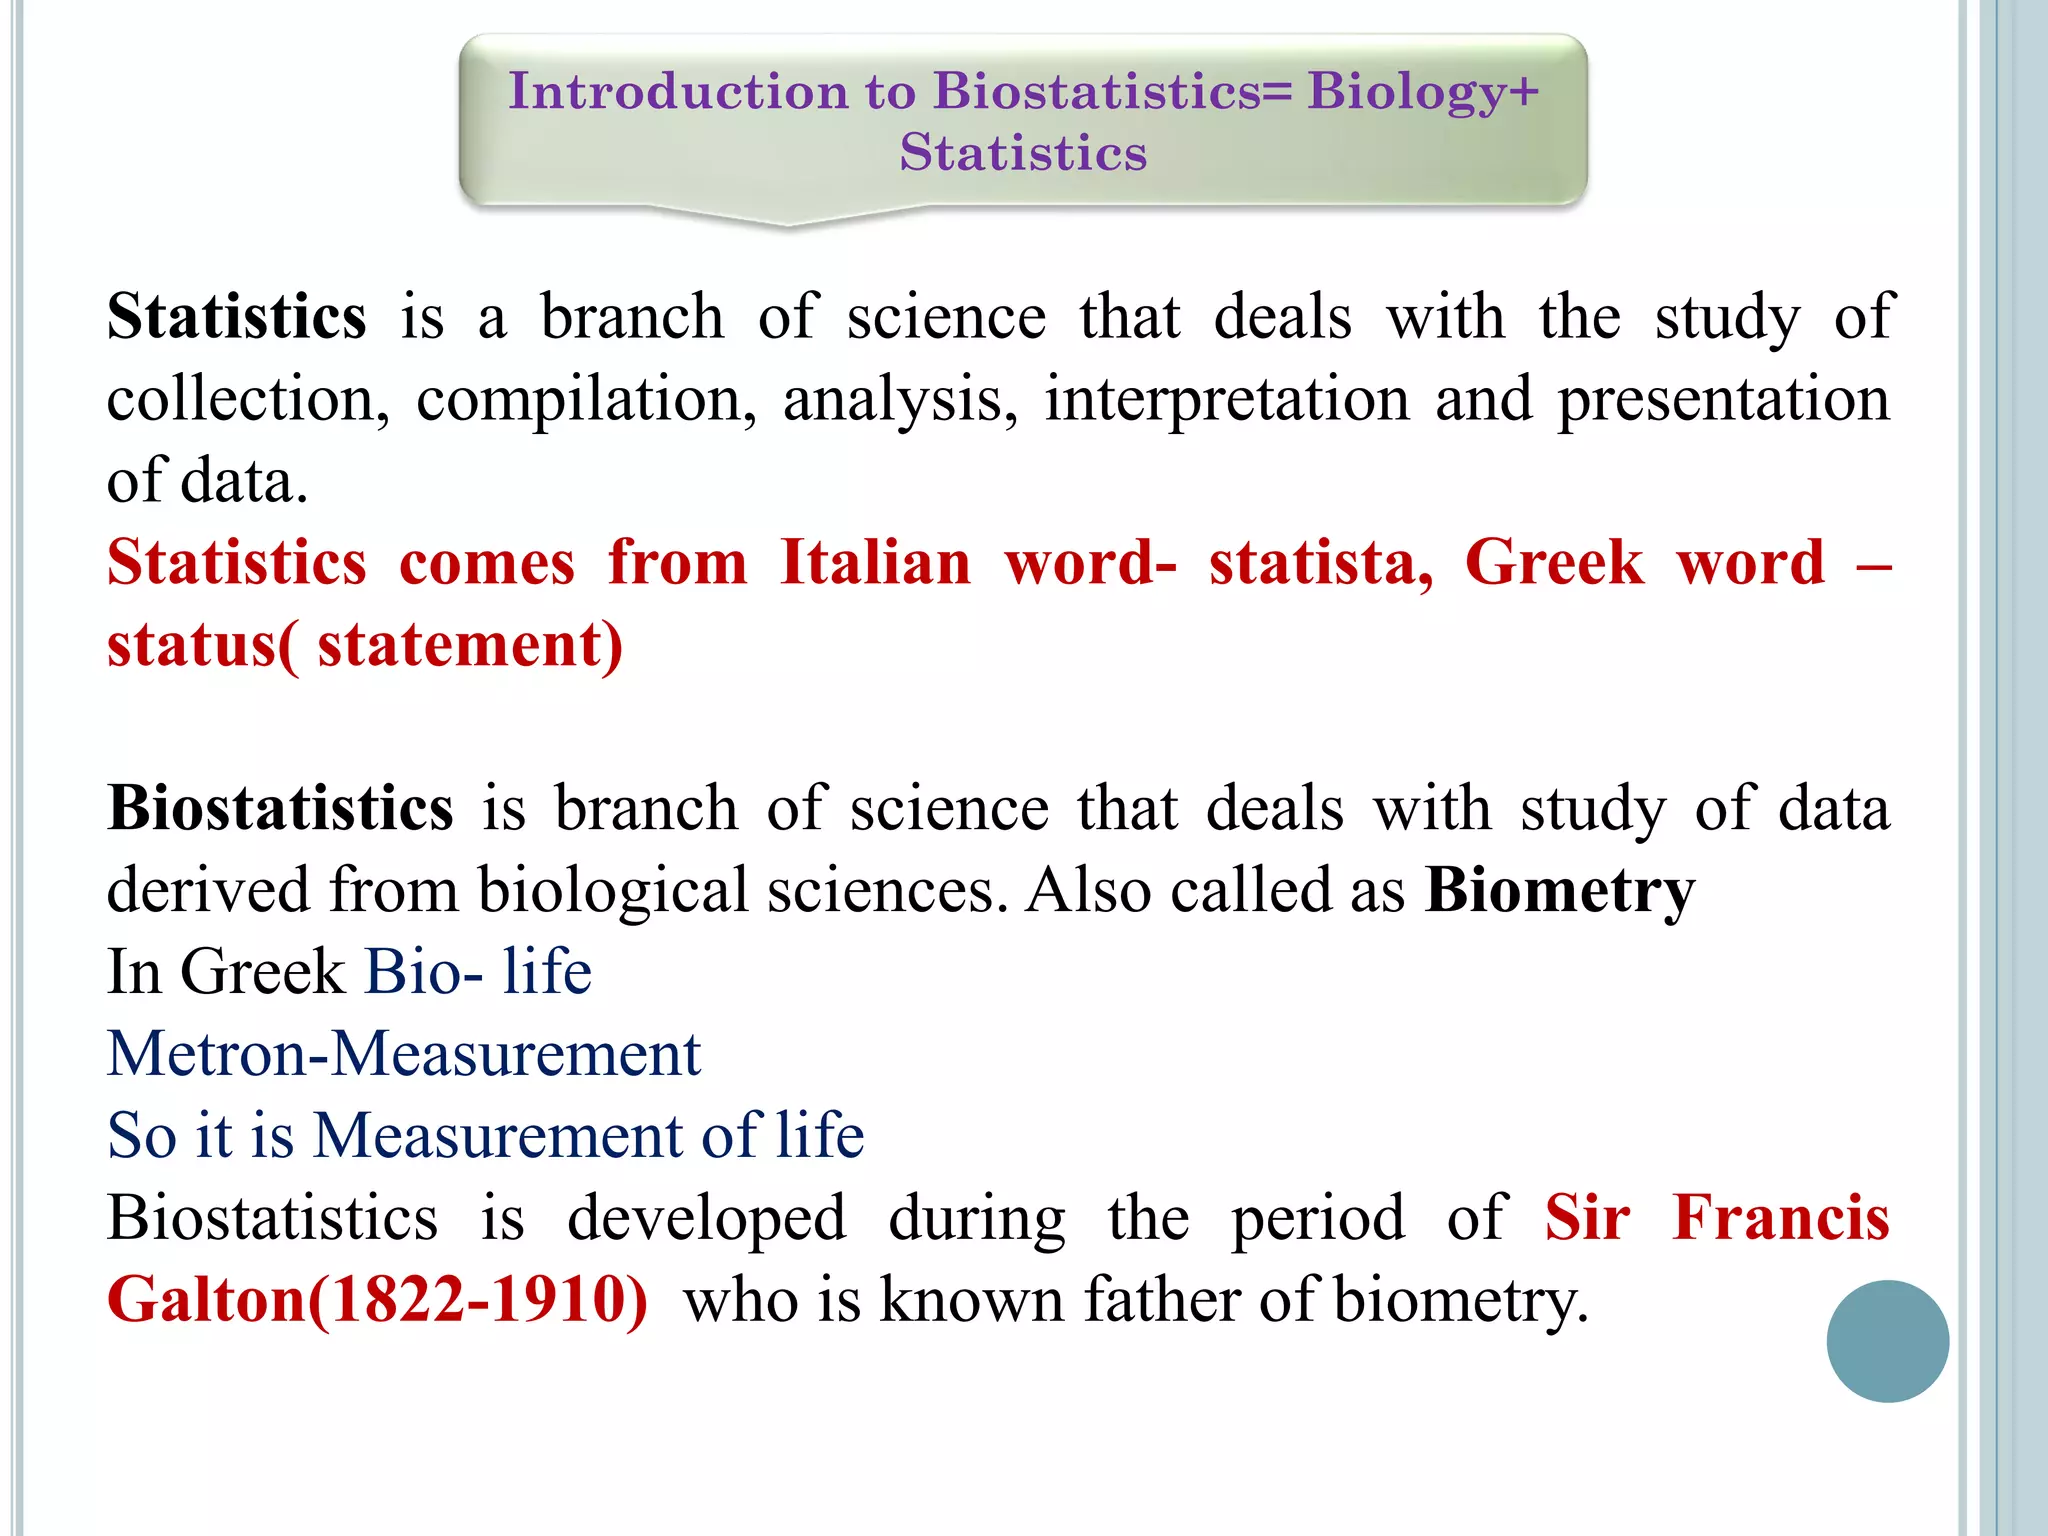
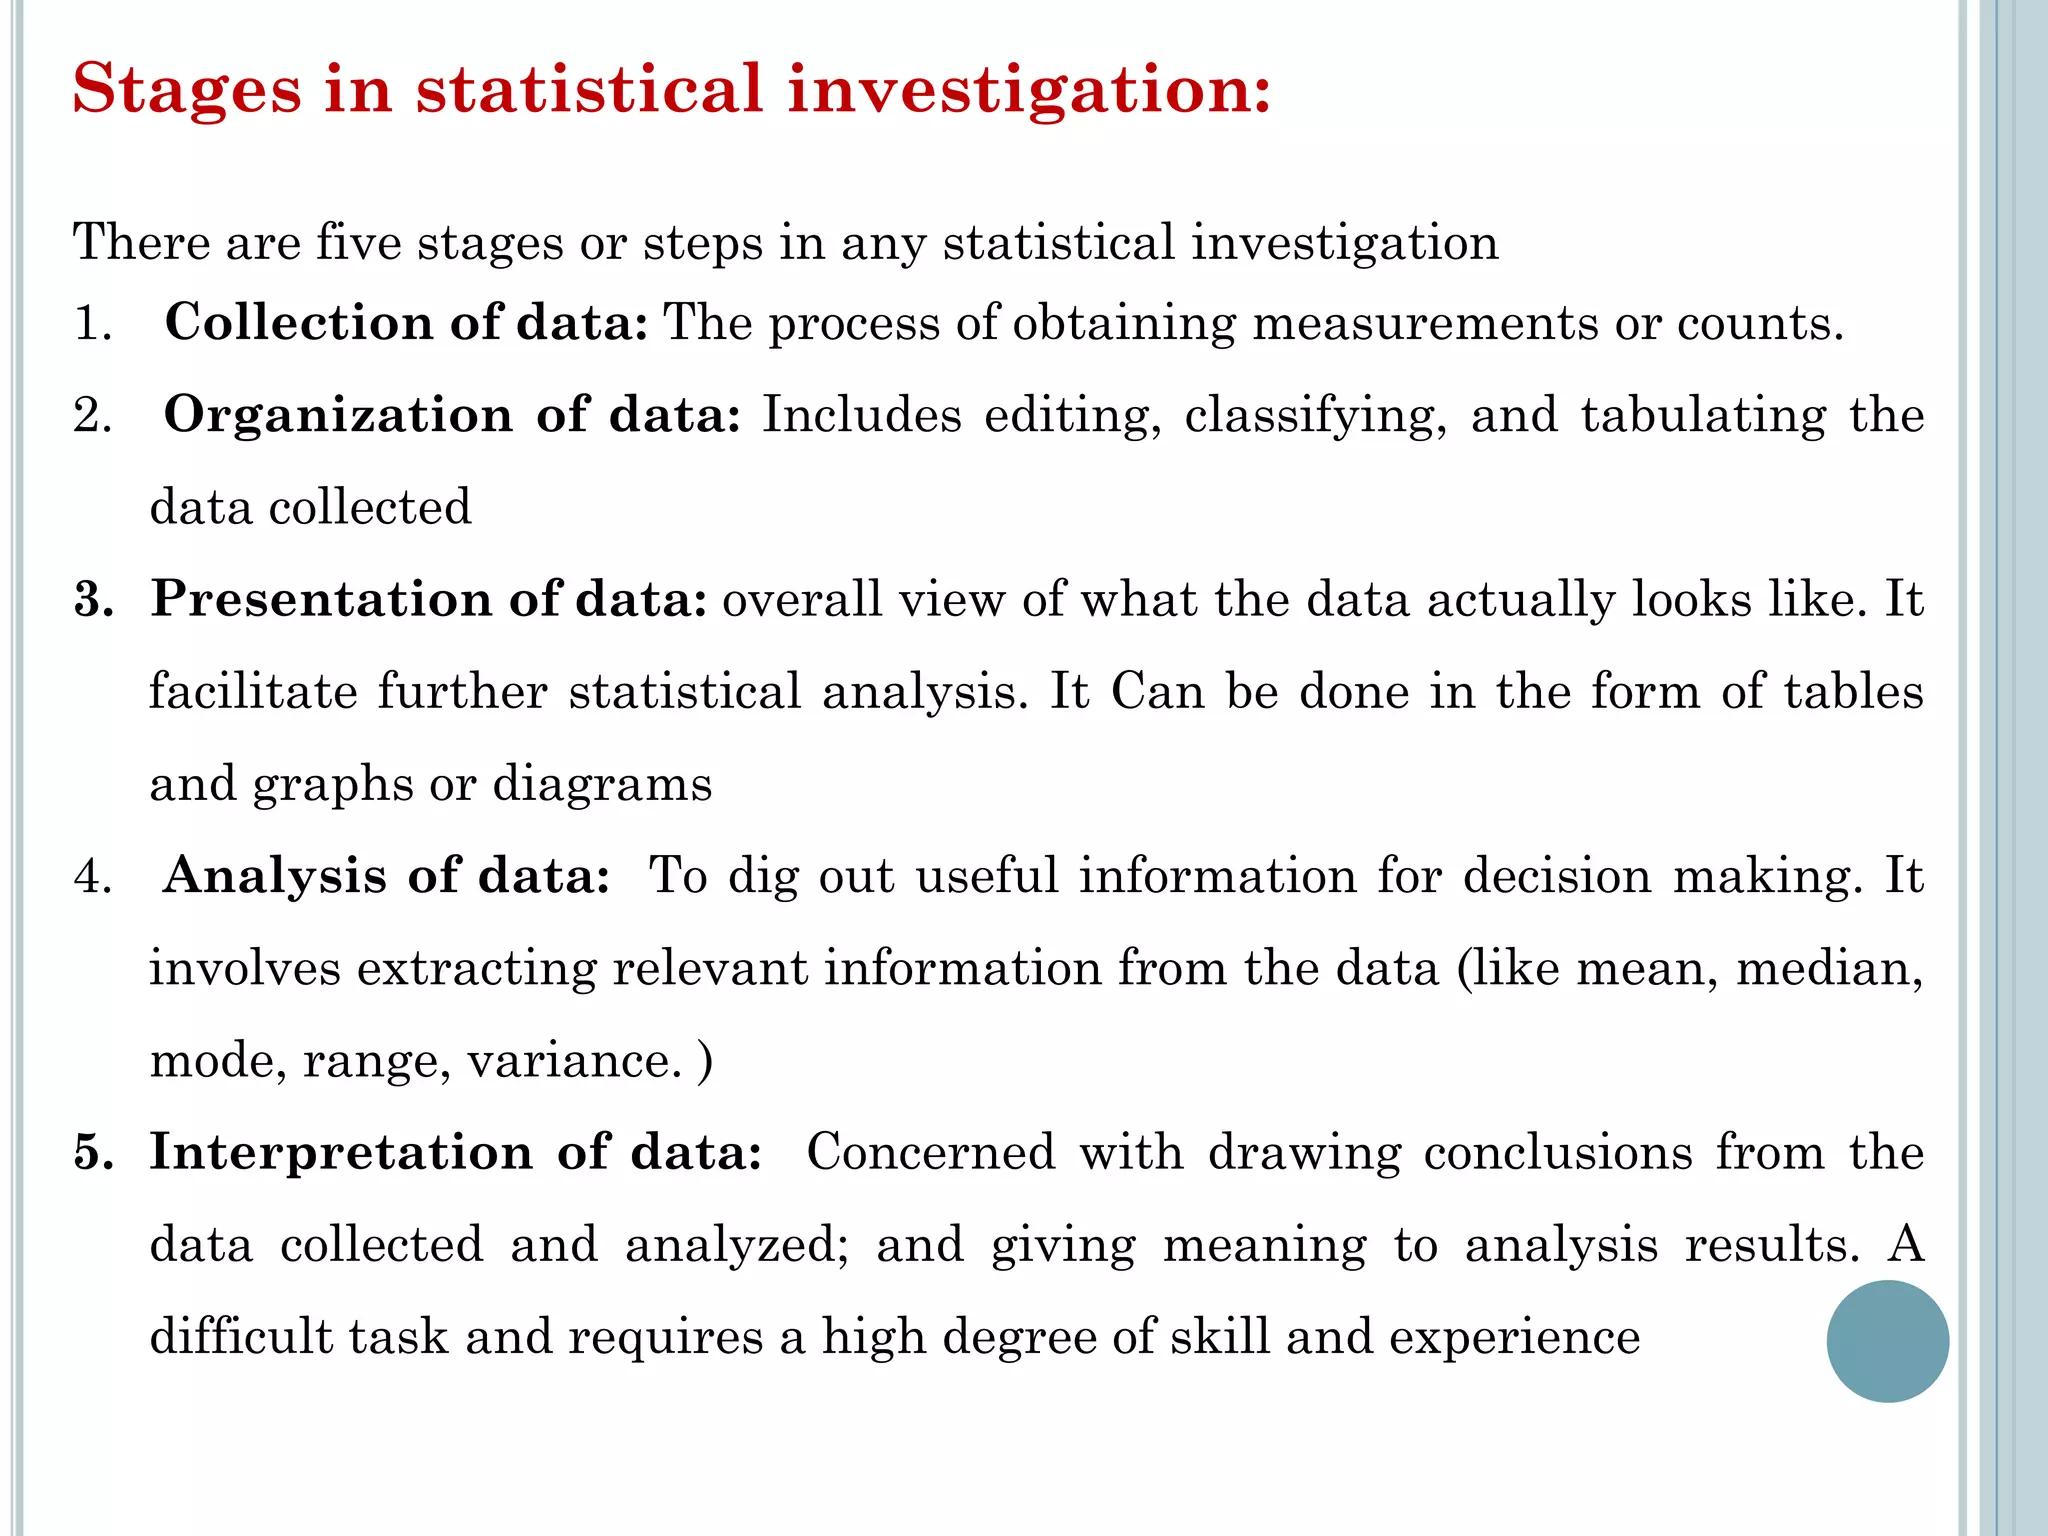
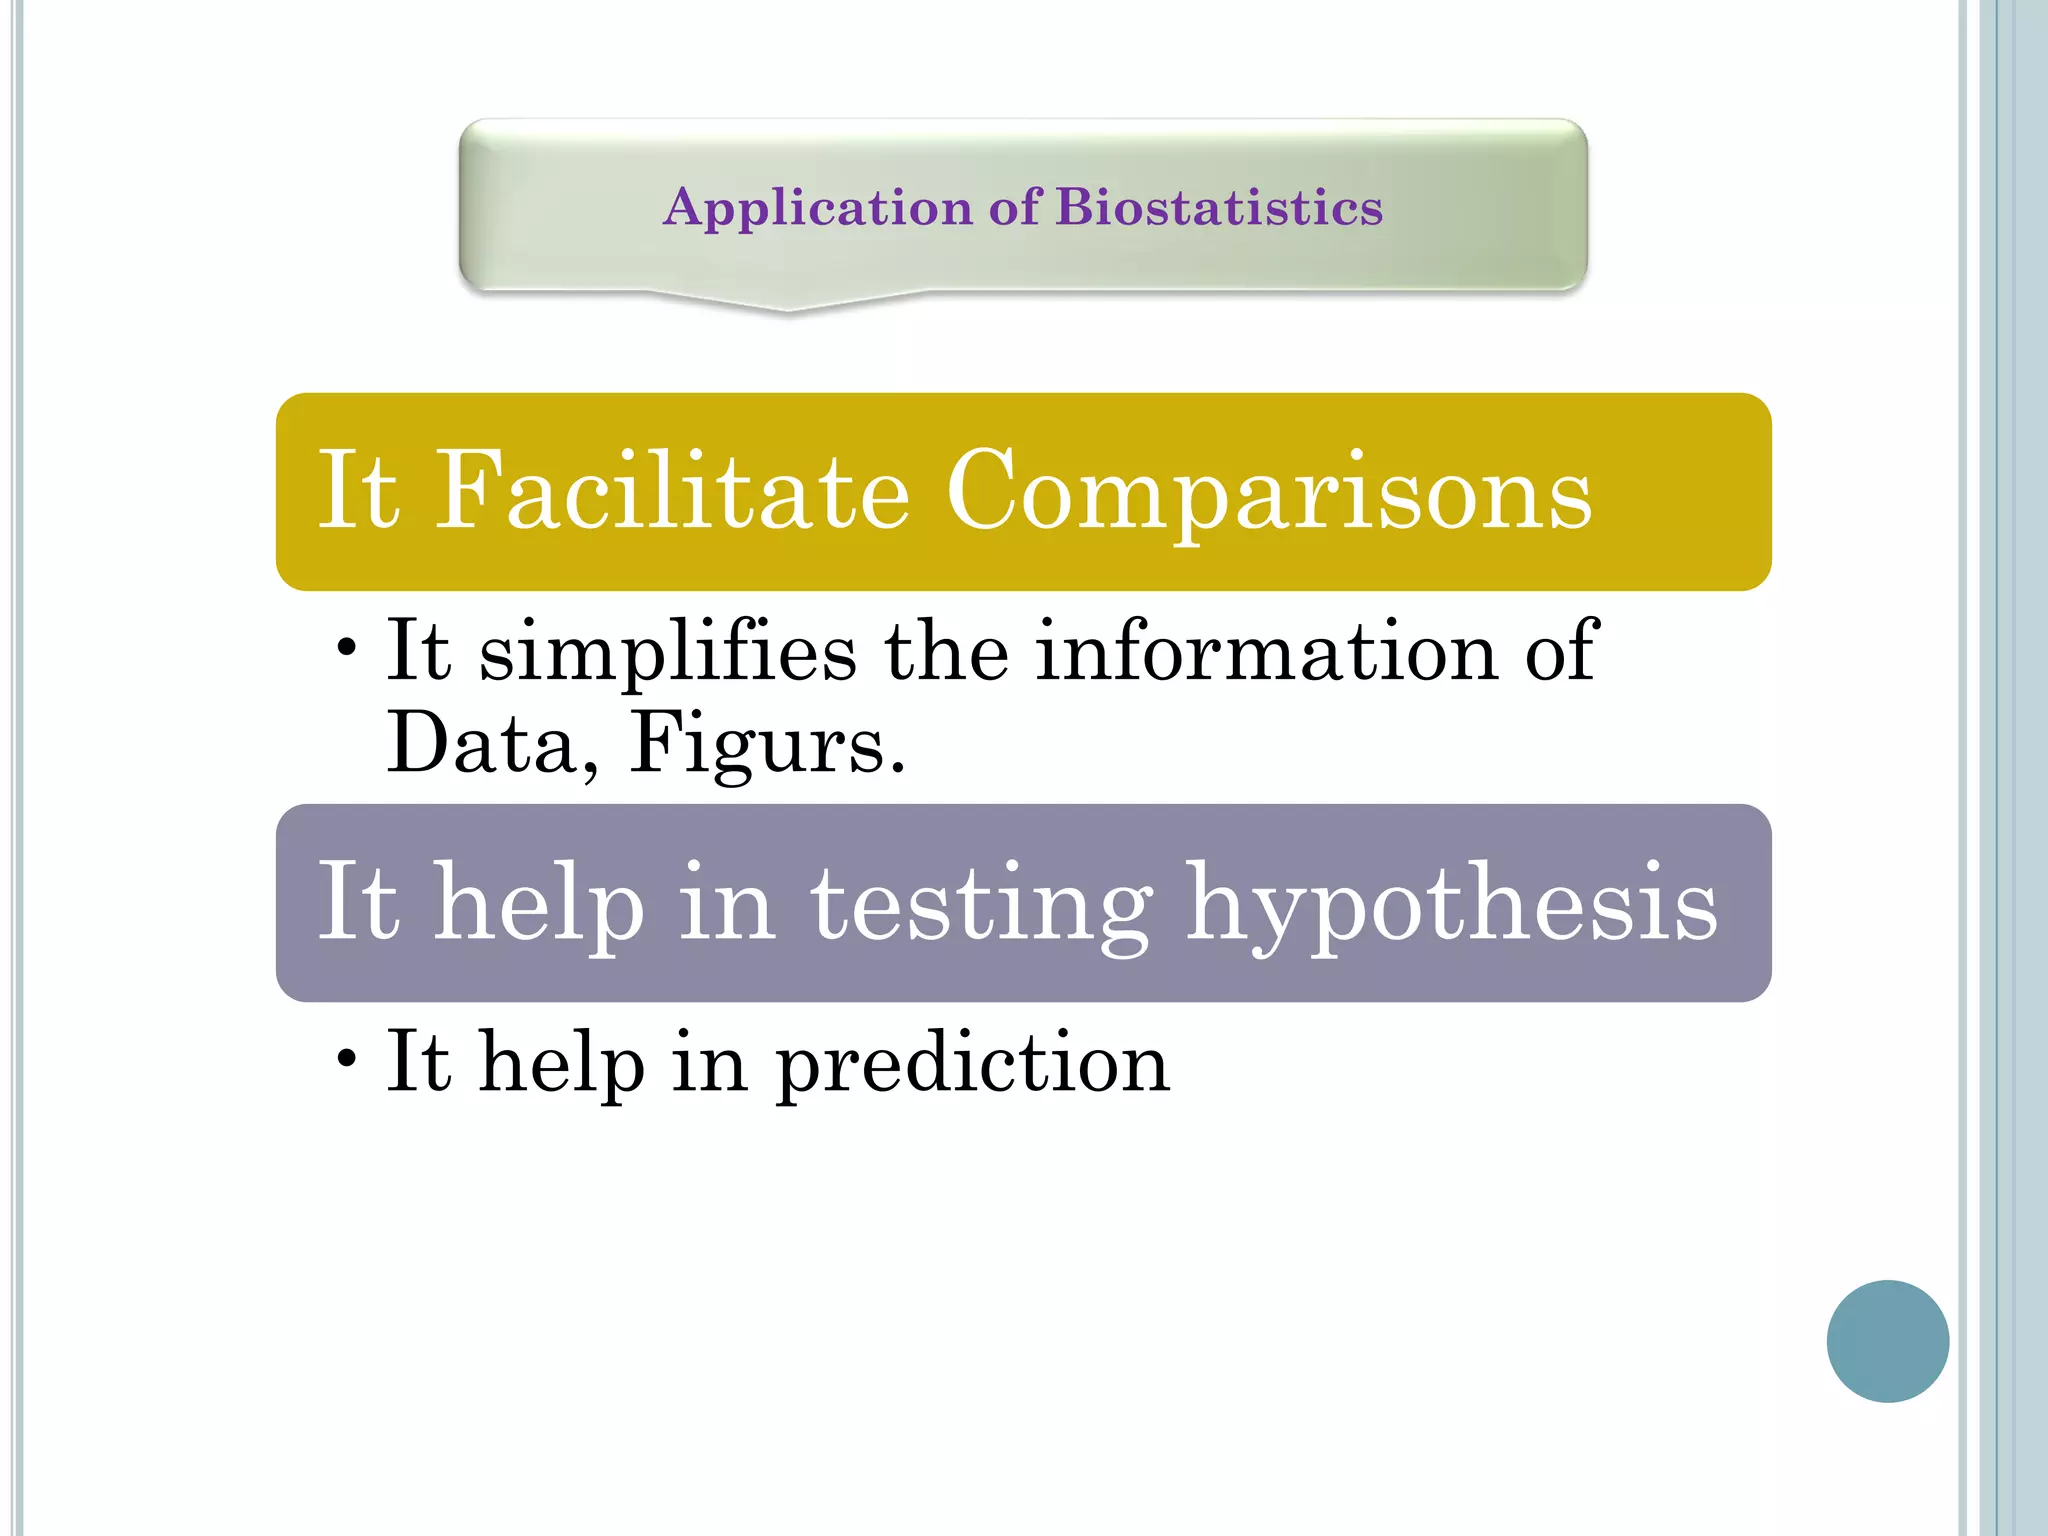
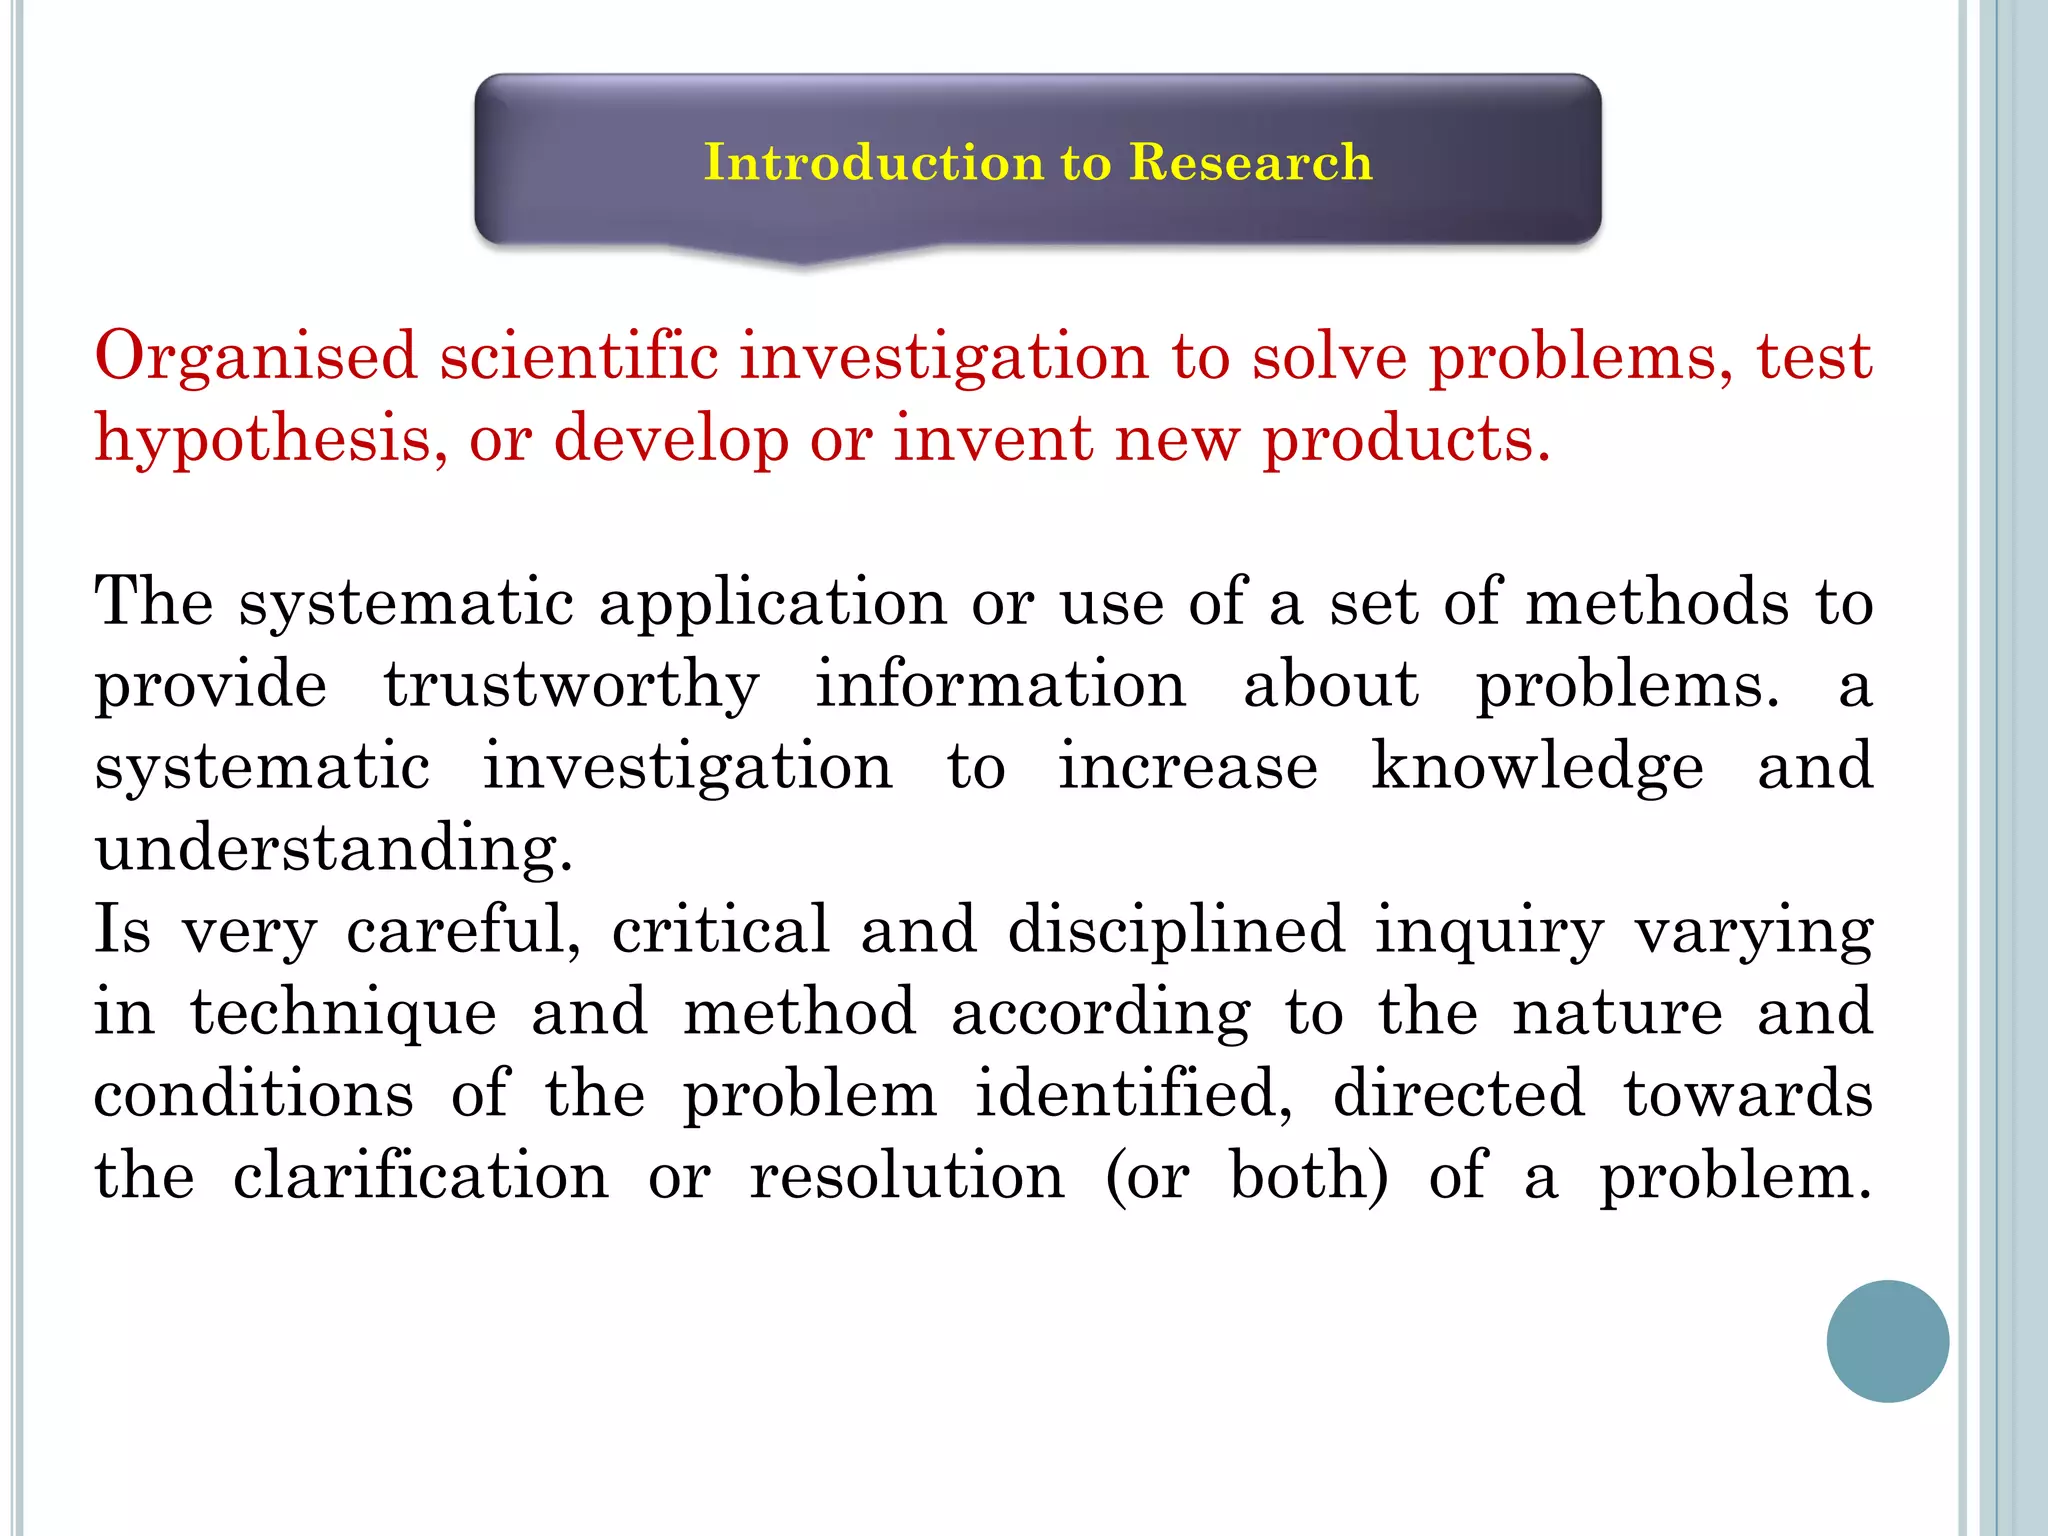
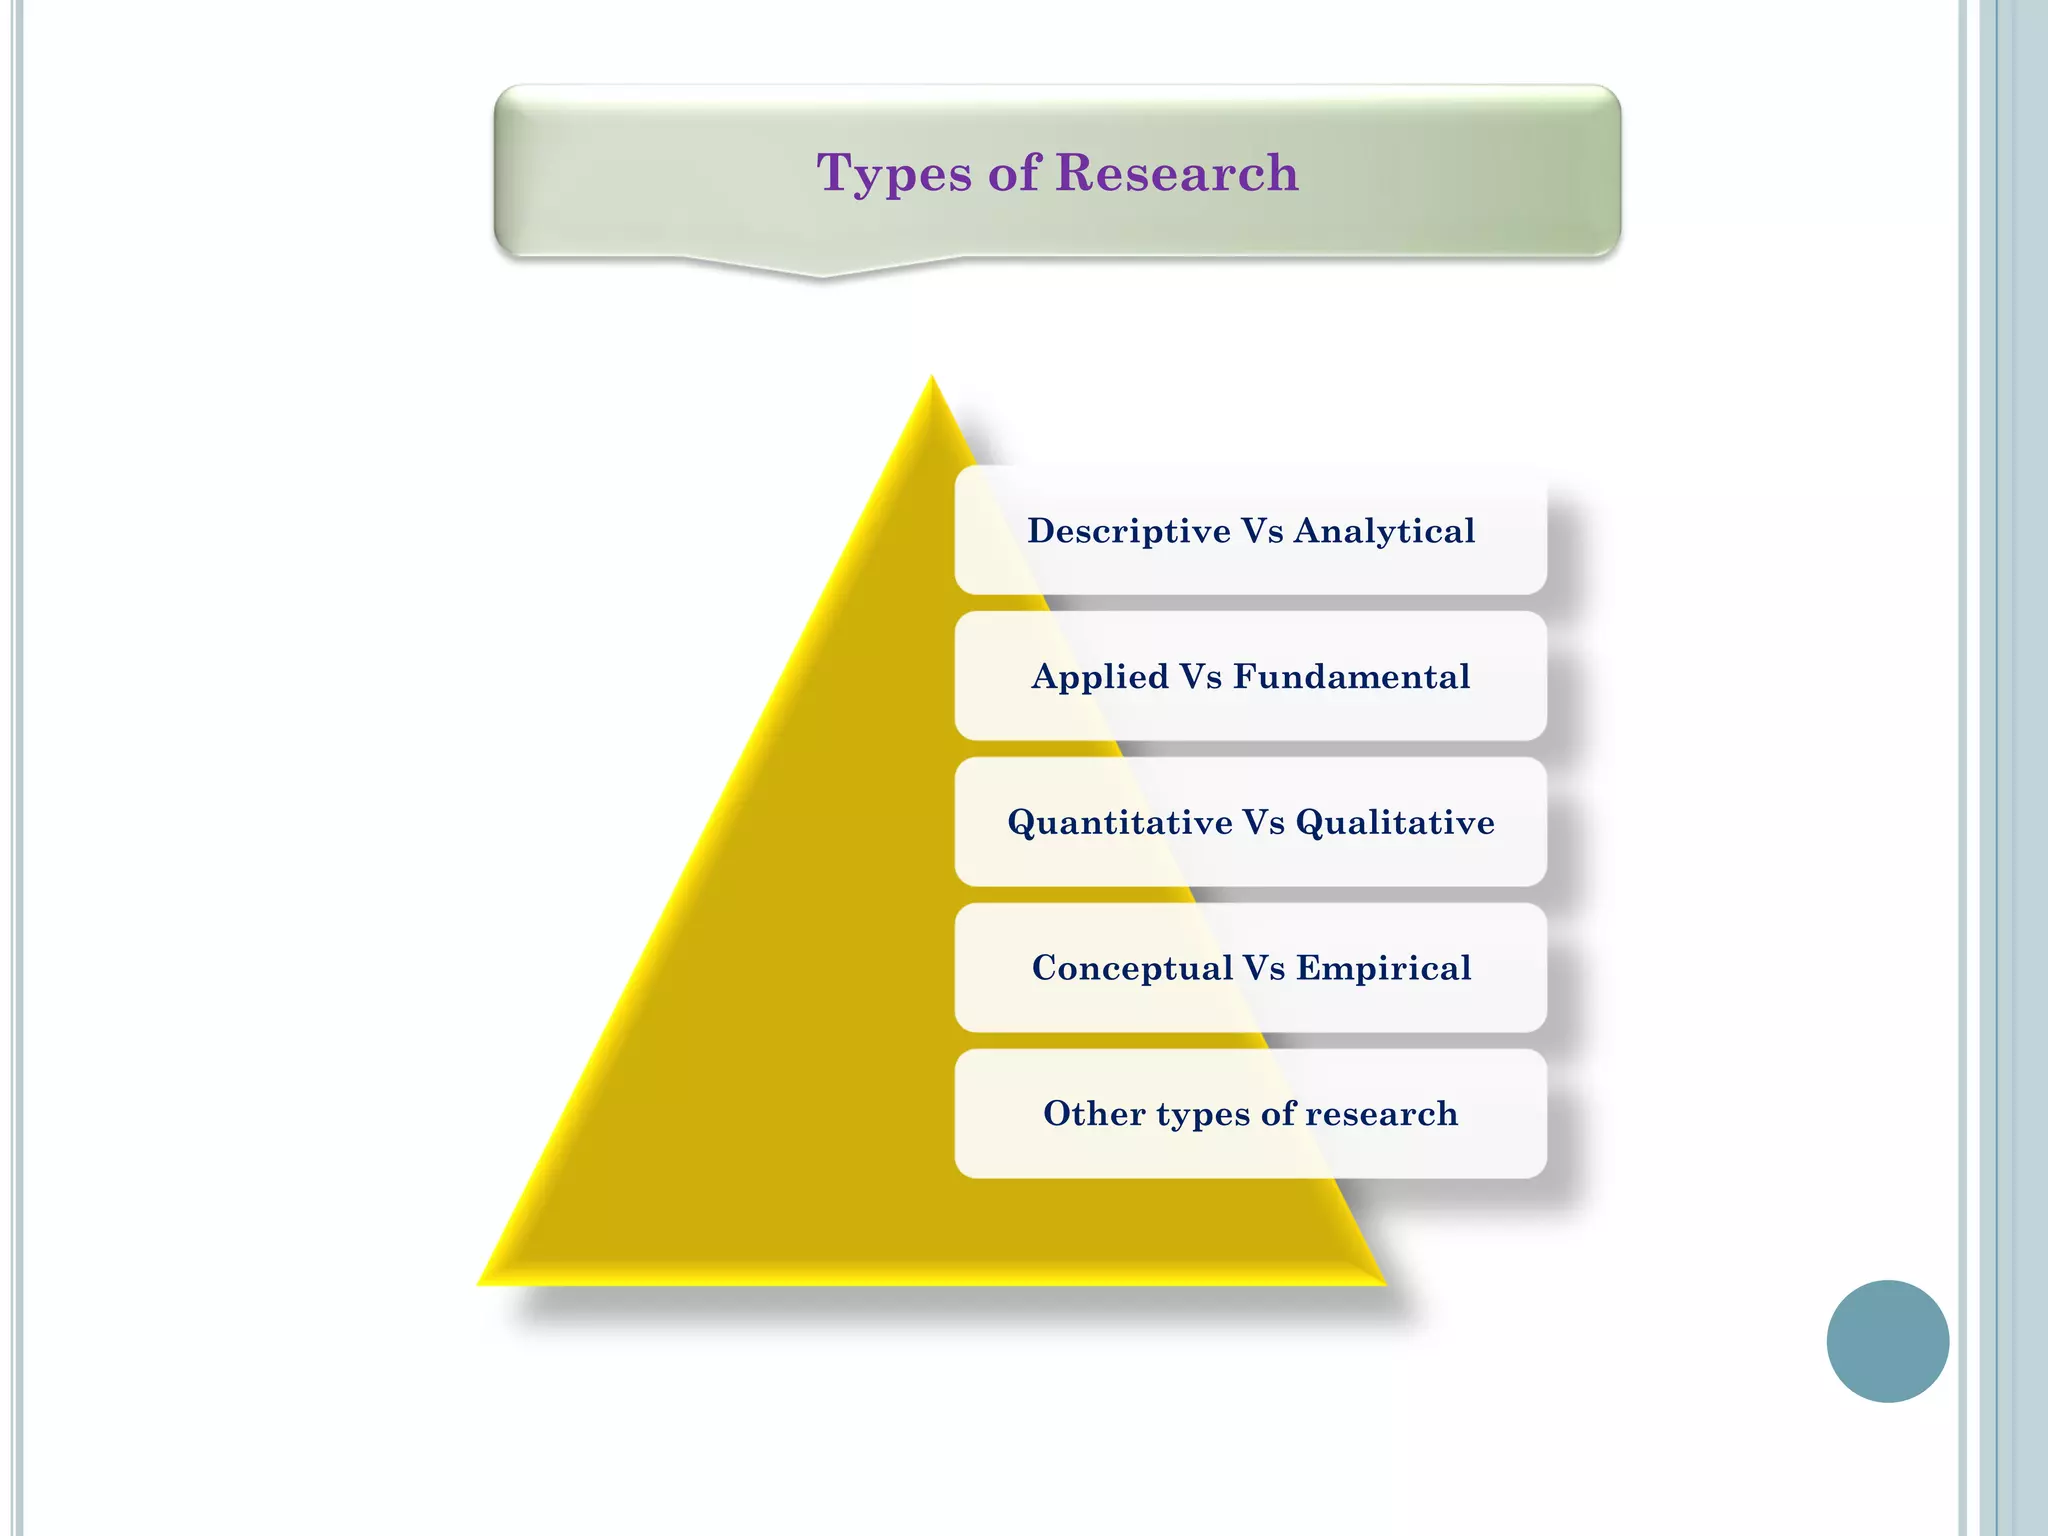
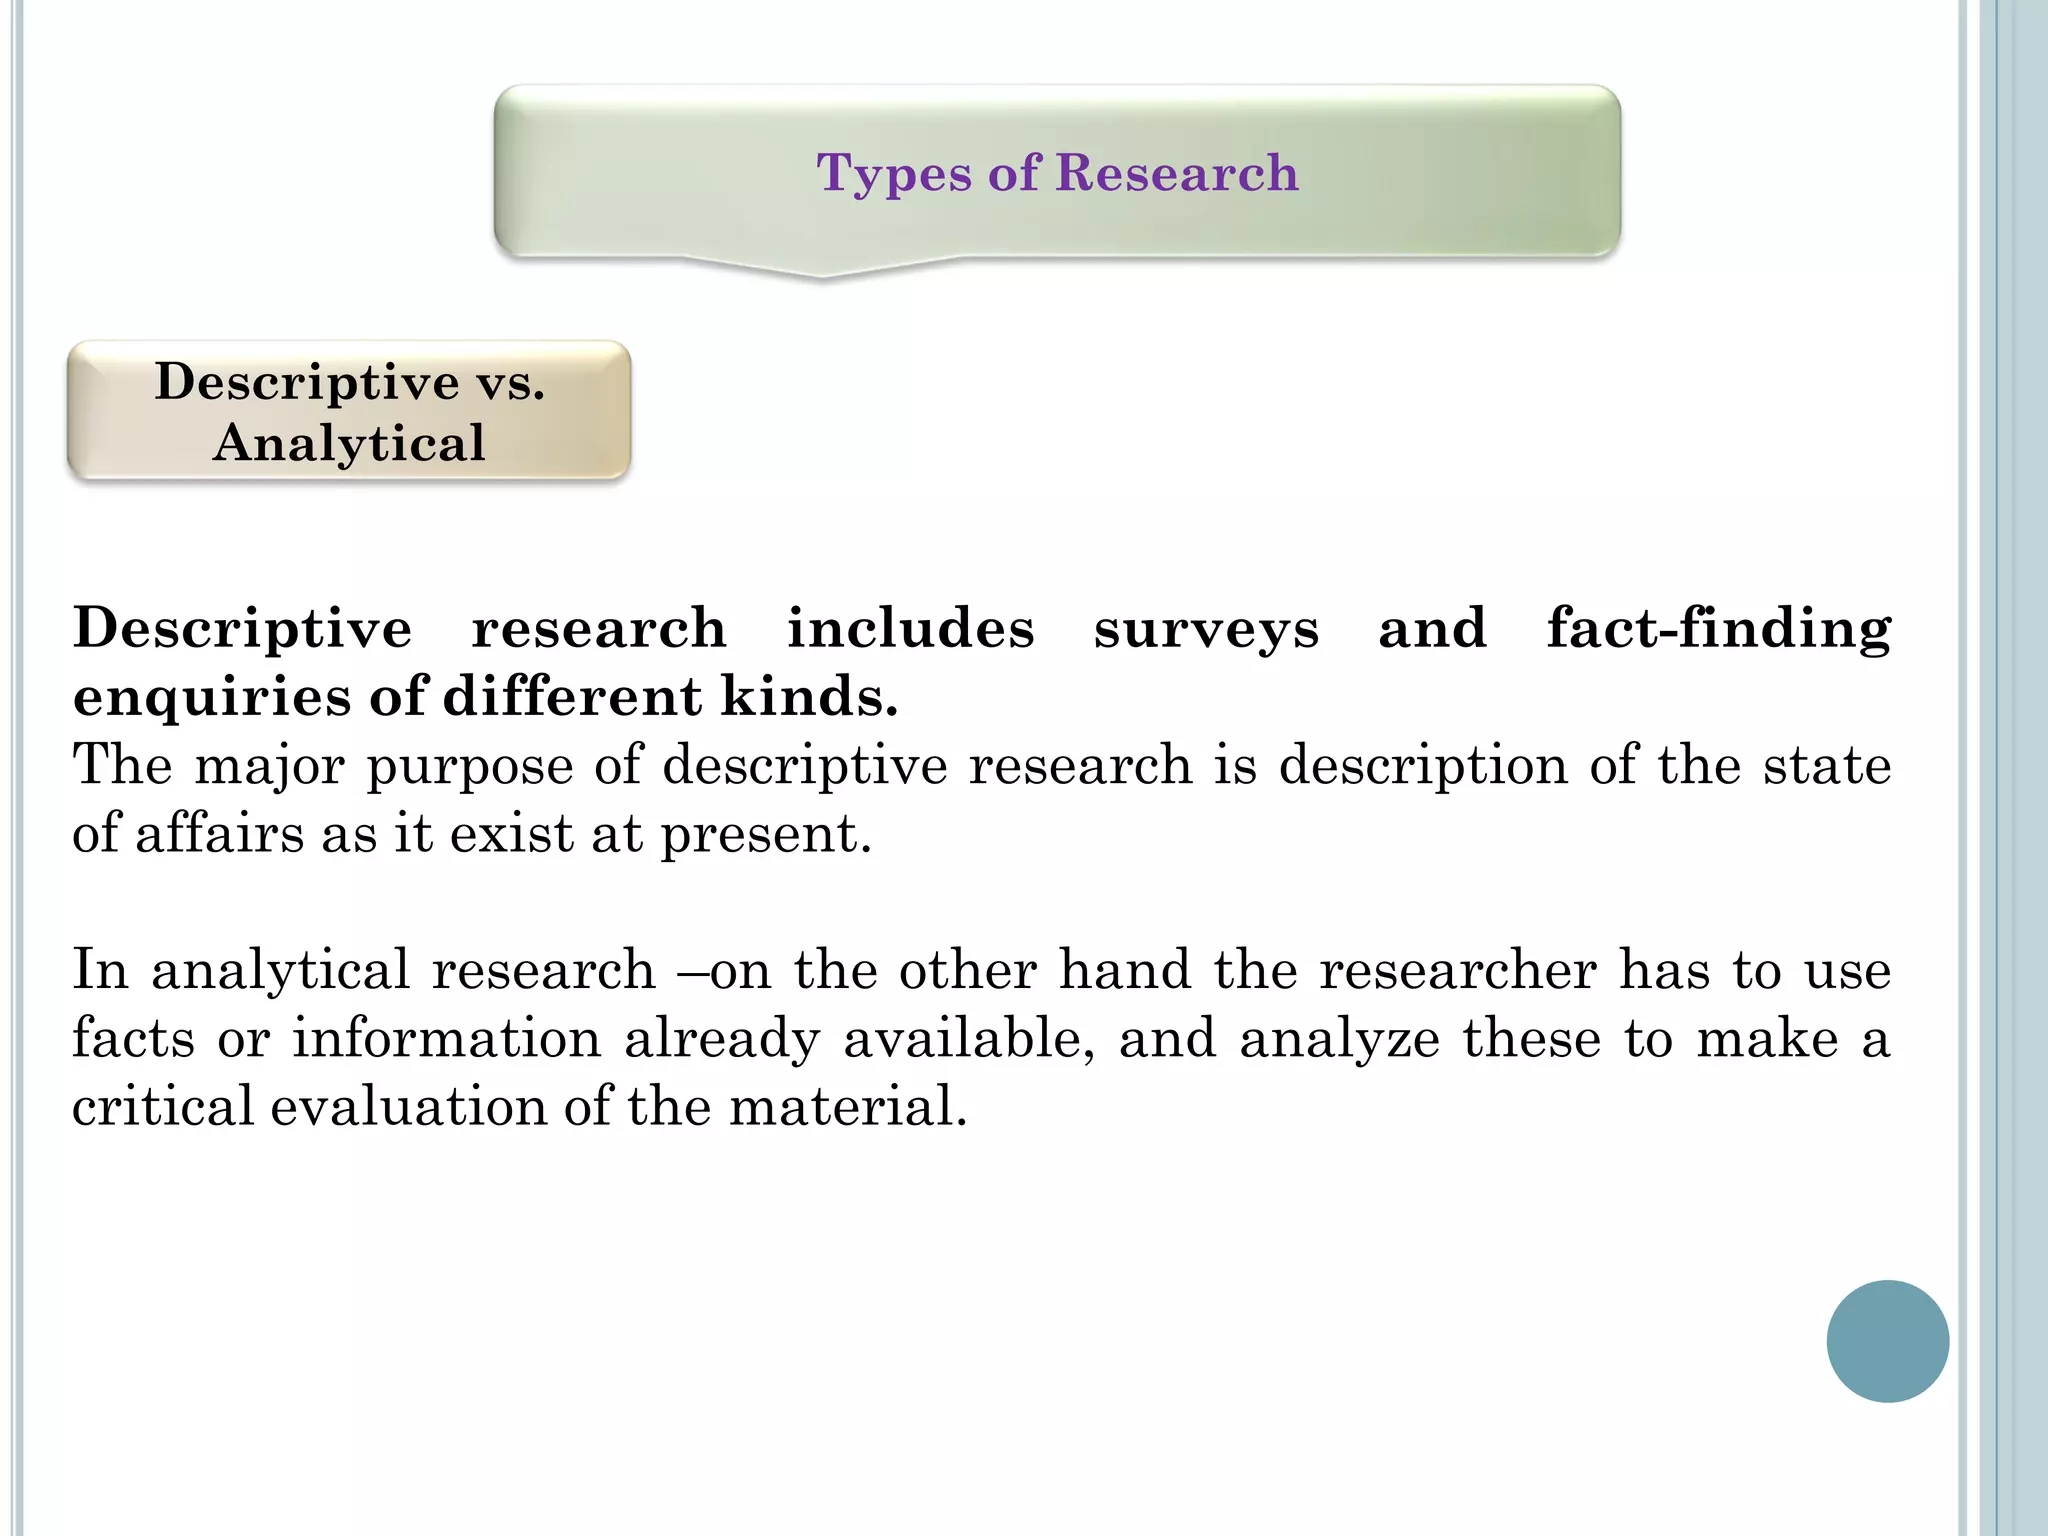
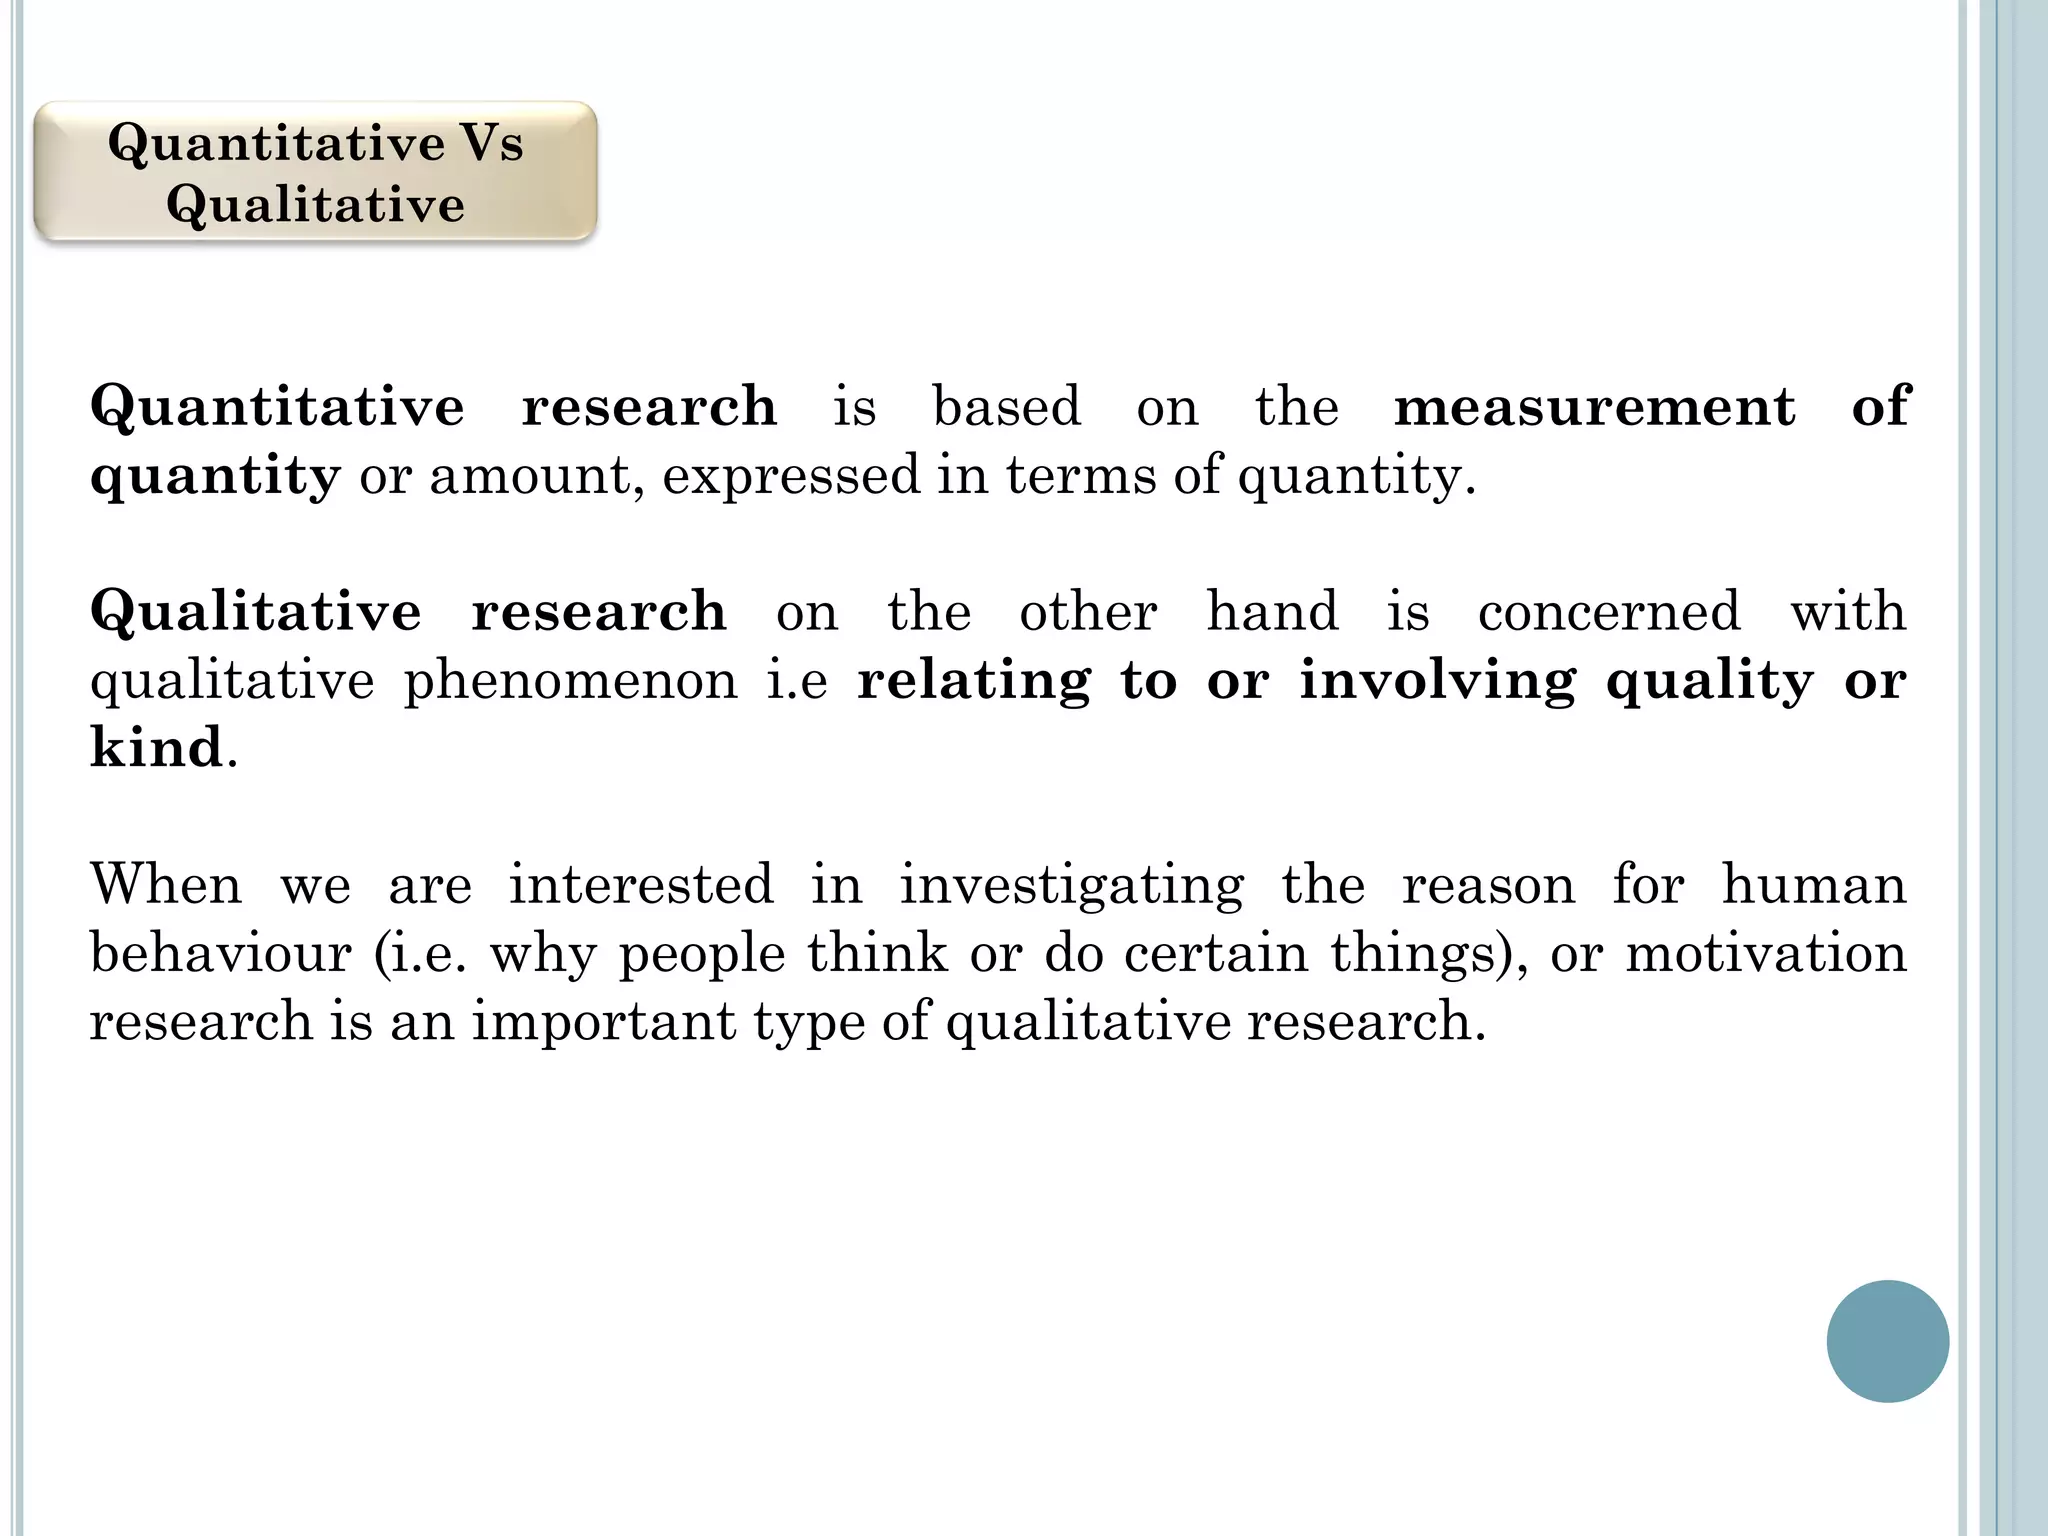
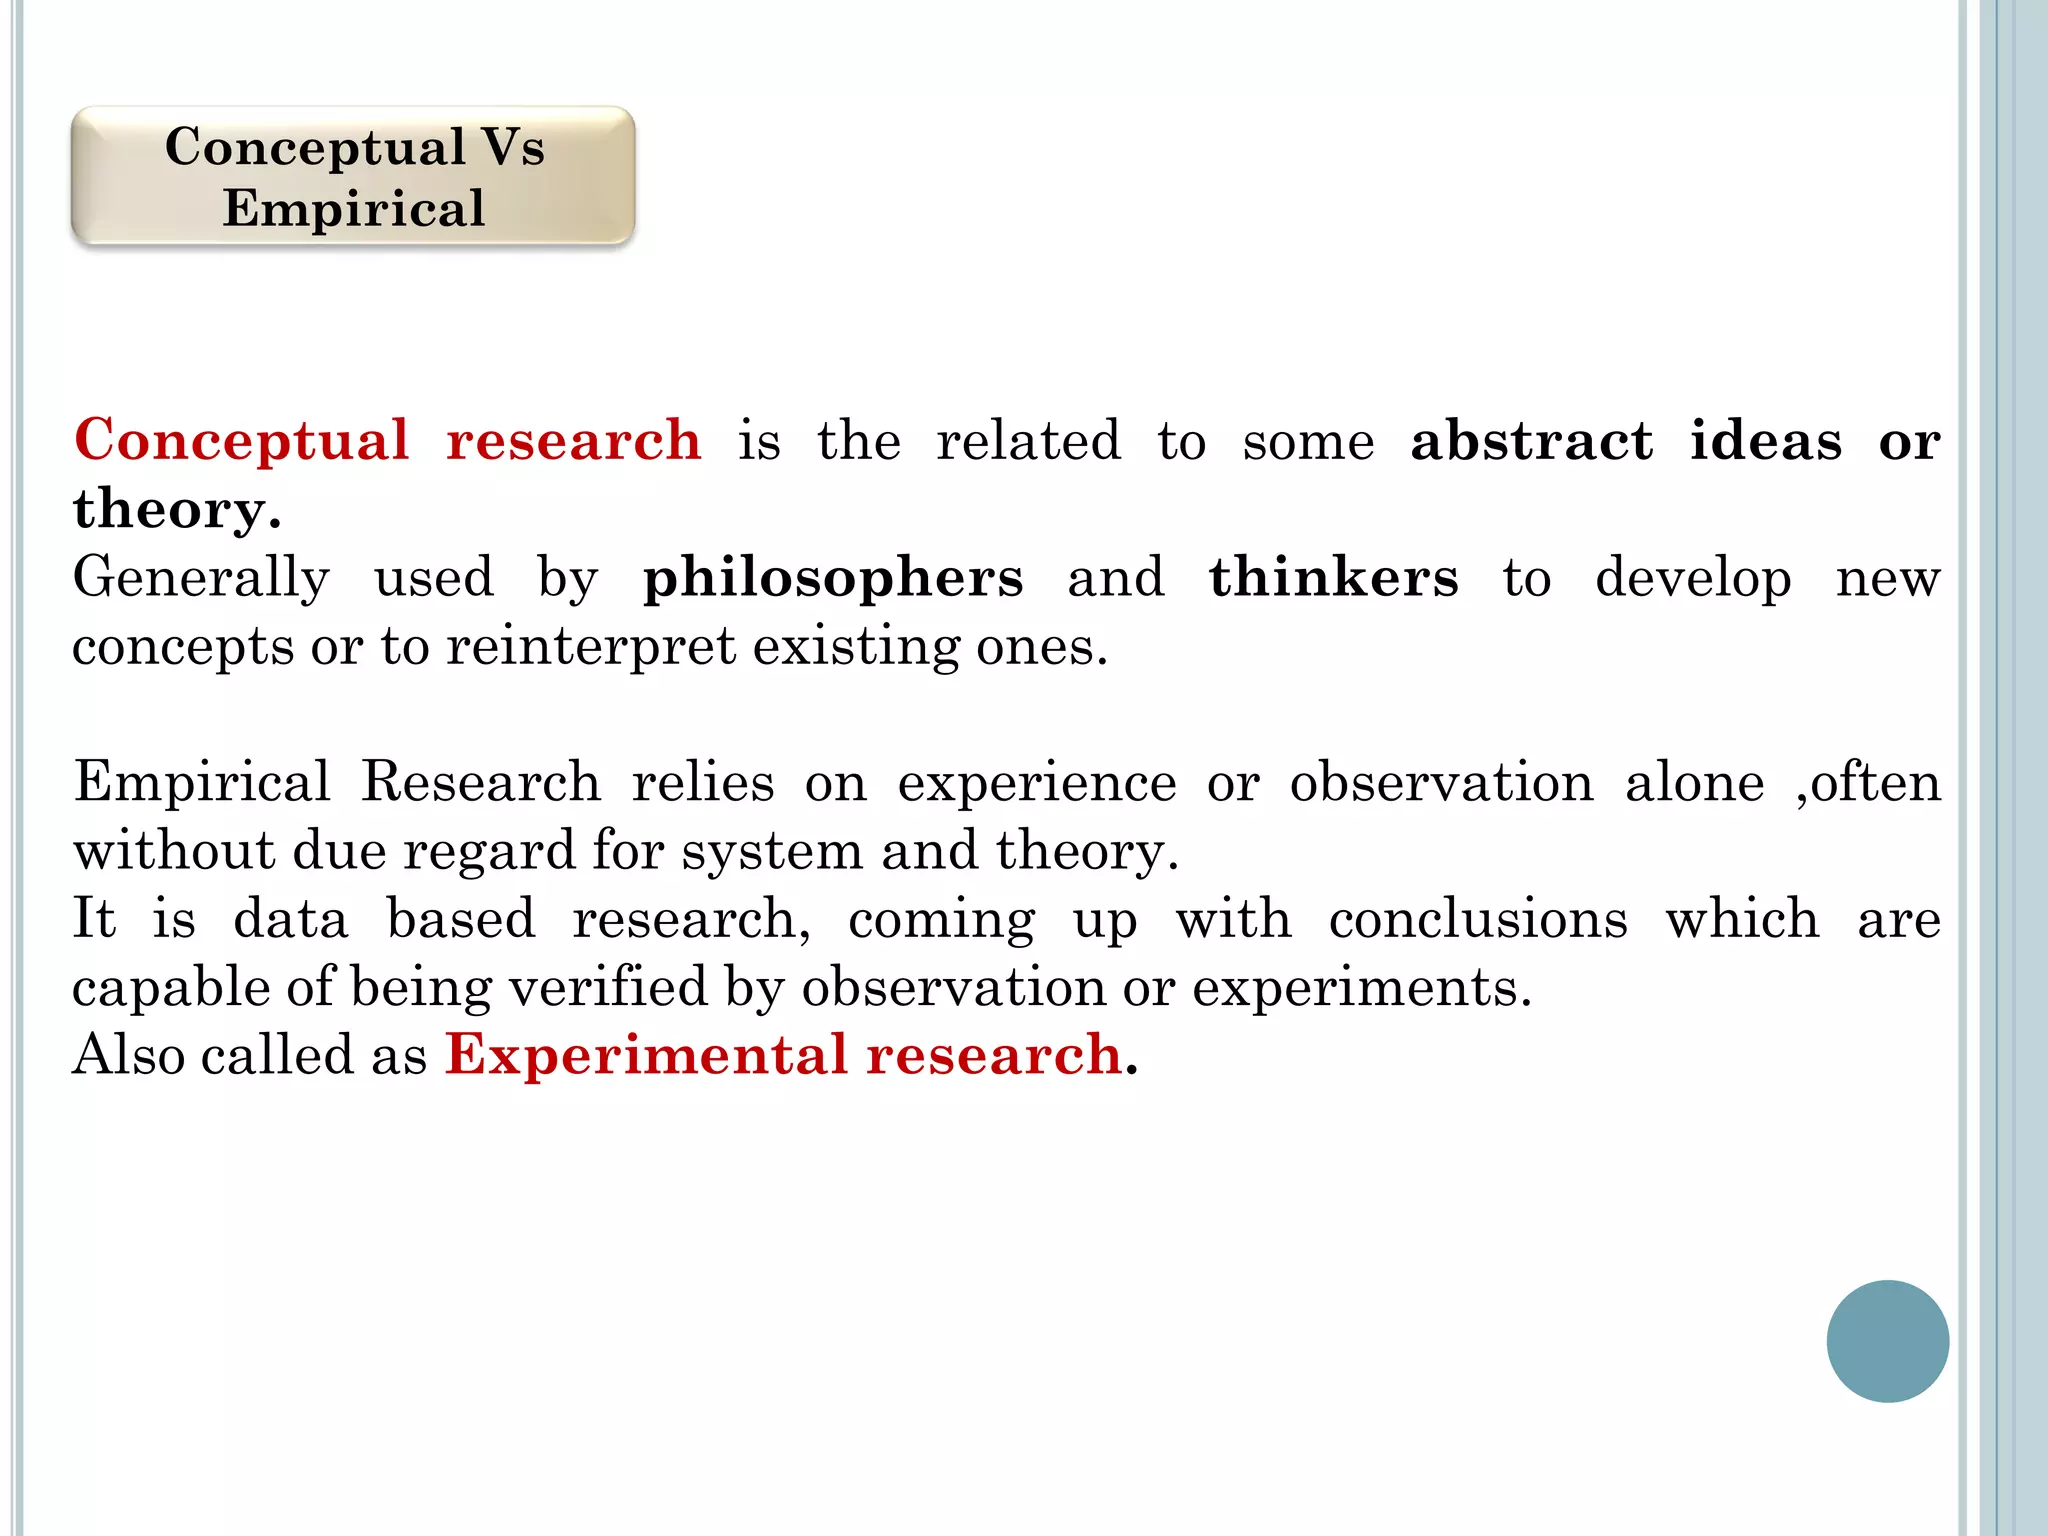
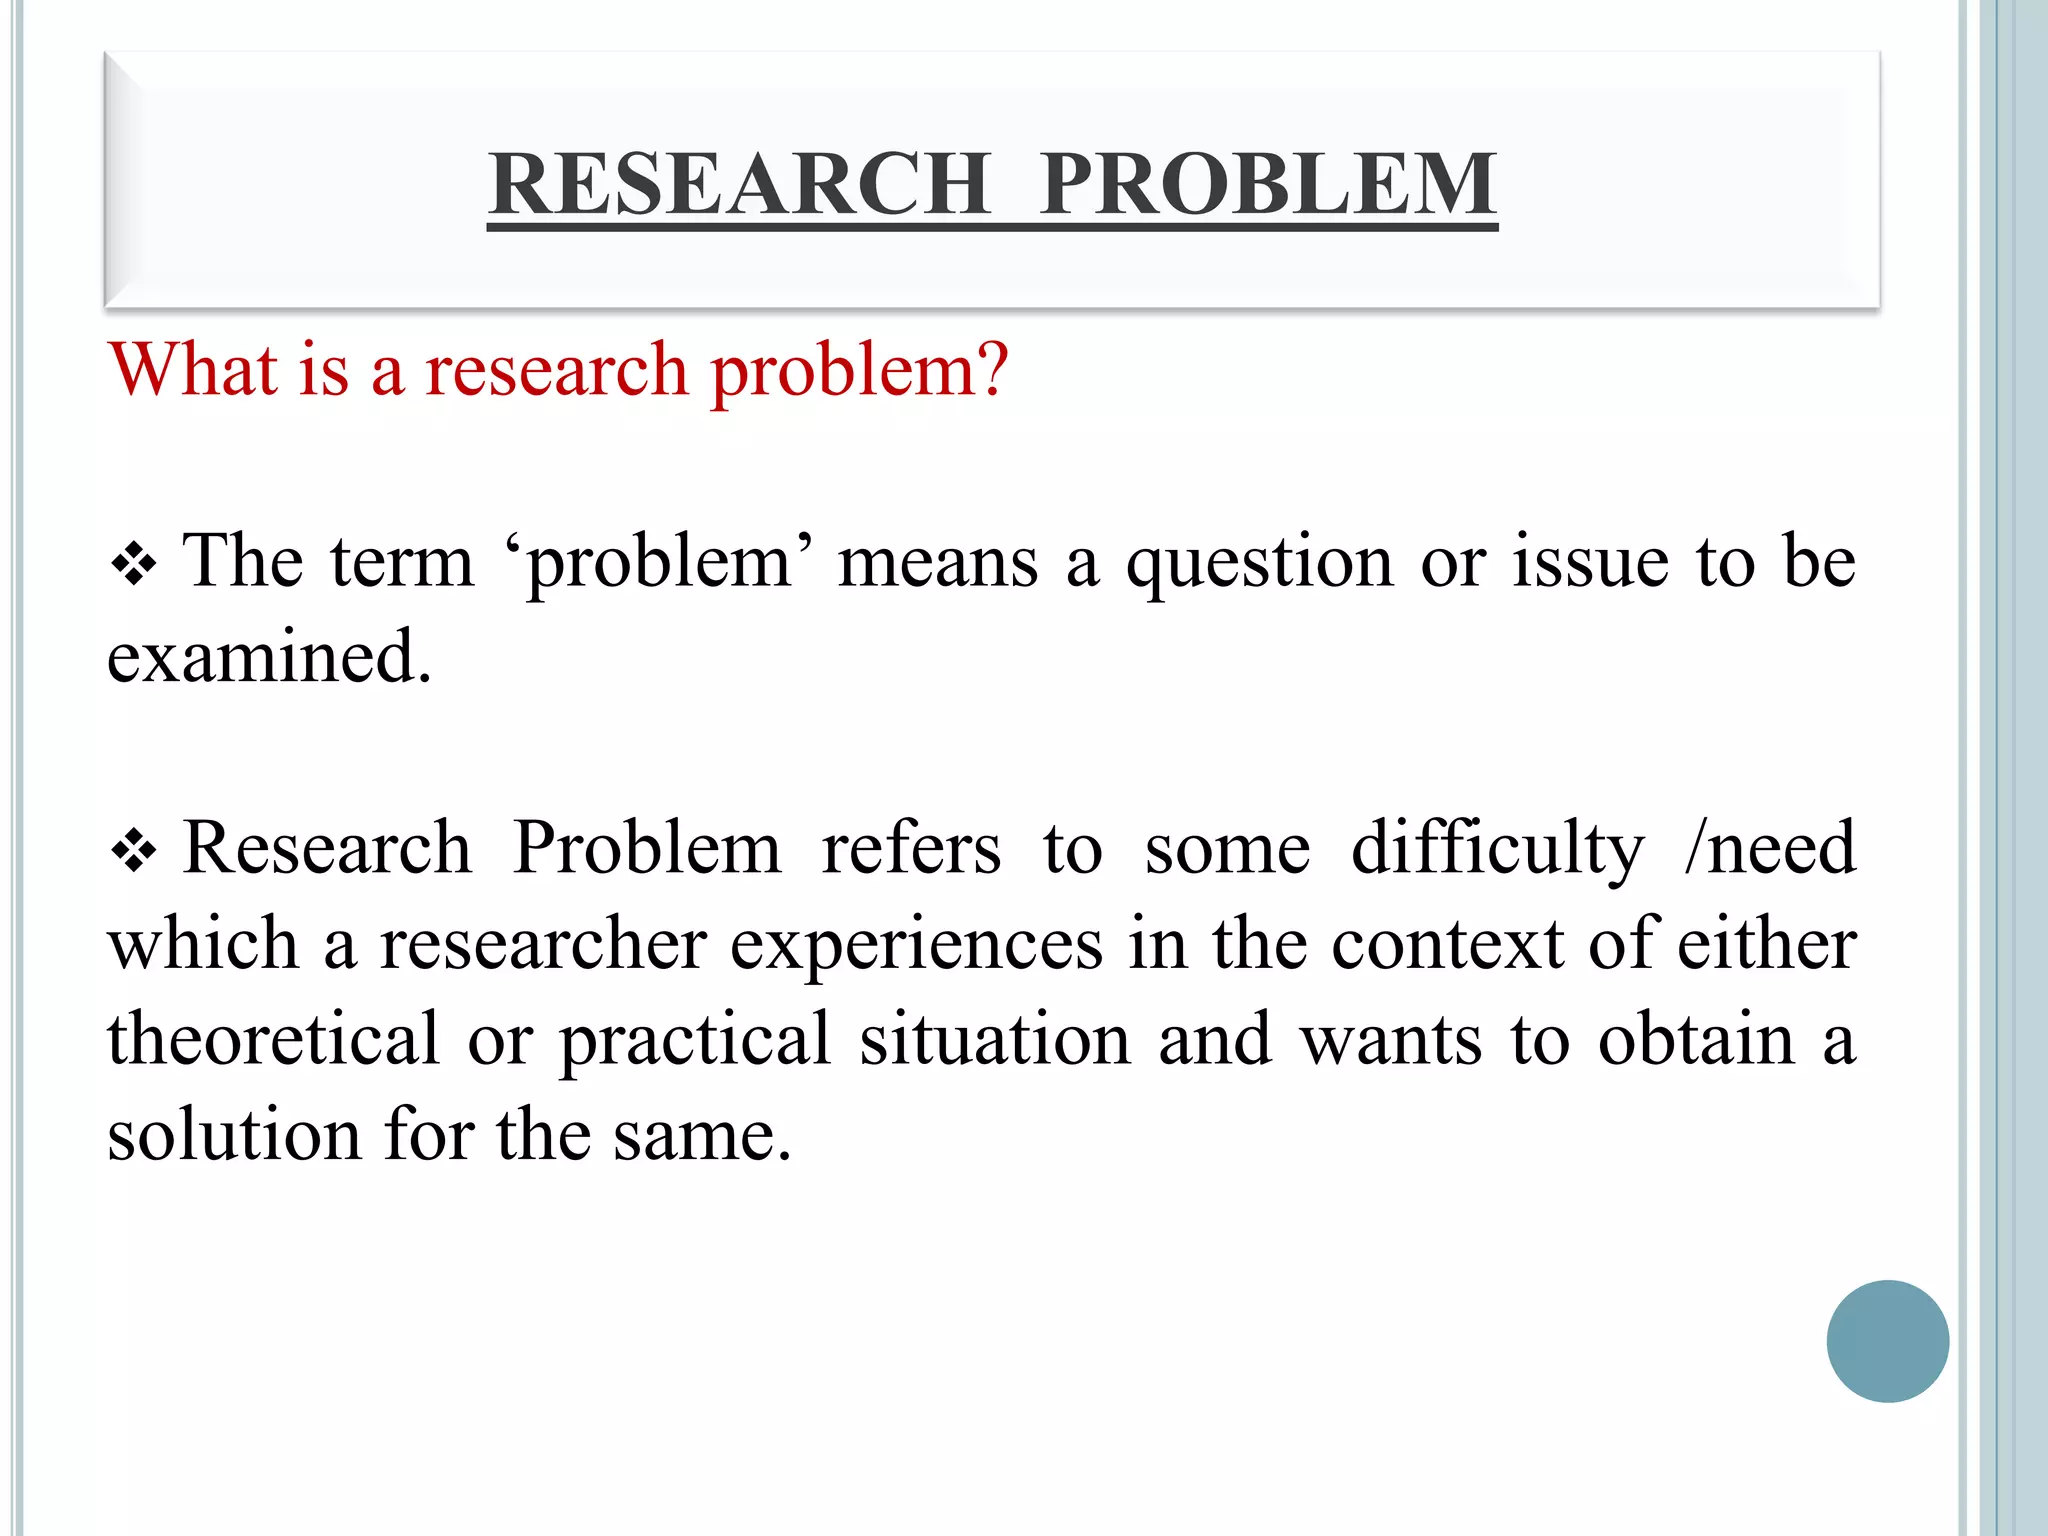
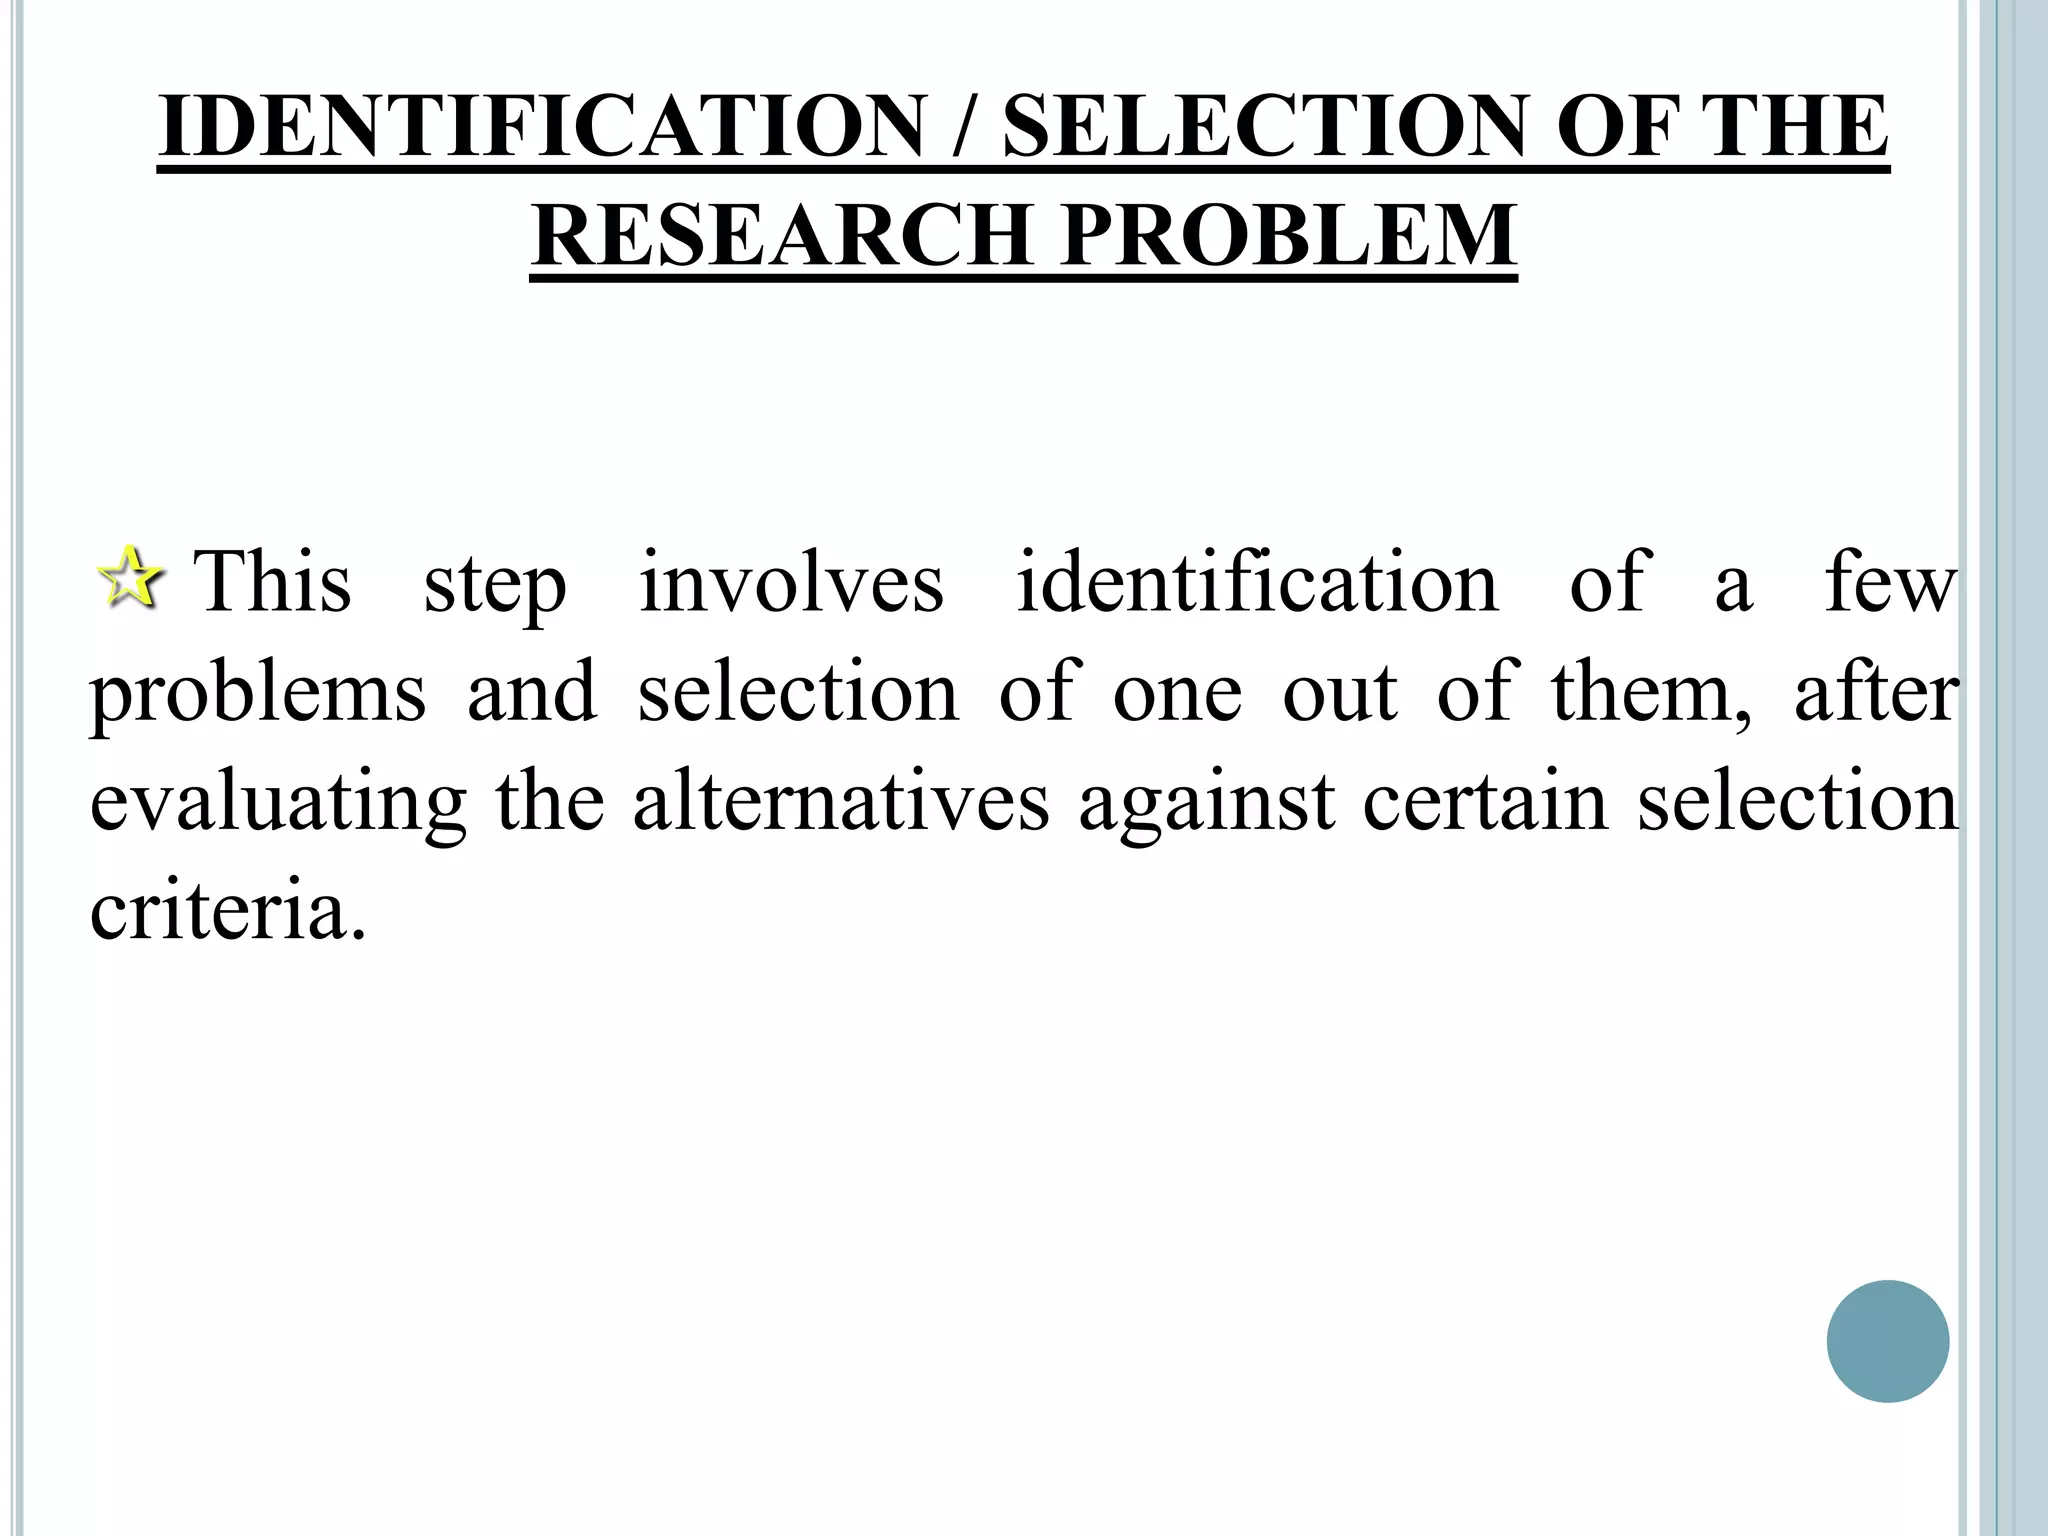
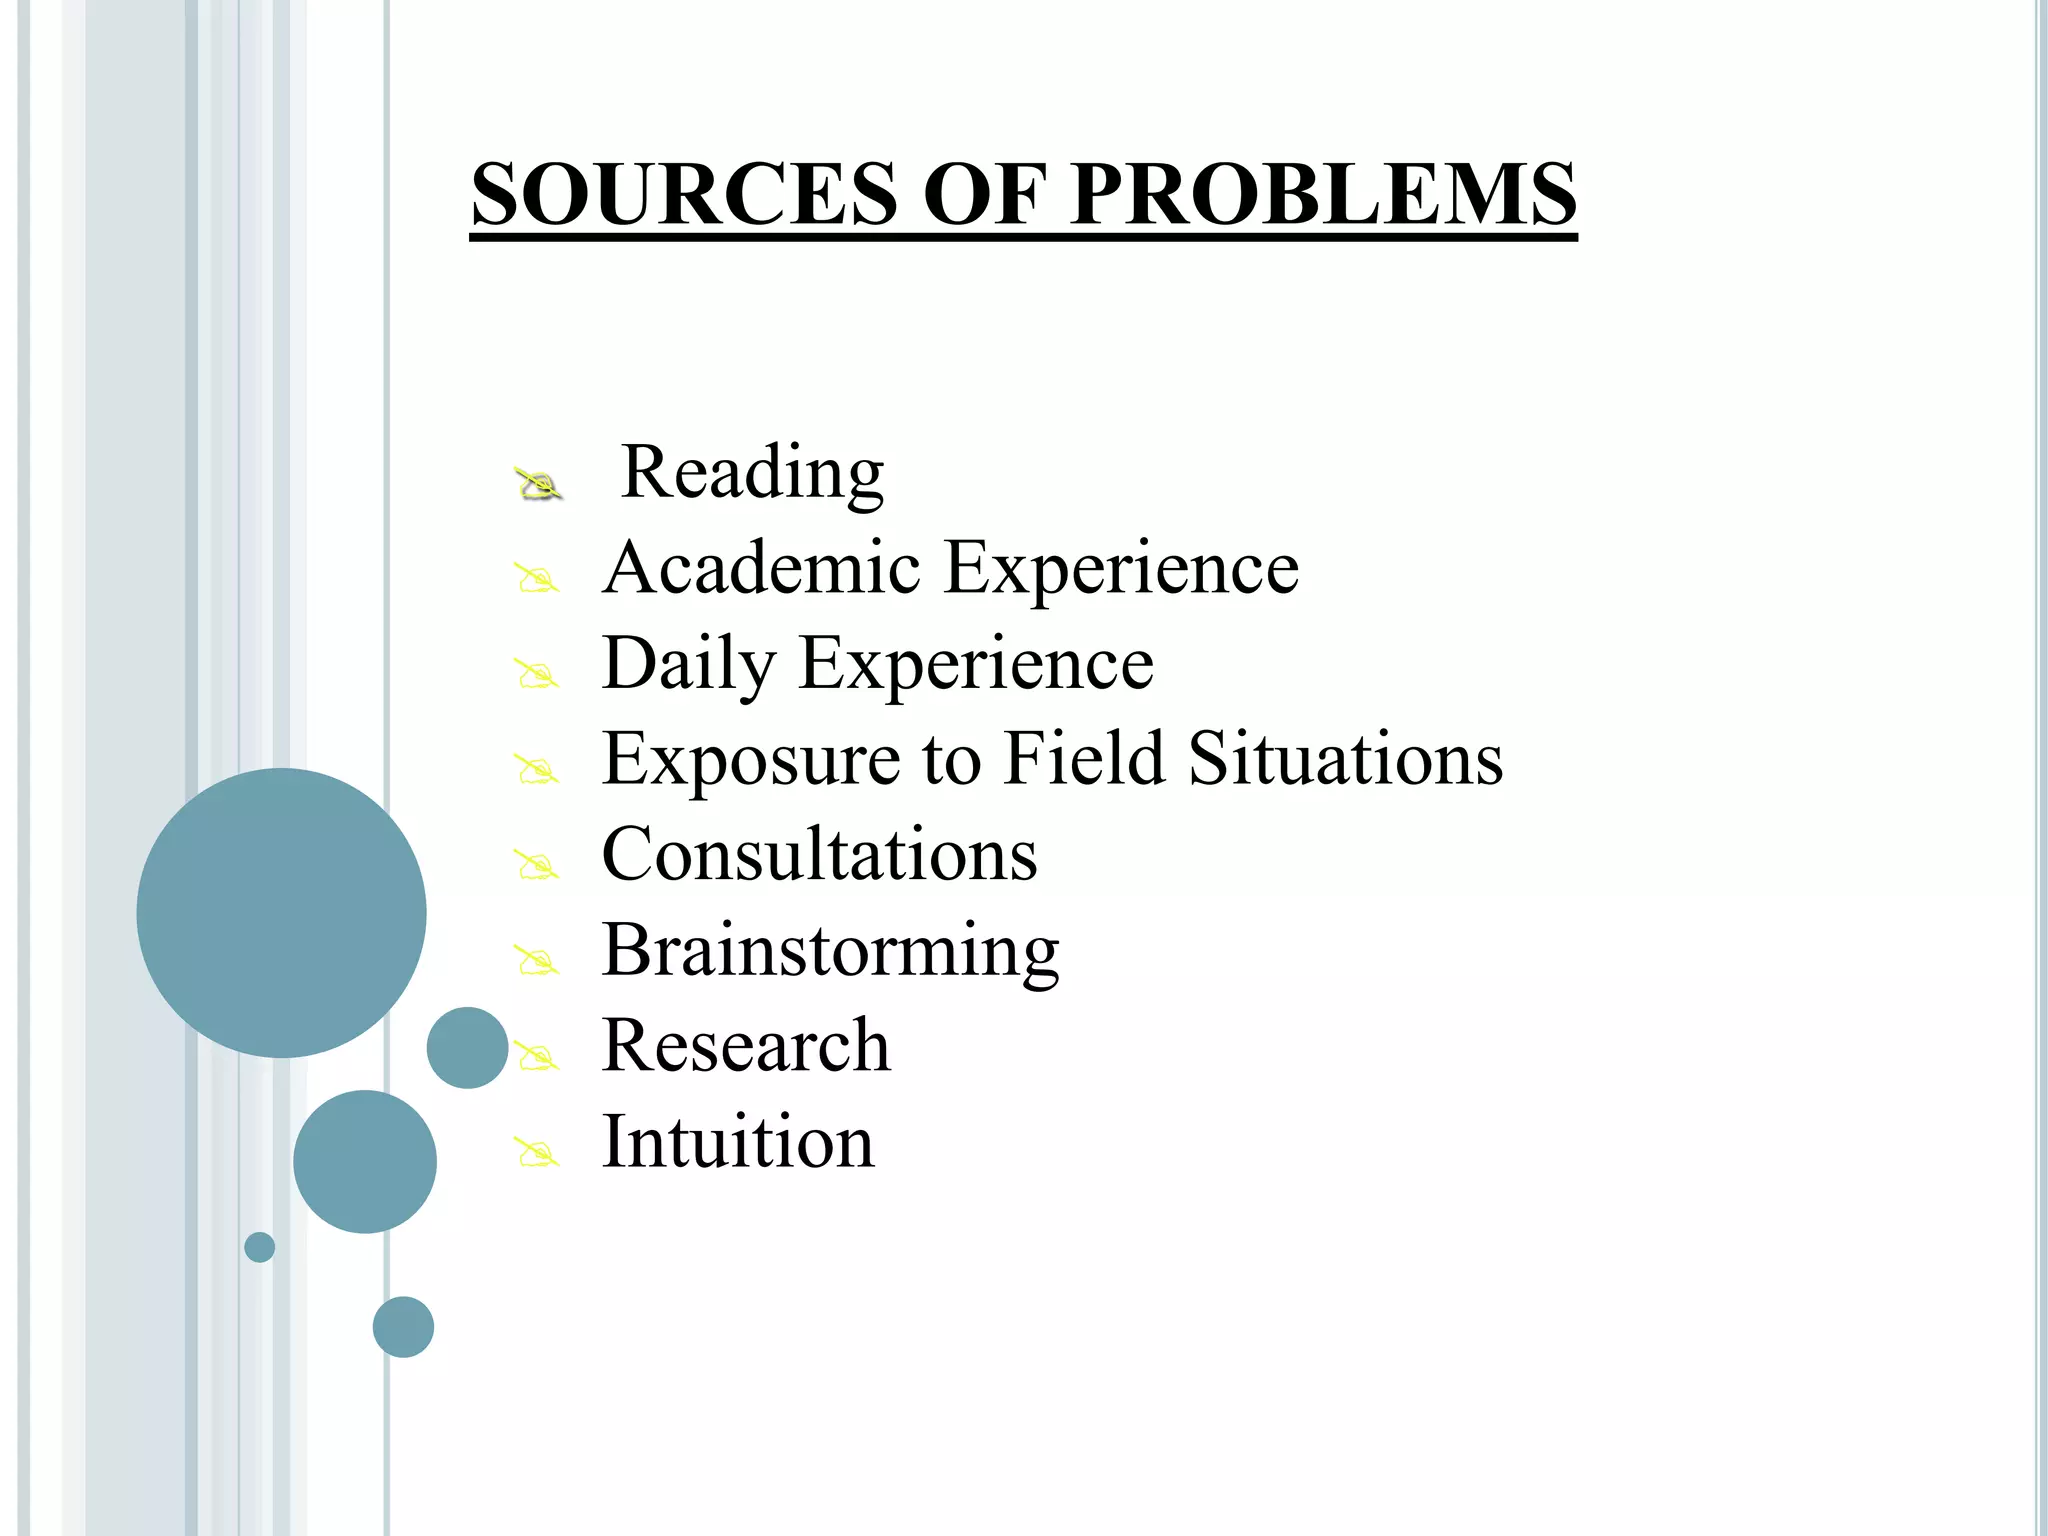
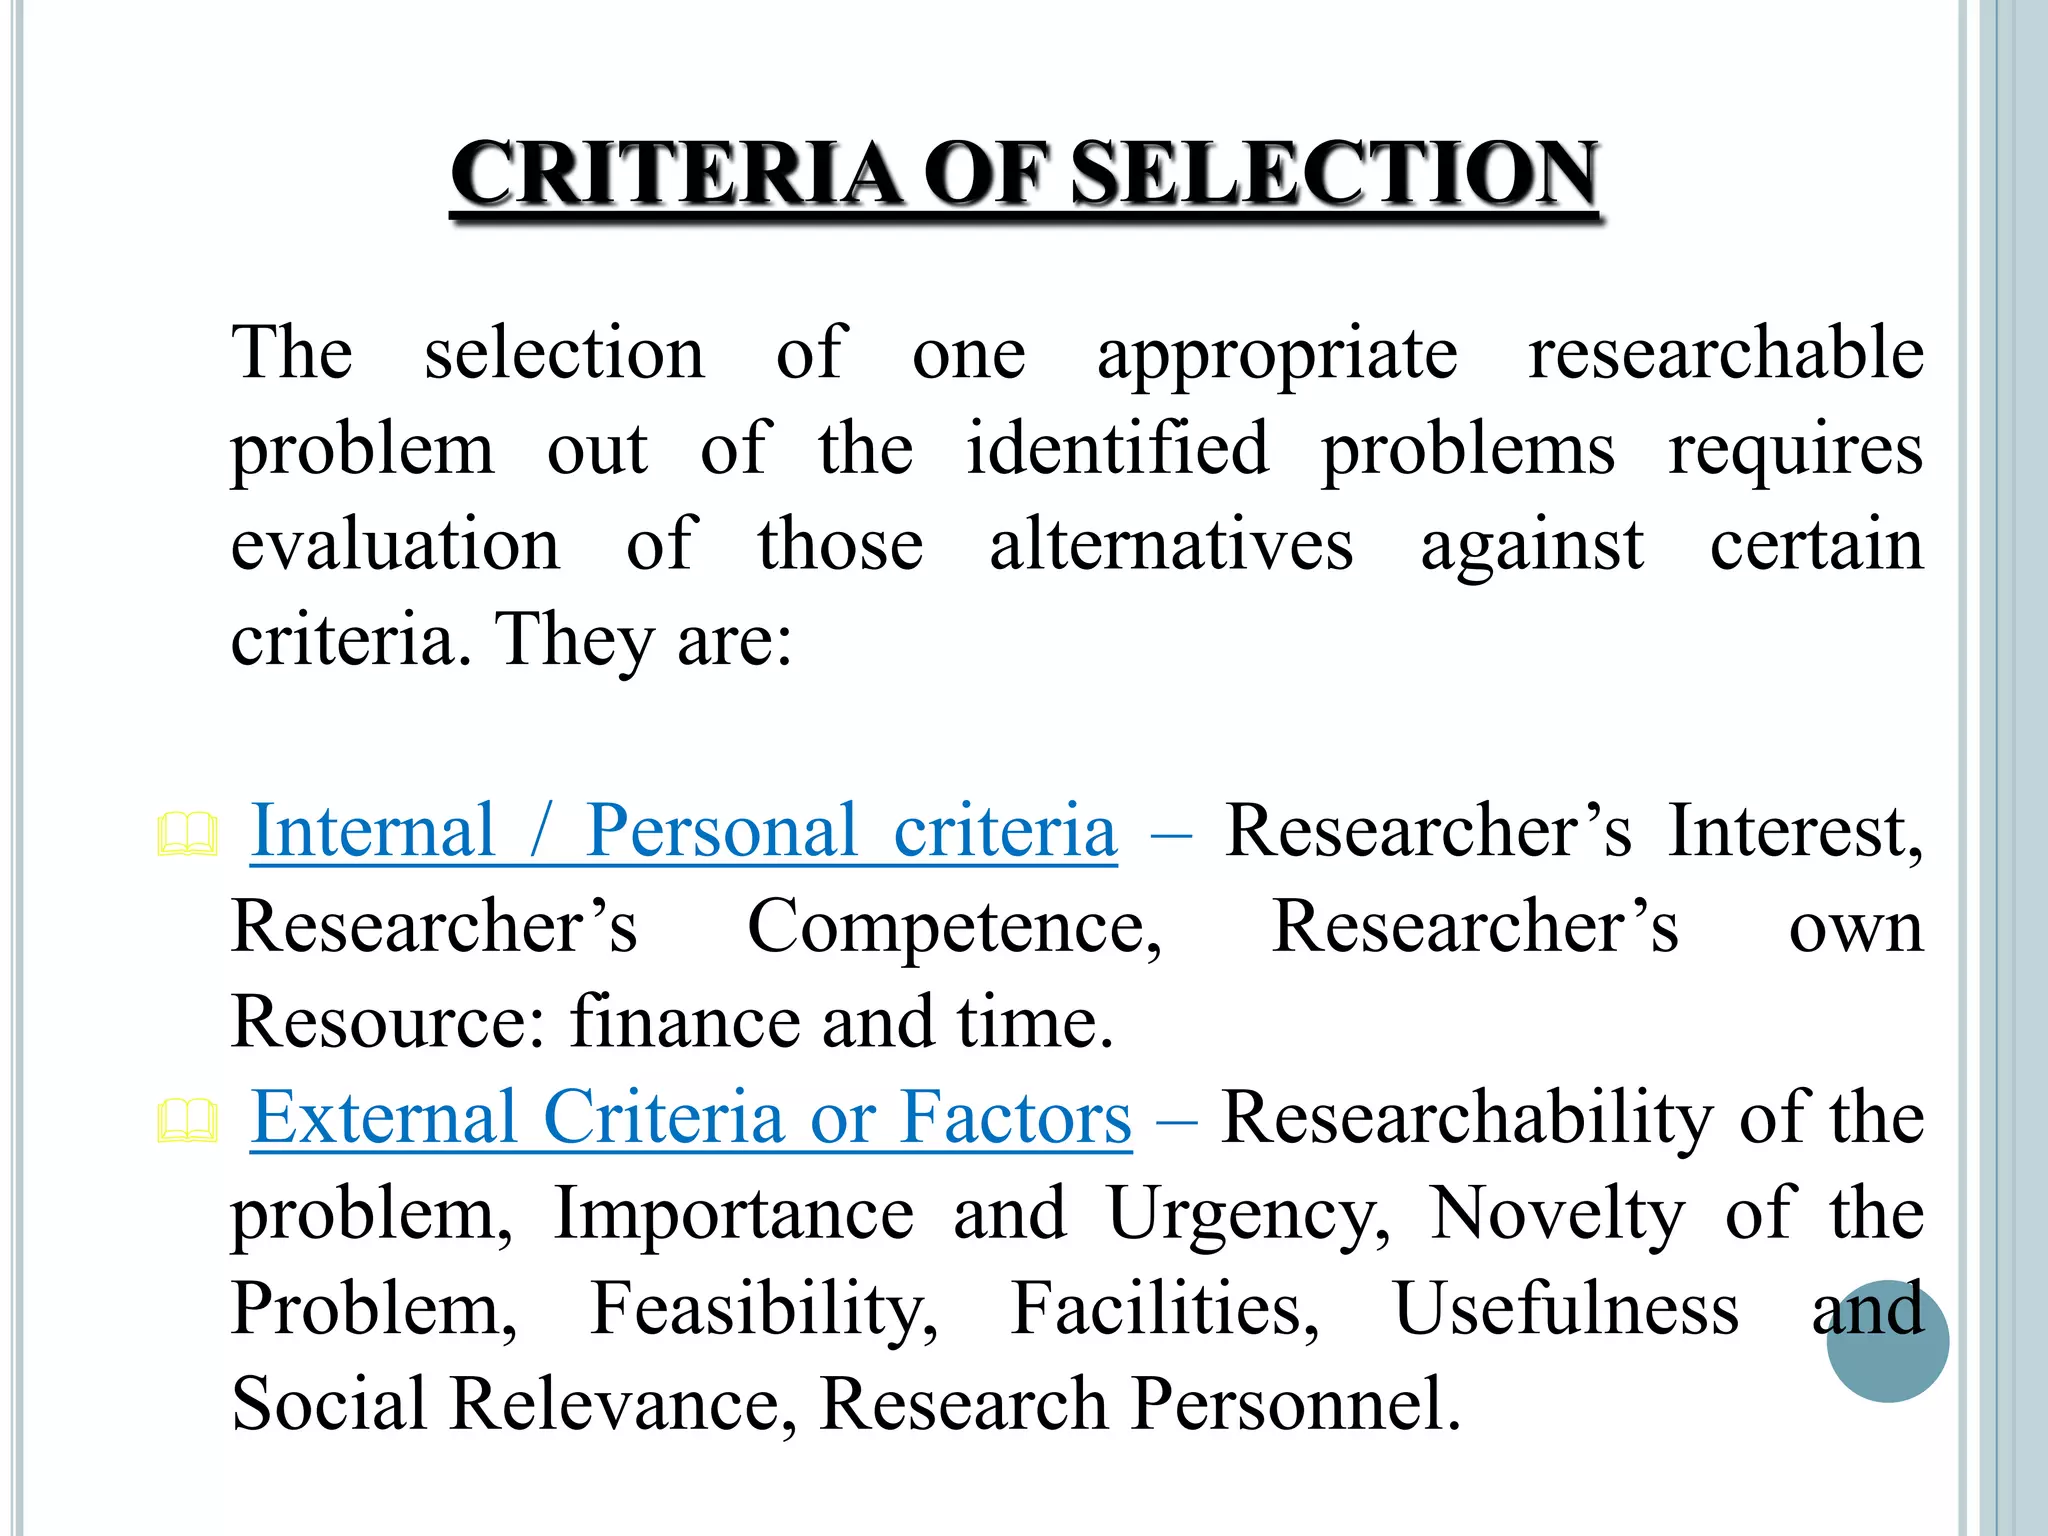
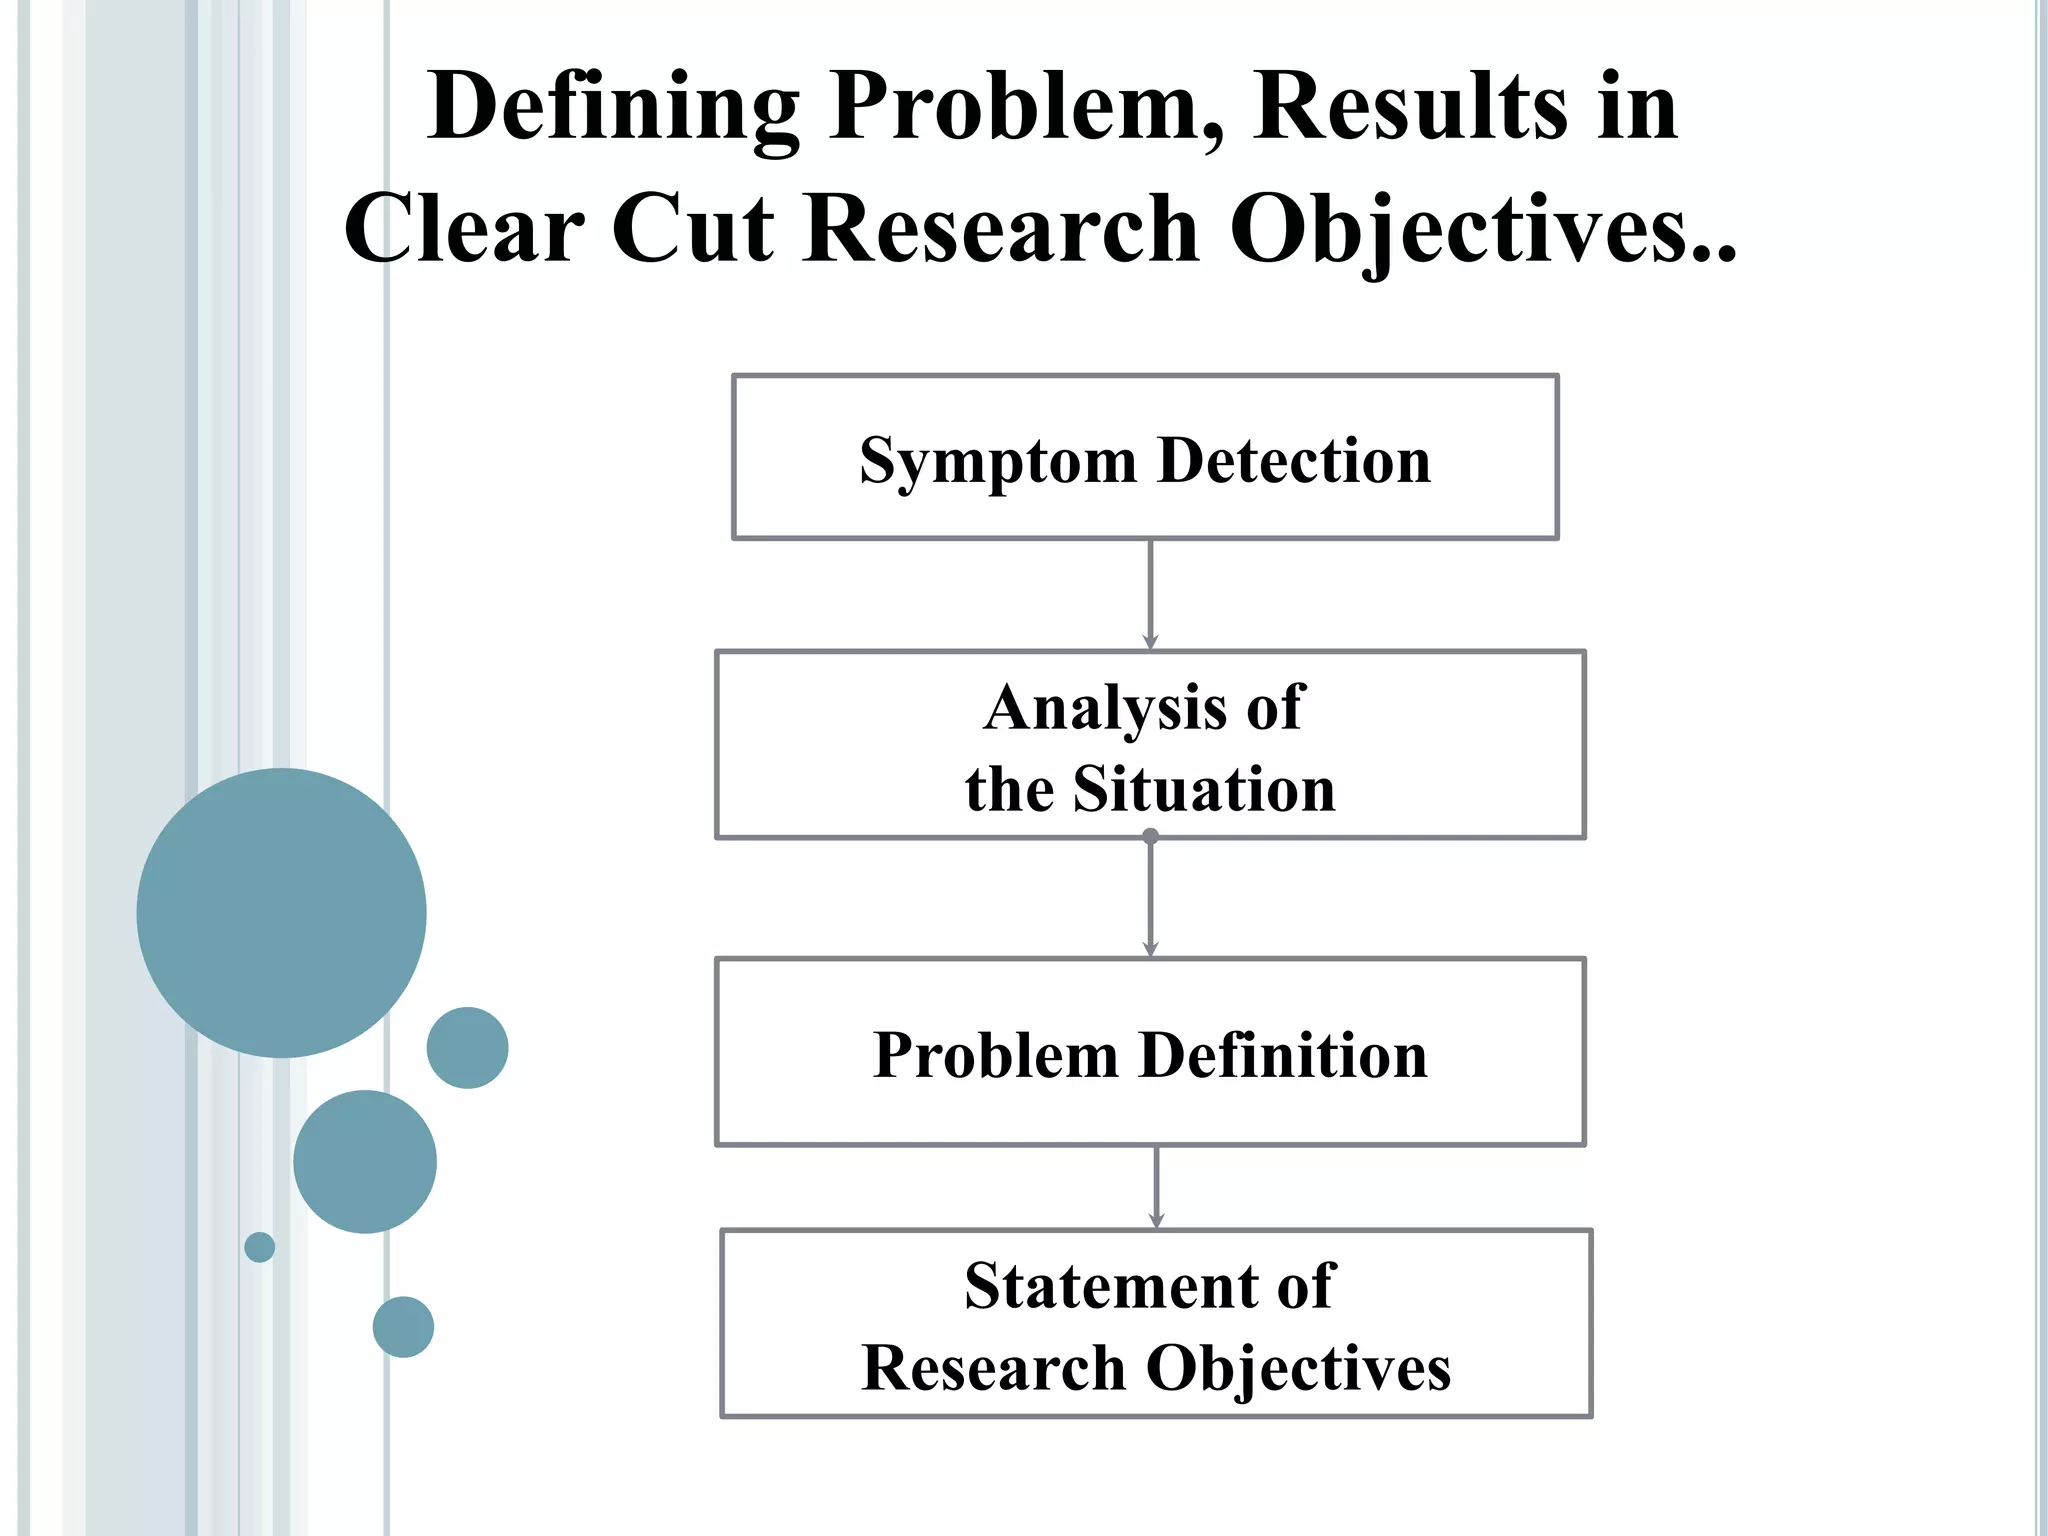
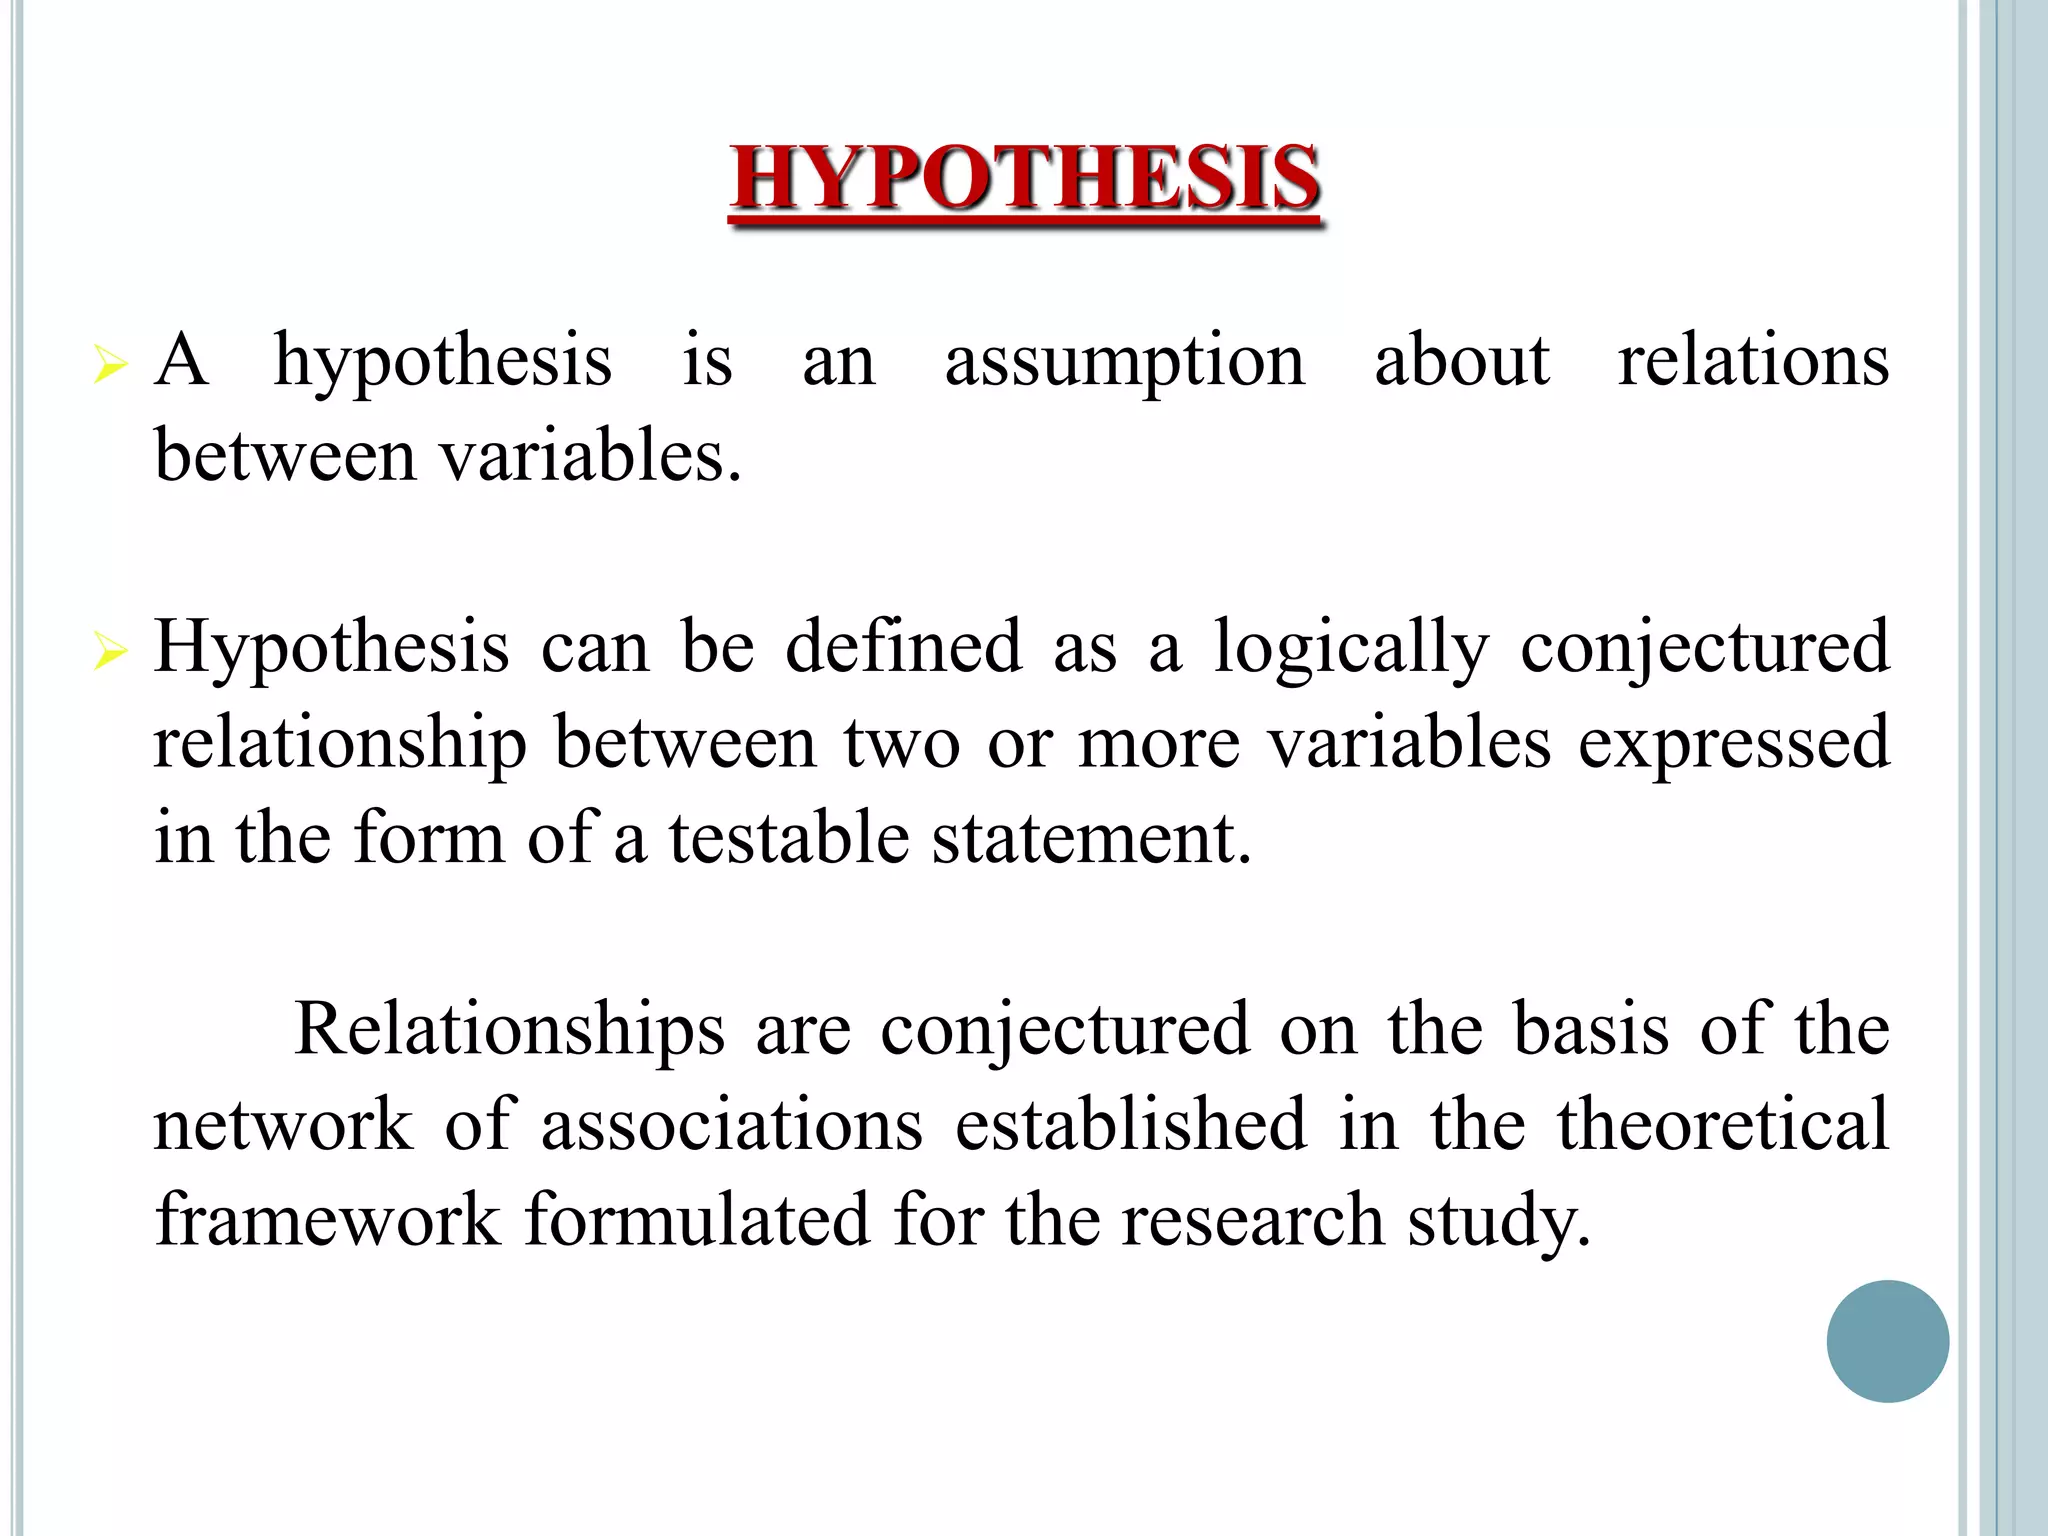
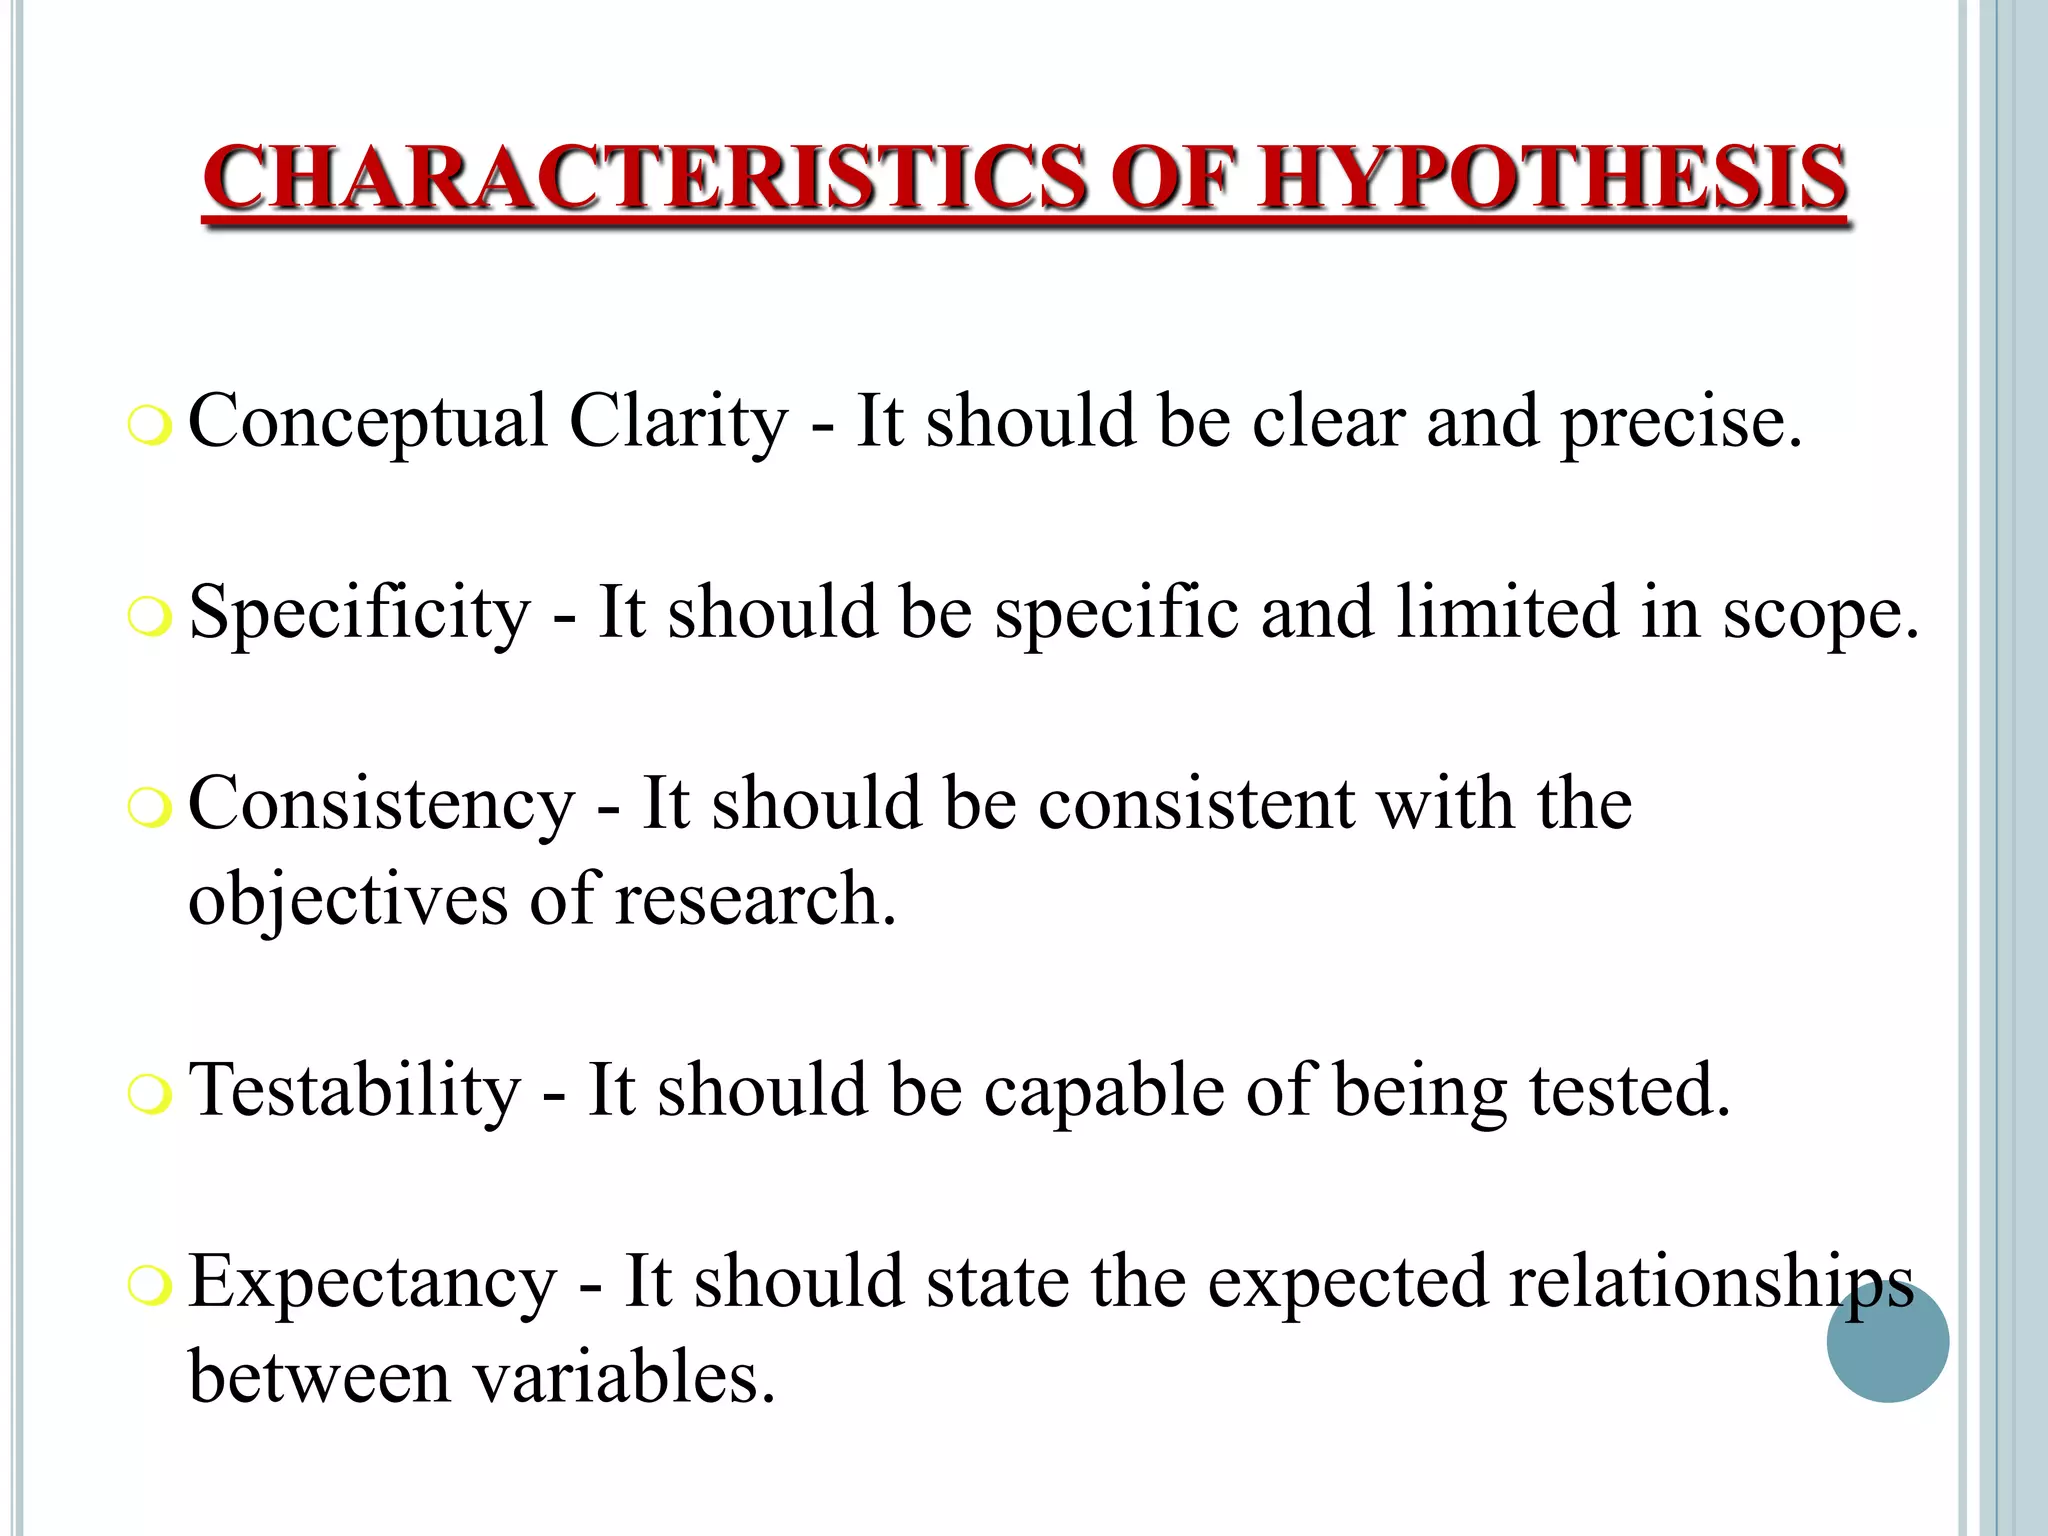
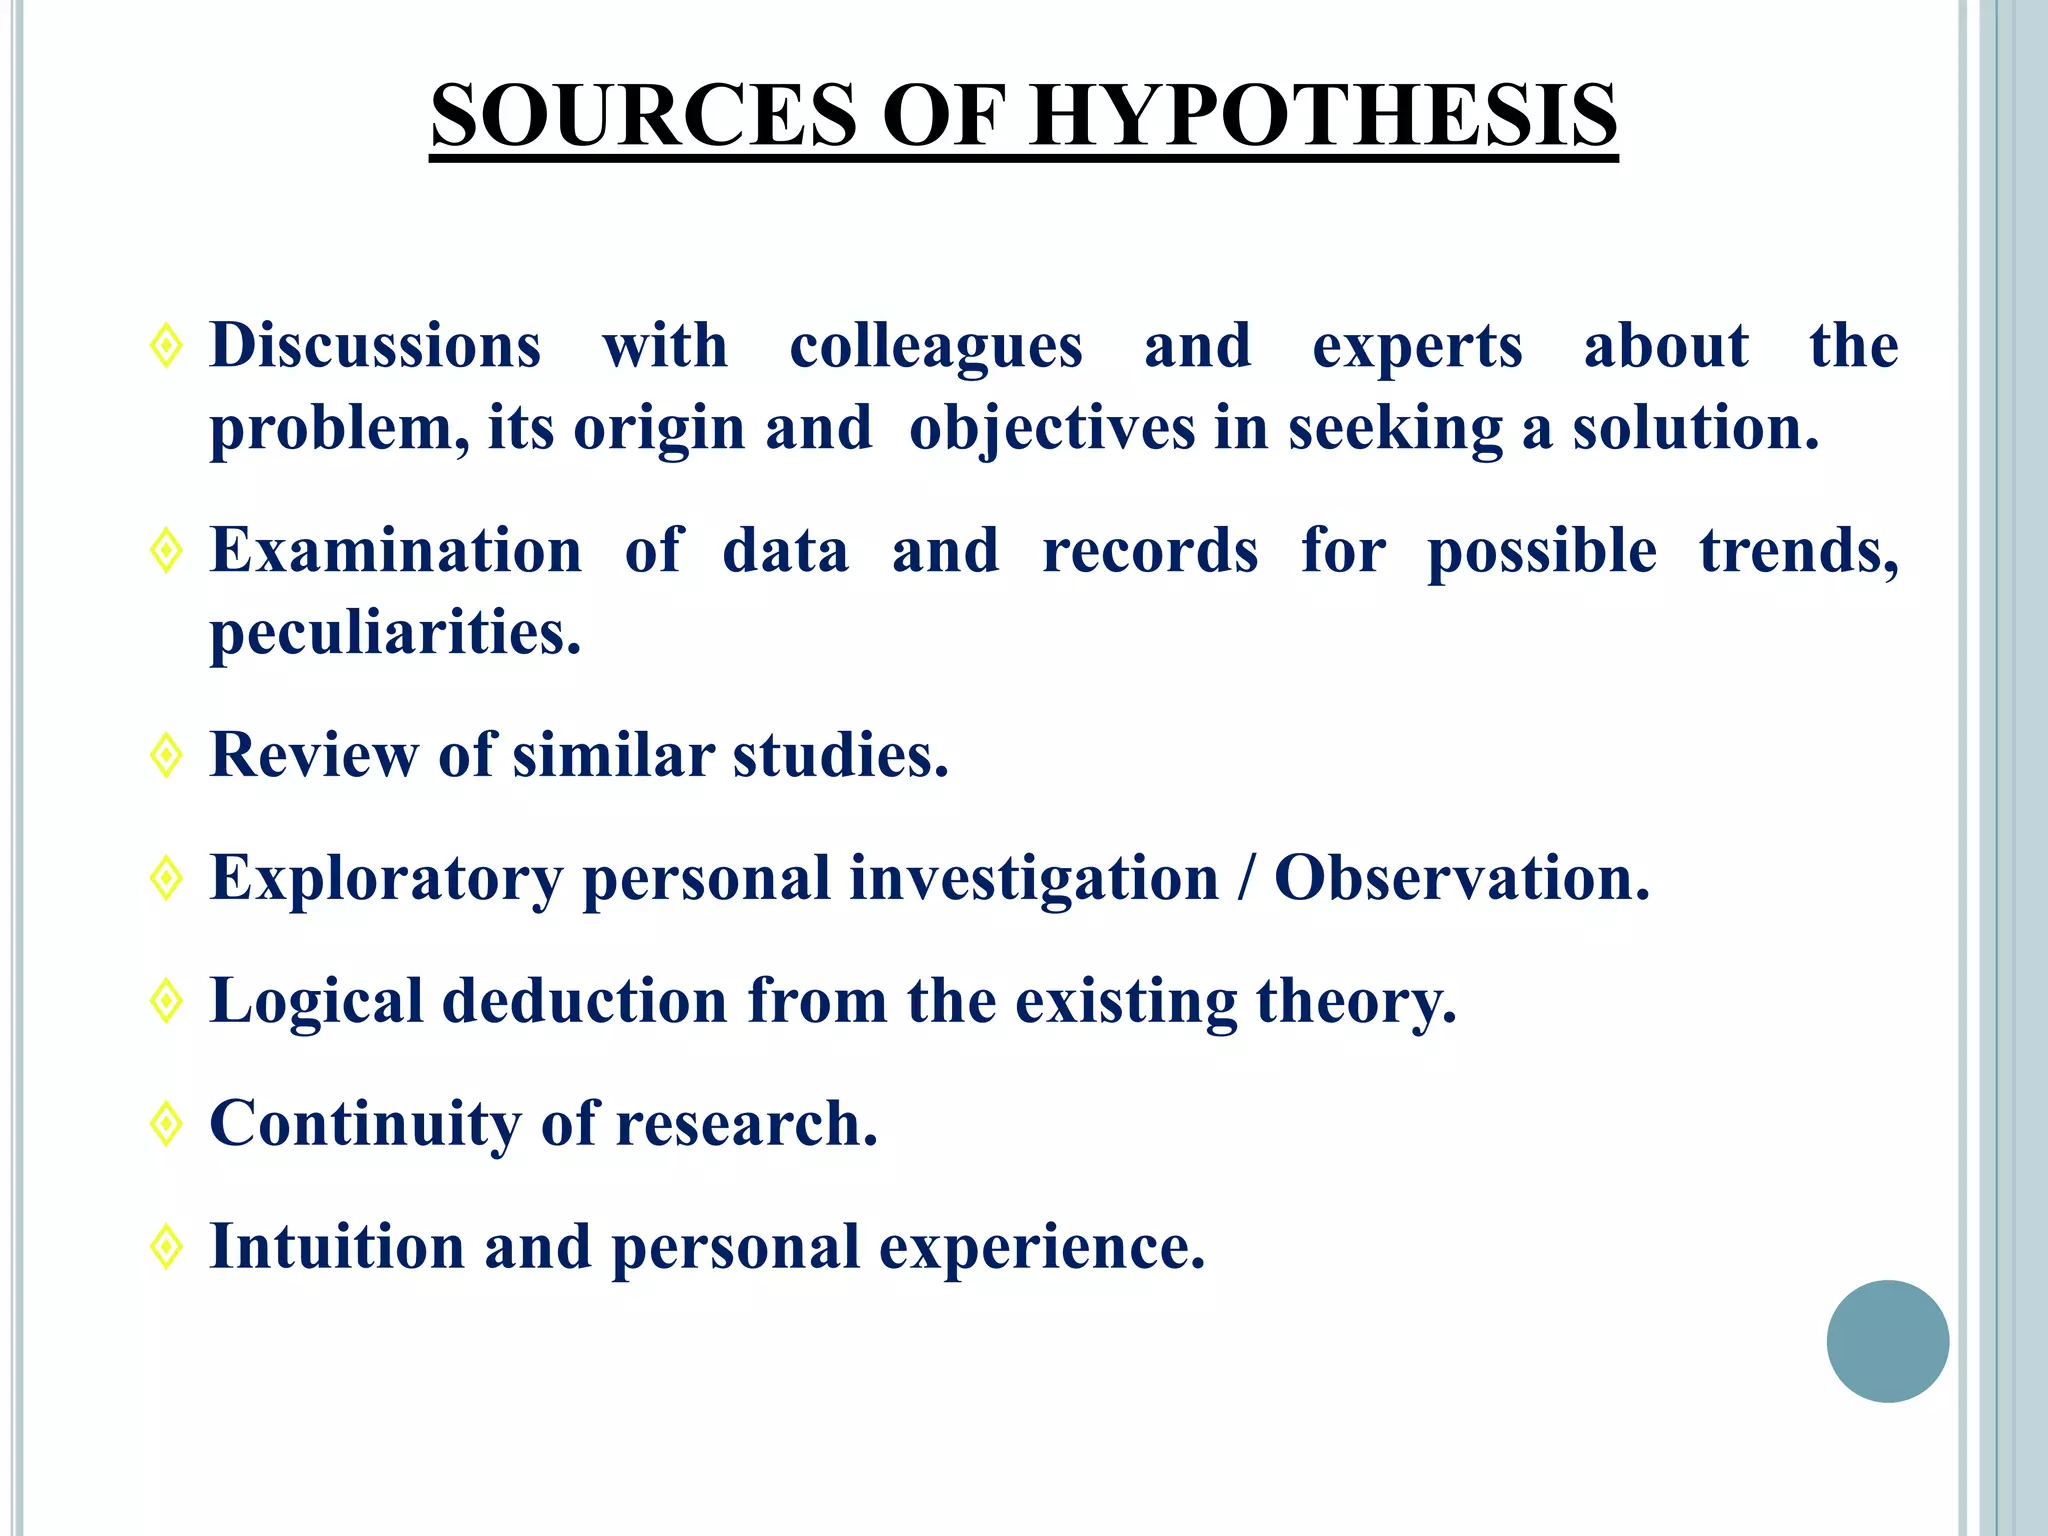
This document provides an overview of biostatistics and research methodology. It defines what research is, the objectives and importance of research, and the different types of research. The key stages of the research process are described, including defining the research problem, reviewing relevant literature, and formulating hypotheses. Statistical concepts like variables, frequency distributions, and hypothesis testing are also introduced. The roles of biostatistics in research applications and data presentation are discussed.
sauth delhi call girls in Bhajanpura đ 9953056974 đ escort Service
Â
Biostatics and Research Methodology
1. Biostatics and Research Methodology
Prepared by-Shagufta Farooqui
Assistant Professor
Department of Pharmacology
2. Research is an search for knowledge
Research is a scientific and systematic search for
information on a specific topic.
Or Art of Scientific investigation
īļPerceive question
īļHypothesis
īļTest hypothesis
īļDraw the conclusion
īļReport results
So research methodology is a systematic and scientific plan for
conducting research.
Introduction
4. Statistics is a branch of science that deals with the study of
collection, compilation, analysis, interpretation and presentation
of data.
Statistics comes from Italian word- statista, Greek word â
status( statement)
Biostatistics is branch of science that deals with study of data
derived from biological sciences. Also called as Biometry
In Greek Bio- life
Metron-Measurement
So it is Measurement of life
Biostatistics is developed during the period of Sir Francis
Galton(1822-1910) who is known father of biometry.
Introduction to Biostatistics= Biology+
Statistics
5. Stages in statistical investigation:
There are five stages or steps in any statistical investigation
1. Collection of data: The process of obtaining measurements or counts.
2. Organization of data: Includes editing, classifying, and tabulating the
data collected
3. Presentation of data: overall view of what the data actually looks like. It
facilitate further statistical analysis. It Can be done in the form of tables
and graphs or diagrams
4. Analysis of data: To dig out useful information for decision making. It
involves extracting relevant information from the data (like mean, median,
mode, range, variance. )
5. Interpretation of data: Concerned with drawing conclusions from the
data collected and analyzed; and giving meaning to analysis results. A
difficult task and requires a high degree of skill and experience
6. Application of Biostatistics
It Facilitate Comparisons
âĸIt simplifies the information of
Data, Figurs.
It help in testing hypothesis
âĸIt help in prediction
7. A frequency distribution is a representation, either in a graphical or
tabular format, that displays the number of observations within a
given interval.
The frequency is how often a value occurs in an interval.
while the distribution is the pattern of frequency of the variable.
īļ A frequency distribution in statistics is a representation that displays the
number of observations within a given interval.
īļ The representation of a frequency distribution can be graphical or tabular
so that it is easier to understand.
īļ Frequency distributions are particularly useful for normal distributions,
which show the observations of probabilities divided among standard
deviations.
Frequency Distribution
8. What Is the Importance of a Frequency
Distribution?
A frequency distribution is a means to organize a large
amount of data.
It takes data from a population based on certain
characteristics and organizes the data in a way that is
comprehensible to an individual that wants to make
assumptions about a given population.
9. Variables
Variables represents the measurable traits that can change
over the course of a scientific experiment.
Which can Vary known as Variables. e.g. Height, Weight, B.P
Disease Status.
1. Independent variable
2. Dependent variable
3. Extraneous Variable
Examples:
Sleep Deprivation and Test Performance
Physical activity daily will reduce body weight.
Smoking causes lung cancer
10.
11.
12. Introduction to Research
Organised scientific investigation to solve problems, test
hypothesis, or develop or invent new products.
The systematic application or use of a set of methods to
provide trustworthy information about problems. a
systematic investigation to increase knowledge and
understanding.
Is very careful, critical and disciplined inquiry varying
in technique and method according to the nature and
conditions of the problem identified, directed towards
the clarification or resolution (or both) of a problem.
13. Research is an academic activity and such term
should be used in a technical sense.
Research comprises defining and redefining
problems, formulating hypothesis or suggested
solutions ,collecting ,organising and evaluating
data, making deduction and reaching conclusion
and last carefully testing the conclusion to
determine whether they fit the formulating
hypothesis.
14. Objective of Research
The purpose of research is to discover answers to questions
through the application of scientific procedures
The main aim of research is to find out the truth which is
hidden and which has not been discovered as yet.
To gain familiarity with a phenomenon or to achieve new
insight into it(studies with this object in view are termed as
exploratory or formulative research studies.
To portray accurately the charectistics of particular
individual, situation or group(studies with this object in
view are known as descriptive research studies.
To determine the frequency with which something occurs or
with which it is associated with something else.
To test hypothesis of casual relationship between variables
16. Motivation of Research
1
âĸ Desire to get a research degree along with it consequential benefits
2
âĸ Desire to face challenges in solving the unsolved problems.i.e.,
concern over practical problems initiates research
3
âĸ Desire to get intellectual joy of doing some creative work
4
âĸ Desire to be service to society
5
âĸ Desire to get respectability
17. Need for Research
Research is a gateway to finding opportunities
Research promotes sharing of valuable
information
Research is nourishment for the mind
Research leads to better understanding of Issues.
Through research we can make our businesses
more successful
Builds knowledge and makes learning more
efficient.
18. Types of Research
Descriptive Vs Analytical
Applied Vs Fundamental
Quantitative Vs Qualitative
Conceptual Vs Empirical
Other types of research
19. Types of Research
Descriptive vs.
Analytical
Descriptive research includes surveys and fact-finding
enquiries of different kinds.
The major purpose of descriptive research is description of the state
of affairs as it exist at present.
In analytical research âon the other hand the researcher has to use
facts or information already available, and analyze these to make a
critical evaluation of the material.
20. Applied Vs
Fundamental
Research can either be Applied(or action) or fundamental (to
basic or pure Research.) Applied research aims at finding a
solution for an immediate problem facing a society or an
industrial/business organisation, whereas fundamental research is
mainly concerned with generalisations and with formulation of a
theory.
Example-certain conclusion (say solution) facing a concrete social or
business problem is an example of applied research.
Gathering knowledge for knowledgeâs sake is termed as pure or
basic research.
e.g- human behaviour with view to make generalisation
about human behaviour
21. Quantitative Vs
Qualitative
Quantitative research is based on the measurement of
quantity or amount, expressed in terms of quantity.
Qualitative research on the other hand is concerned with
qualitative phenomenon i.e relating to or involving quality or
kind.
When we are interested in investigating the reason for human
behaviour (i.e. why people think or do certain things), or motivation
research is an important type of qualitative research.
22. Conceptual Vs
Empirical
Conceptual research is the related to some abstract ideas or
theory.
Generally used by philosophers and thinkers to develop new
concepts or to reinterpret existing ones.
Empirical Research relies on experience or observation alone ,often
without due regard for system and theory.
It is data based research, coming up with conclusions which are
capable of being verified by observation or experiments.
Also called as Experimental research.
24. What is a research problem?
īļ The term âproblemâ means a question or issue to be
examined.
īļ Research Problem refers to some difficulty /need
which a researcher experiences in the context of either
theoretical or practical situation and wants to obtain a
solution for the same.
RESEARCH PROBLEM
25. The first step in the research process â
definition of the problem involves two
activities:
īļIdentification / Selection of the
Problem
īļFormulation of the Problem
26. IDENTIFICATION / SELECTION OF THE
RESEARCH PROBLEM
īļ This step involves identification of a few
problems and selection of one out of them, after
evaluating the alternatives against certain selection
criteria.
27. SOURCES OF PROBLEMS
ī Reading
ī Academic Experience
ī Daily Experience
ī Exposure to Field Situations
ī Consultations
ī Brainstorming
ī Research
ī Intuition
28. CRITERIA OF SELECTION
The selection of one appropriate researchable
problem out of the identified problems requires
evaluation of those alternatives against certain
criteria. They are:
īĻ Internal / Personal criteria â Researcherâs Interest,
Researcherâs Competence, Researcherâs own
Resource: finance and time.
īĻ External Criteria or Factors â Researchability of the
problem, Importance and Urgency, Novelty of the
Problem, Feasibility, Facilities, Usefulness and
Social Relevance, Research Personnel.
29. CRITERIA OF A GOOD RESEARCH PROBLEM
ī Clear and Unambiguous
ī Empirical
ī Verifiable
ī Interesting
ī Novel and Original
ī Availability of Guidance
30. DEFINITION / FORMULATION OF THE
RESEARCH PROBLEM
ī Formulation is the process of refining the research
ideas into research questions and objectives.
ī Formulation means translating and transforming
the selected research problem/topic/idea into a
scientifically researchable question. It is concerned
with specifying exactly what the research problem is.
31. ī Problem definition or Problem statement is a clear,
precise and succinct statement of the question or issue
that is to be investigated with the goal of finding an
answer or solution.
ī There are two ways of stating a problem:
īŧ Posting question / questions
īŧ Making declarative statement / statements
34. ESTABLISHMENT OF RESEARCH OBJECTIVES
ī Research Objectives are the specific components of
the research problem, that youâll be working to
answer or complete, in order to answer the overall
research problem. - Churchill, 2001
ī The objectives refers to the questions to be
answered through the study. They indicate what we
are trying to get from the study or the expected
results / outcome of the study.
35. ESTABLISHMENT OF RESEARCH OBJECTIVES
ī Research Objectives should be clear and achievable,
as they directly assist in answering the research
problem.
ī The objectives may be specified in the form of
either statements or questions.
ī Generally, they are written as statements, using the
word âtoâ. (For example, âto discover âĻâ, âto
determine âĻâ, âto establish âĻâ, etc. )
37. REVIEW OF LITERATURE
īļ Literature Review is the documentation of a
comprehensive review of the published and
unpublished work from secondary sources of data in
the areas of specific interest to the researcher.
īļ The main aim is to find out problems that are already
investigated and those that need further investigation.
38. REVIEW OF LITERATURE
īļ It is an extensive survey of all available past studies
relevant to the field of investigation.
īļ It gives us knowledge about what others have found
out in the related field of study and how they have
done so.
39. PURPOSE OF REVIEW
īŧ To gain a background knowledge of the research
topic.
īŧ To identify the concepts relating to it, potential
relationships between them and to formulate
researchable hypothesis.
īŧ To identify appropriate methodology, research design,
methods of measuring concepts and techniques of
analysis.
īŧ To identify data sources used by other researchers.
īŧ To learn how others structured their reports.
40. How to conduct the Literature
Survey?
īIdentify the relevant sources.
īExtract and Record relevant information.
īWrite-up the Literature Review.
42. SOURCES OF LITERATURE
īŦ Books and Journals
īŦ Electronic Databases
īBibliographic Databases
īAbstract Databases
īFull-Text Databases
īŦ Govt. and Industry Reports
īŦ Internet
īŦ Research Dissertations / Thesis
43. PROCESS OF LITERATURE SURVEY:
First step in literature is identifying the key words
The next step is searching all sources
LITERATURE SURVEY TECHNIQUES:
Searching by
phrase
By
phrase
Boolean
searching
AND,OR
NOT
Truncation
and wild card
searching
Replace
with
symbol *
44. How to write the review?
īŦ There are several ways of presenting the ideas of
others within the body of the paper.
īŦ For Example; If you are referring the major
influencing factors in the Shethâs model of Industrial
Buying Behaviour, it can be written as,
1) Sheth (1973, p-50) has suggested that, there are a
number of influencing factors âĻâĻ..
2) According to Sheth (1973) model of industrial
buying behaviour, there are a number of influencing
factorsâĻâĻ..
45. How to write the review?
īļIn some models of industrial buying behaviour,
there are a number of influencing factors (Sheth,
1973).
īļ In some models of industrial buying behaviour,
there are a number of influencing factors1.
īļ Sheth J.N (1973), A Model of Industrial Buying
Behaviour, Journal of Marketing, 37(4), 50-56.
46. Points to be kept in mind while
reviewing literature..
īļRead relevant literature.
īļRefer original works.
īļRead with comprehension.
īļRead in time.
īļIndex the literature.
48. HYPOTHESIS
ī A hypothesis is an assumption about relations
between variables.
ī Hypothesis can be defined as a logically conjectured
relationship between two or more variables expressed
in the form of a testable statement.
Relationships are conjectured on the basis of the
network of associations established in the theoretical
framework formulated for the research study.
49. VARIABLES
ī Anything that can vary can be considered as a variable.
ī A variable is anything that can take on differing or
varying values.
For example; Age, Production units, Absenteeism,
Sex, Motivation, Income, Height, Weight etc.
Note: The values can differ at various times for the
same object or person (or) at the same time for
different objects or persons.
50. Variable / Attribute
īA variable is a characteristic that takes on two or more
values whereas, an attribute is a specific value on a
variable (qualitative).
For example;
ī The variable SEX/GENDER has 2 attributes -
Male and Female.
ī The variable AGREEMENT has 5 attributes â
Strongly Agree, Agree, Neutral, Disagree, Strongly
Disagree.
51. Types of Variables
ī Explanatory vs Extraneous Variable
The variables selected for analysis are called explanatory
variables and all other variables that are not related to the
purpose of the study but may affect the dependant variable are
extraneous.
ī Dependant vs Independent Variable
The variable that changes in relationship to changes in
another variable(s) is called dependent variable.
The variable whose change results in the change in another
variable is called an independent variable.
OR
An independent variable is the one that influences the
dependant variable in either a positive or negative way.
52. HYPOTHESIS
ī Research Hypothesis is a predictive statement that
relates an independent variable to a dependent
variable.
Hypothesis must contain at least one independent
variable and one dependent variable.
53. ī Hypothesis are tentative, intelligent guesses as to the
solution of the problem.
ī Hypothesis is a specific statement of prediction. It
describes in concrete terms what you expect to happen
in the study.
ī Hypothesis is an assumption about the population of
the study.
ī It delimits the area of research and keeps the
researcher on the right track.
HYPOTHESIS
54. PROBLEM (VS) HYPOTHESIS
ī Hypothesis is an assumption, that can be tested and
can be proved to be right or wrong.
ī A problem is a broad question which cannot be
directly tested. A problem can be scientifically
investigated after converting it into a form of
hypothesis.
55. CHARACTERISTICS OF HYPOTHESIS
ī Conceptual Clarity - It should be clear and precise.
ī Specificity - It should be specific and limited in scope.
ī Consistency - It should be consistent with the
objectives of research.
ī Testability - It should be capable of being tested.
ī Expectancy - It should state the expected relationships
between variables.
56. CHARACTERISTICS OF HYPOTHESIS
ī Simplicity - It should be stated as far as possible in
simple terms.
ī Objectivity - It should not include value judgments,
relative terms or any moral preaching.
ī Theoretical Relevance - It should be consistent with a
substantial body of established or known facts or existing
theory.
ī Availability of Techniques â Statistical methods should
be available for testing the proposed hypothesis.
57. SOURCES OF HYPOTHESIS
īš Discussions with colleagues and experts about the
problem, its origin and objectives in seeking a solution.
īš Examination of data and records for possible trends,
peculiarities.
īš Review of similar studies.
īš Exploratory personal investigation / Observation.
īš Logical deduction from the existing theory.
īš Continuity of research.
īš Intuition and personal experience.
58. īDescriptive Hypothesis
These are assumptions that describe the characteristics
(such as size, form or distribution) of a variable. The variable
may be an object, person, organisation, situation or event.
Examples:
ī âPublic enterprises are more amenable for centralized
planningâ.
TYPES OF HYPOTHESIS
59. īRelational Hypothesis [Explanatory Hypothesis]
These are assumptions that describe the relationship
between two variables. The relationship suggested may be
positive, negative or causal relationship.
Examples:
ī âFamilies with higher incomes spend more for recreationâ.
Causal Hypothesis state that the existence of or change
in one variable causes or leads to an effect on another
variable. The first variable is called the independent
variable and the latter is the dependant variable.
60. īNull Hypothesis
When a hypothesis is stated negatively, it is called null
hypothesis. It is a âno differenceâ, âno relationshipâ hypothesis.
ie., It states that, no difference exists between the parameter
and statistic being compared to or no relationship exists
between the variables being compared.
It is usually represented as HO or H0 .
Example:
ī H0: There is no relationship between Air pollution and lung
cancer
61. īAlternate Hypothesis
It is the hypothesis that describes the researcherâs
prediction that, there exist a relationship between two
variables or it is the opposite of null hypothesis. It is
represented as HA or H1.
Example:
HA: There is a definite relationship between Air
pollution and lung cancer.
62. Need for design of experiments
Design of experiments (DOE) is a systematic method to determine the
relationship between factors affecting a process and the output of that
process. In other words, it is used to find cause-and-effect relationships.
This information is needed to manage process inputs in order to optimize
the output
Experimental research design are concerned with examination of the effect of
independent variable on the dependent variable, where the independent
variable is manipulated through treatment or intervention(s), & the effect of
those interventions is observed on the dependant variable.
63. Basic principles of design of
experiments
The Principle of
Replication
Principle of
local control
The Principle of
Randomization
64. 1. Principle of Replication-
The Experiment should be repeated more than once.
Thus each treatment is applied in many experimental units
instead of one.
Suppose we are to examine the effect of two verities of rice. For
this purpose we may divide the field into two parts and grow one
variety in one part and other variety in other part and the other
part.
We can then compare the yield of the two parts and draw
conclusion on the basis.
But if we are to apply the principle of replication to this
experiment, then we first divide into several parts, grow one
variety in half of these parts and other variety in the other part.
We can then compare the yield of the two parts and draw a
conclusion.
65. 2. Principle of Randomization-
Provide protection ,when we conduct an experiment, against the
effect of extraneous factors by randomization.
If we grow one variety of rice in the first half of the parts of a field
and other variety is grown in the other half, then it is just possible
that the soil fertility may be different in the first half in
comparison to the other half.
If this is so our result will not be realistic.
In such situation we may assign the variety of rice to be grown in
different parts of the field on the basis of some random sampling
techniques i.e we may apply randomization principle and protect
ourselves against the effects of the extraneous factors(soil fertility ).
66. 3.The Principle of Local control-
Local control means the control of all factors except the ones
about which we are investigating. Local control, like
replication is yet another device to reduce or control the
variation due to extraneous factors and increase the precision of
the experiment.
We should plan the experiment in a manner that we can
perform a two âway analysis of variance in which the
variability of the data is divided into three components
attributed to treatments(varieties of rice ) the extraneous
factor(soil fertility in our case) and experimental error.
67. Experimental design Techniques
Categorized in two broad categories-
a) Informal experimental design âthose design that normally use a less
sophisticated form of analysis based on difference in magnitudes,
b) Formal experimental design-designs offer relatively more control
and use precise statistical procedures for analysis.
Informal experimental design-
1.Before and after without control design
2.After only with control design
3.Before âand after with control design
Formal experimental design-
1.Completely randomized design (C.R design)
2.Randomized block design (R.B design)
3.Latin Square design (L.S design)
4.Factorial Design.
68. 1.Before and after without control design-
Single test group or area is selected and the dependent variable is
measured before the introduction of the treatment.
Then treatment is then introduced and dependent variable is
measured again after the treatment has been introduced
The effect of the treatment would be equal to the level of the
phenomenon after the treatment minus the level of the phenomenon
before the treatment.
Test area- Level of phenomenon Treatment introduced Level of phenomenon(Y)
Before treatment (X)
69. 2.After âonly with control design-(test area and control area)-are
selected and the treatment is introduced into the test selected and the
treatment is introduced into the test area only.
The dependent variable is then measured in both the areas at the same
time
Treatment impact is assessed by subtracting the value of the dependent
variables in the control area from its value in the test area.
Test Area Treatment introduced
Treatment effect= (Y)-(Z)
Level of phenomenon after
treatment(Y)
Level of phenomenon without
treatment (Z)
70. 3. Before and after with control design-
In this design two areas are selected and the dependent variable is measured
in both the areas for an identical time period before the treatment.
The treatment is then introduced into the test area only, and the dependent
variable is measured in both for an identical time period after introduction of
the treatment. The treatment effect is determined by subtracting the change
in the dependent variable in the control area from the change in the
dependent variable in test area.
Test area: Level of phenomenon
before treatment(X)
Control area-Level of phenomenon
without treatment
Treatment effect= (Y-Z)-(Z-A)
Treatment introduced
Level of phenomenon
After treatment(Y)
Level of phenomenon
Without treatment(Z)
71. Formal Experimental design
1.Completly Randomized design(C.R design):
a) Two group Simple randomized design
b) Random Replication design
A) Two group Simple randomized design:
Population
Random
sample
Group A
Group B
Control
group(Y)
Experimental
group (X)
72. B) Random Replication Design:
Population
-1
Population
-2
Random
Sample-1
Random
Sample-2
Group-1
Group-2
Group-3
Group-4
Group-5
Group-6
Group-7
Group-8
Experiment
Control