Downloaded 167 times


![Financial Model Quizzes
44
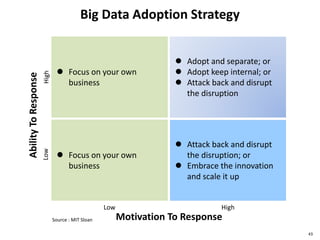
Big Data
Technology
Provider
Big Data
Solution
Integration
Big Data
As A Service
Fixed cost
BEP
Fixed cost
BEP
Fixed cost
BEPsales
cost
cost
cost
salessales
A B C
[ ] [ ] [ ]
*BEP : Breakeven Point](https://image.slidesharecdn.com/bigdatav1-150605010536-lva1-app6892/85/Big-Data-Risks-and-Opportunities-44-320.jpg)


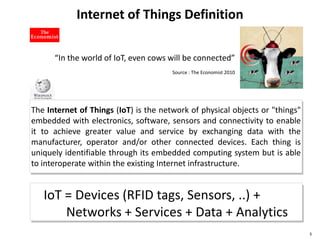
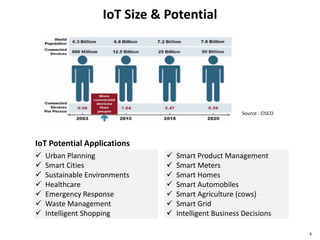
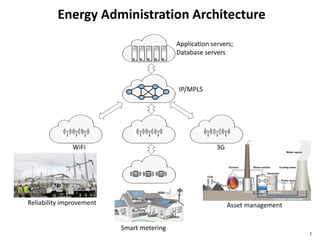
This document discusses big data, including opportunities and risks. It covers big data technologies, the big data market, opportunities and risks related to capital trends, and issues around algorithmic accountability and privacy. The document contains several sections that describe topics like the Internet of Things, Hadoop, analytics approaches for static versus streaming data, big data challenges, and deep learning. It also includes examples of big data use cases and discusses hype cycles, adoption curves, and strategies for big data adoption.