Download as PDF, PPTX

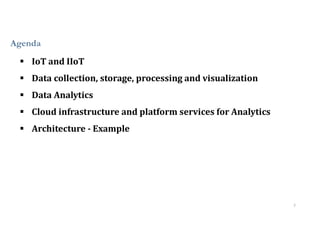
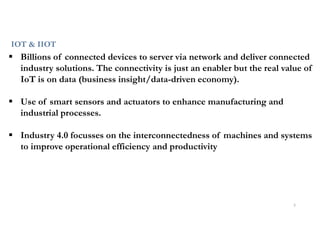
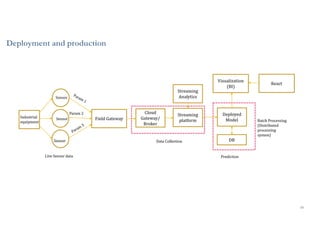
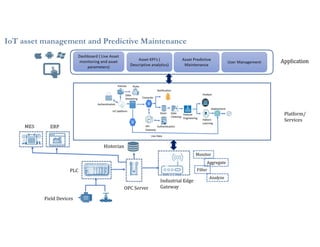


This document discusses analytics and IoT. It covers key topics like data collection from IoT sensors, data storage and processing using big data tools, and performing descriptive, predictive, and prescriptive analytics. Cloud platforms and visualization tools that can be used to build end-to-end IoT and analytics solutions are also presented. The document provides an overview of building IoT solutions for collecting, analyzing, and gaining insights from sensor data.