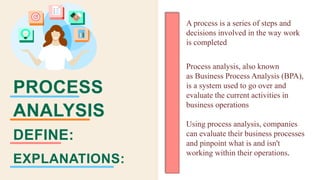
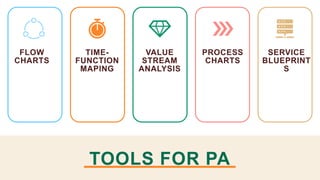
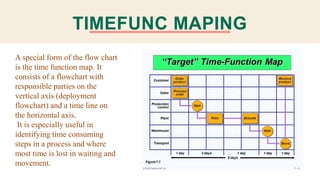
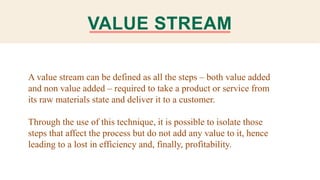
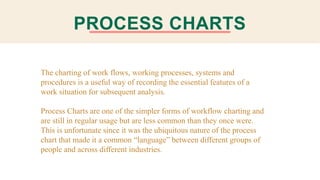
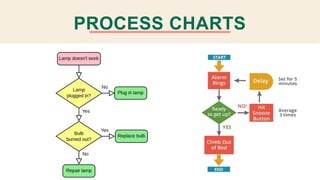
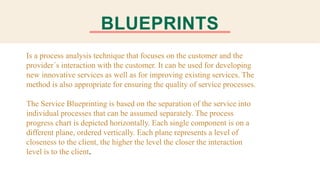
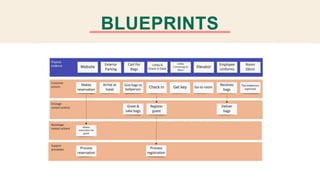
This document discusses process analysis tools. It defines process analysis as evaluating current business operations. Tools described for process analysis include flow charts, time-function mapping, value stream analysis, process charts, and service blueprints. Flow charts use symbols to show each step in a process linked by arrows. Time-function mapping uses a flowchart and timeline to identify time-consuming steps. Value stream analysis isolates non-value adding steps. Process charts record work flows simply. Service blueprints focus on customer interactions and separate service processes by interaction level.
3. PROCESS
ANALYSIS
DEFINE:
EXPLANATIONS:
A process is a series of steps and
decisions involved in the way work
is completed
Process analysis, also known
as Business Process Analysis (BPA),
is a system used to go over and
evaluate the current activities in
business operations
Using process analysis, companies
can evaluate their business processes
and pinpoint what is and isn't
working within their operations.
5. FLOW CHARTS
A flow chart is a graphical or
symbolic representation of a
process. Each step in the
process is represented by a
different symbol and contains a
short description of the process
step.
The flow chart symbols are
linked together with arrows
showing the process flow
direction.
6. TIMEFUNC MAPING
A special form of the flow chart
is the time function map. It
consists of a flowchart with
responsible parties on the
vertical axis (deployment
flowchart) and a time line on
the horizontal axis.
It is especially useful in
identifying time consuming
steps in a process and where
most time is lost in waiting and
movement.
7. VALUE STREAM
A value stream can be defined as all the steps – both value added
and non value added – required to take a product or service from
its raw materials state and deliver it to a customer.
Through the use of this technique, it is possible to isolate those
steps that affect the process but do not add any value to it, hence
leading to a lost in efficiency and, finally, profitability.
8. STEPS
INVOLVE:
STEP 1
Identify the Product
Family:
STEP 2
Create a Current
State
STEP 3
Create A Future
State
STEP 4
Create an action
Plan.
STEP 5
Draw in The Customer
Details
STEPS 6
Calculate Time.
9. PROCESS CHARTS
The charting of work flows, working processes, systems and
procedures is a useful way of recording the essential features of a
work situation for subsequent analysis.
Process Charts are one of the simpler forms of workflow charting and
are still in regular usage but are less common than they once were.
This is unfortunate since it was the ubiquitous nature of the process
chart that made it a common “language” between different groups of
people and across different industries.
11. BLUEPRINTS
Is a process analysis technique that focuses on the customer and the
provider´s interaction with the customer. It can be used for developing
new innovative services as well as for improving existing services. The
method is also appropriate for ensuring the quality of service processes.
The Service Blueprinting is based on the separation of the service into
individual processes that can be assumed separately. The process
progress chart is depicted horizontally. Each single component is on a
different plane, ordered vertically. Each plane represents a level of
closeness to the client, the higher the level the closer the interaction
level is to the client.