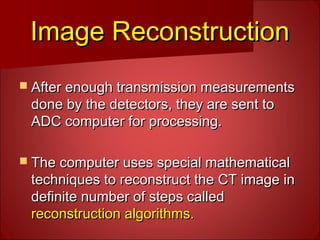
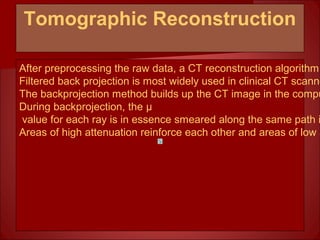
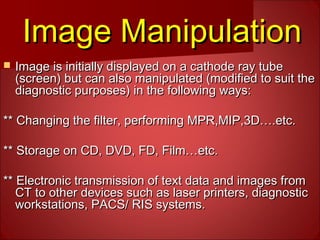
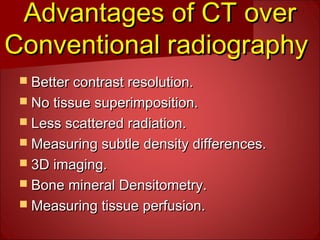
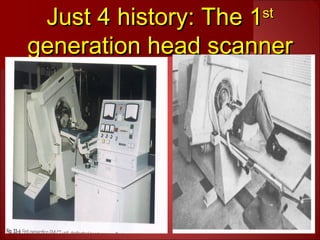
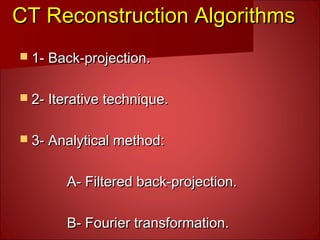
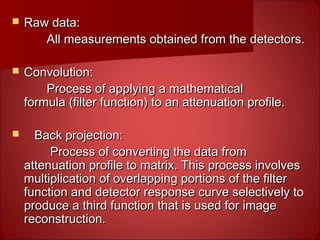
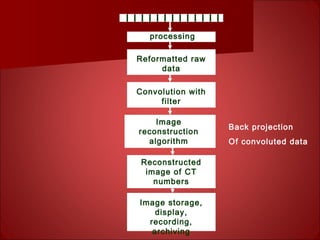
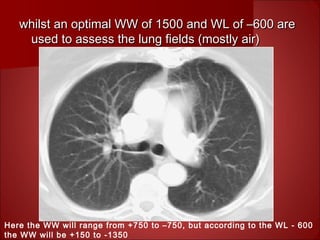
‫تعلم‬ ‫تكن‬ ‫مالم‬ ‫وعلمك‬‫تعلم‬ ‫تكن‬ ‫مالم‬ ‫وعلمك‬
‫ال‬ ‫فضل‬ ‫وكان‬‫ال‬ ‫فضل‬ ‫وكان‬
‫عظيما‬ ‫عليك‬‫عظيما‬ ‫عليك‬
Basics Of
Computed
Tomography (CT)
Lecture Two
GGamalamal FFathallaathalla MM..
MMahdalyahdaly
gamal_mahdaly@hotmail.comgamal_mahdaly@hotmail.com
Image ReconstructionImage Reconstruction
 After enough transmission measurementsAfter enough transmission measurements
done by the detectors, they are sent todone by the detectors, they are sent to
ADC computer for processing.ADC computer for processing.
 The computer uses special mathematicalThe computer uses special mathematical
techniques to reconstruct the CT image intechniques to reconstruct the CT image in
definite number of steps calleddefinite number of steps called
reconstruction algorithms.reconstruction algorithms.
Tomographic Reconstruction
After preprocessing the raw data, a CT reconstruction algorithm
Filtered back projection is most widely used in clinical CT scanne
The backprojection method builds up the CT image in the compu
During backprojection, the μ
value for each ray is in essence smeared along the same path i
Areas of high attenuation reinforce each other and areas of low a
CT Image Matrix
The rows and columns comprise
Matrix sizes are 256x256, 512 x 5
The technologist selects the field
Pixel size = FOV/matrix size.
The gray scale range for each pix
Spatial resolution improves with a
CT number of bone can be calculated:CT number of bone can be calculated:
CT number for water can be calculatedCT number for water can be calculated
Distribution
of CT
numbers on
the
Hounsfield
and EMI
scales
DisplayDisplay
 Whilst the range of CT numbers recognized byWhilst the range of CT numbers recognized by
the computer is 2000, the human eye cannotthe computer is 2000, the human eye cannot
accurately distinguish between 2000 differentaccurately distinguish between 2000 different
shades of grey. Therefore to allow the observershades of grey. Therefore to allow the observer
to interpret the image, only a limited number ofto interpret the image, only a limited number of
CT numbers are displayed.CT numbers are displayed.
 A clinically useful grey scale is achieved byA clinically useful grey scale is achieved by
setting the WL and WW on the computersetting the WL and WW on the computer
console to a suitable range of CT numbers,console to a suitable range of CT numbers,
depending on the tissue being studied.depending on the tissue being studied.
Grey Scaling
The CT reconstruction process results in a 2D matrix of floating poin
These numbers correspond to the average linear attenuation coeffic
The CT images are normalized and truncated to integer values that
CT numbers are nothing but rescaled linear attenuation coefficients
Rescaling these values to definite shades of grey produces the Gre
Window width (WW) and Window Level (WL)Window width (WW) and Window Level (WL)
Window widthWindow width (WW):(WW):
 Represents the CT numbers of all the tissues of interest andRepresents the CT numbers of all the tissues of interest and
these are displayed as various shades of grey. Tissues withthese are displayed as various shades of grey. Tissues with
CT numbers outside this range are displayed as either blackCT numbers outside this range are displayed as either black
or white.or white.
Window LevelWindow Level (WL):(WL):
 Represents the central numbers of all the CT numbersRepresents the central numbers of all the CT numbers
covered by the window width.covered by the window width.
** NB: Both the WL and WW can be set independently on the** NB: Both the WL and WW can be set independently on the
monitor and their respective settings affect the final displayedmonitor and their respective settings affect the final displayed
image.image.
Display: WindowingDisplay: Windowing
Image ManipulationImage Manipulation
 Image is initially displayed on a cathode ray tubeImage is initially displayed on a cathode ray tube
(screen) but can also manipulated (modified to suit the(screen) but can also manipulated (modified to suit the
diagnostic purposes) in the following ways:diagnostic purposes) in the following ways:
** Changing the filter, performing MPR,MIP,3D….etc.** Changing the filter, performing MPR,MIP,3D….etc.
** Storage on CD, DVD, FD, Film…etc.** Storage on CD, DVD, FD, Film…etc.
** Electronic transmission of text data and images from** Electronic transmission of text data and images from
CT to other devices such as laser printers, diagnosticCT to other devices such as laser printers, diagnostic
workstations, PACS/ RIS systems.workstations, PACS/ RIS systems.
Advantages of CT overAdvantages of CT over
Conventional radiographyConventional radiography
 Better contrast resolution.Better contrast resolution.
 No tissue superimposition.No tissue superimposition.
 Less scattered radiation.Less scattered radiation.
 Measuring subtle density differences.Measuring subtle density differences.
 3D imaging.3D imaging.
 Bone mineral Densitometry.Bone mineral Densitometry.
 Measuring tissue perfusion.Measuring tissue perfusion.
Just 4 history: The 1Just 4 history: The 1stst
generation head scannergeneration head scanner
Multislice CT scanner
CT Reconstruction AlgorithmsCT Reconstruction Algorithms
 1- Back-projection.1- Back-projection.
 2- Iterative technique.2- Iterative technique.
 3- Analytical method:3- Analytical method:
A- Filtered back-projection.A- Filtered back-projection.
B- Fourier transformation.B- Fourier transformation.
 Raw data:Raw data:
All measurements obtained from the detectors.All measurements obtained from the detectors.
 Convolution:Convolution:
Process of applying a mathematicalProcess of applying a mathematical
formula (filter function) to an attenuation profile.formula (filter function) to an attenuation profile.
 Back projection:Back projection:
Process of converting the data fromProcess of converting the data from
attenuation profile to matrix. This process involvesattenuation profile to matrix. This process involves
multiplication of overlapping portions of the filtermultiplication of overlapping portions of the filter
function and detector response curve selectively tofunction and detector response curve selectively to
produce a third function that is used for imageproduce a third function that is used for image
reconstruction.reconstruction.
processing
Reformatted raw
data
Image
reconstruction
algorithm
Reconstructed
image of CT
numbers
Convolution with
filter
Image storage,
display,
recording,
archiving
Back projection
Of convoluted data
whilst an optimal WW of 1500 and WL of –600 arewhilst an optimal WW of 1500 and WL of –600 are
used to assess the lung fields (mostly air)used to assess the lung fields (mostly air)
Here the WW will range from +750 to –750, but according to the WL - 600
the WW will be +150 to -1350
Any Question???.
Take your Tiiime!!! .
Again Any Question???.
Otherwise, I’m going to ask!!!.
Should I Ask???.
Have a nice dayHave a nice day

Basics of ct lecture 2

  • 1.
    ‫تعلم‬ ‫تكن‬ ‫مالم‬‫وعلمك‬‫تعلم‬ ‫تكن‬ ‫مالم‬ ‫وعلمك‬ ‫ال‬ ‫فضل‬ ‫وكان‬‫ال‬ ‫فضل‬ ‫وكان‬ ‫عظيما‬ ‫عليك‬‫عظيما‬ ‫عليك‬
  • 2.
    Basics Of Computed Tomography (CT) LectureTwo GGamalamal FFathallaathalla MM.. MMahdalyahdaly gamal_mahdaly@hotmail.comgamal_mahdaly@hotmail.com
  • 3.
    Image ReconstructionImage Reconstruction After enough transmission measurementsAfter enough transmission measurements done by the detectors, they are sent todone by the detectors, they are sent to ADC computer for processing.ADC computer for processing.  The computer uses special mathematicalThe computer uses special mathematical techniques to reconstruct the CT image intechniques to reconstruct the CT image in definite number of steps calleddefinite number of steps called reconstruction algorithms.reconstruction algorithms.
  • 4.
    Tomographic Reconstruction After preprocessingthe raw data, a CT reconstruction algorithm Filtered back projection is most widely used in clinical CT scanne The backprojection method builds up the CT image in the compu During backprojection, the μ value for each ray is in essence smeared along the same path i Areas of high attenuation reinforce each other and areas of low a
  • 6.
    CT Image Matrix Therows and columns comprise Matrix sizes are 256x256, 512 x 5 The technologist selects the field Pixel size = FOV/matrix size. The gray scale range for each pix Spatial resolution improves with a
  • 7.
    CT number ofbone can be calculated:CT number of bone can be calculated:
  • 8.
    CT number forwater can be calculatedCT number for water can be calculated
  • 9.
  • 10.
    DisplayDisplay  Whilst therange of CT numbers recognized byWhilst the range of CT numbers recognized by the computer is 2000, the human eye cannotthe computer is 2000, the human eye cannot accurately distinguish between 2000 differentaccurately distinguish between 2000 different shades of grey. Therefore to allow the observershades of grey. Therefore to allow the observer to interpret the image, only a limited number ofto interpret the image, only a limited number of CT numbers are displayed.CT numbers are displayed.  A clinically useful grey scale is achieved byA clinically useful grey scale is achieved by setting the WL and WW on the computersetting the WL and WW on the computer console to a suitable range of CT numbers,console to a suitable range of CT numbers, depending on the tissue being studied.depending on the tissue being studied.
  • 11.
    Grey Scaling The CTreconstruction process results in a 2D matrix of floating poin These numbers correspond to the average linear attenuation coeffic The CT images are normalized and truncated to integer values that CT numbers are nothing but rescaled linear attenuation coefficients Rescaling these values to definite shades of grey produces the Gre
  • 12.
    Window width (WW)and Window Level (WL)Window width (WW) and Window Level (WL) Window widthWindow width (WW):(WW):  Represents the CT numbers of all the tissues of interest andRepresents the CT numbers of all the tissues of interest and these are displayed as various shades of grey. Tissues withthese are displayed as various shades of grey. Tissues with CT numbers outside this range are displayed as either blackCT numbers outside this range are displayed as either black or white.or white. Window LevelWindow Level (WL):(WL):  Represents the central numbers of all the CT numbersRepresents the central numbers of all the CT numbers covered by the window width.covered by the window width. ** NB: Both the WL and WW can be set independently on the** NB: Both the WL and WW can be set independently on the monitor and their respective settings affect the final displayedmonitor and their respective settings affect the final displayed image.image.
  • 13.
  • 14.
    Image ManipulationImage Manipulation Image is initially displayed on a cathode ray tubeImage is initially displayed on a cathode ray tube (screen) but can also manipulated (modified to suit the(screen) but can also manipulated (modified to suit the diagnostic purposes) in the following ways:diagnostic purposes) in the following ways: ** Changing the filter, performing MPR,MIP,3D….etc.** Changing the filter, performing MPR,MIP,3D….etc. ** Storage on CD, DVD, FD, Film…etc.** Storage on CD, DVD, FD, Film…etc. ** Electronic transmission of text data and images from** Electronic transmission of text data and images from CT to other devices such as laser printers, diagnosticCT to other devices such as laser printers, diagnostic workstations, PACS/ RIS systems.workstations, PACS/ RIS systems.
  • 15.
    Advantages of CToverAdvantages of CT over Conventional radiographyConventional radiography  Better contrast resolution.Better contrast resolution.  No tissue superimposition.No tissue superimposition.  Less scattered radiation.Less scattered radiation.  Measuring subtle density differences.Measuring subtle density differences.  3D imaging.3D imaging.  Bone mineral Densitometry.Bone mineral Densitometry.  Measuring tissue perfusion.Measuring tissue perfusion.
  • 16.
    Just 4 history:The 1Just 4 history: The 1stst generation head scannergeneration head scanner
  • 17.
  • 18.
    CT Reconstruction AlgorithmsCTReconstruction Algorithms  1- Back-projection.1- Back-projection.  2- Iterative technique.2- Iterative technique.  3- Analytical method:3- Analytical method: A- Filtered back-projection.A- Filtered back-projection. B- Fourier transformation.B- Fourier transformation.
  • 19.
     Raw data:Rawdata: All measurements obtained from the detectors.All measurements obtained from the detectors.  Convolution:Convolution: Process of applying a mathematicalProcess of applying a mathematical formula (filter function) to an attenuation profile.formula (filter function) to an attenuation profile.  Back projection:Back projection: Process of converting the data fromProcess of converting the data from attenuation profile to matrix. This process involvesattenuation profile to matrix. This process involves multiplication of overlapping portions of the filtermultiplication of overlapping portions of the filter function and detector response curve selectively tofunction and detector response curve selectively to produce a third function that is used for imageproduce a third function that is used for image reconstruction.reconstruction.
  • 20.
    processing Reformatted raw data Image reconstruction algorithm Reconstructed image ofCT numbers Convolution with filter Image storage, display, recording, archiving Back projection Of convoluted data
  • 21.
    whilst an optimalWW of 1500 and WL of –600 arewhilst an optimal WW of 1500 and WL of –600 are used to assess the lung fields (mostly air)used to assess the lung fields (mostly air) Here the WW will range from +750 to –750, but according to the WL - 600 the WW will be +150 to -1350
  • 22.
    Any Question???. Take yourTiiime!!! . Again Any Question???. Otherwise, I’m going to ask!!!. Should I Ask???.
  • 23.
    Have a nicedayHave a nice day

Editor's Notes

  • #10 Distribution of CT numbers on the Hounsfield and EMI