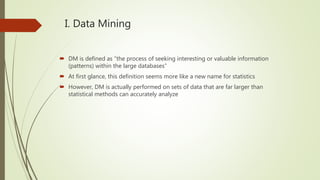
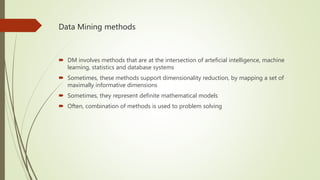
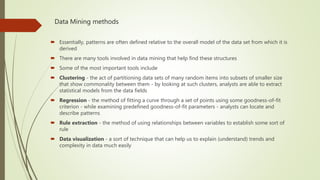
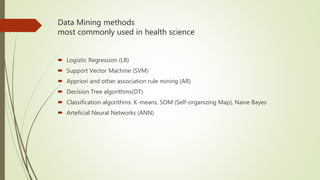
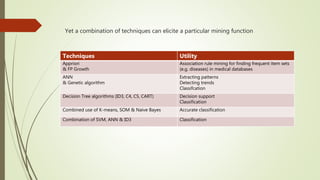
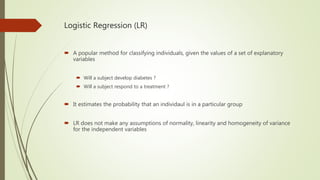
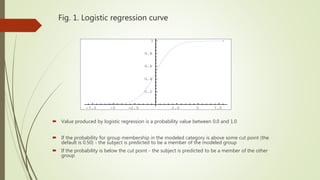
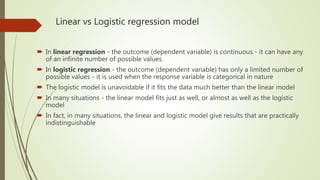
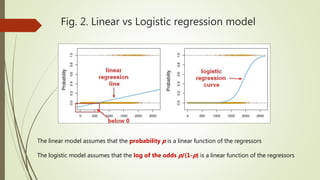
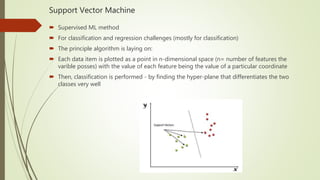
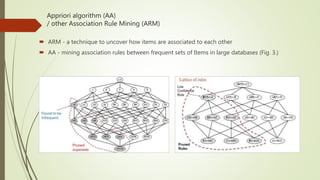
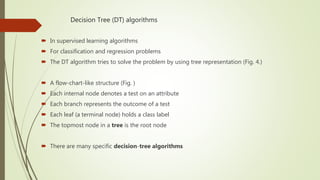
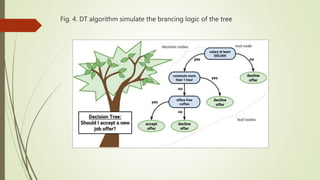
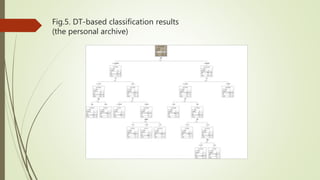
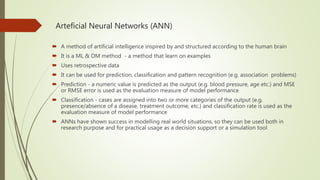
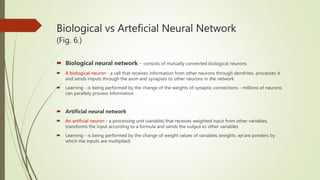
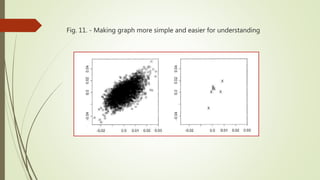
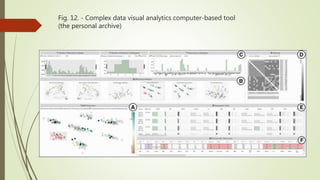
SlideShare a Scribd company logo
Intereg Project
Biomedical Informatics
Ljiljana Majnarić Trtica
II. Basic course on computer-based methods
I. Data Mining
 DM is defined as “the process of seeking interesting or valuable information
(patterns) within the large databases”
 At first glance, this definition seems more like a new name for statistics
 However, DM is actually performed on sets of data that are far larger than
statistical methods can accurately analyze
Data Mining methods
 DM involves methods that are at the intersection of arteficial intelligence, machine
learning, statistics and database systems
 Sometimes, these methods support dimensionality reduction, by mapping a set of
maximally informative dimensions
 Sometimes, they represent definite mathematical models
 Often, combination of methods is used to problem solving
Data Mining methods
 Essentially, patterns are often defined relative to the overall model of the data set from which it is
derived
 There are many tools involved in data mining that help find these structures
 Some of the most important tools include
 Clustering - the act of partitioning data sets of many random items into subsets of smaller size
that show commonality between them - by looking at such clusters, analysts are able to extract
statistical models from the data fields
 Regression - the method of fitting a curve through a set of points using some goodness-of-fit
criterion - while examining predefined goodness-of-fit parameters - analysts can locate and
describe patterns
 Rule extraction - the method of using relationships between variables to establish some sort of
rule
 Data visualization - a sort of technique that can help us to explain (understand) trends and
complexity in data much easily
Data Mining methods
most commonly used in health science
 Logistic Regression (LR)
 Support Vector Machine (SVM)
 Appriori and other association rule mining (AR)
 Decision Tree algorithms(DT)
 Classification algorithms: K-means, SOM (Self-organizing Map), Naive Bayes
 Arteficial Neural Networks (ANN)
Yet a combination of techniques can elicite a particular mining function
Techniques Utility
Appriori
& FP Growth
Association rule mining for finding frequent item sets
(e.g. diseases) in medical databases
ANN
& Genetic algorithm
Extracting patterns
Detecting trends
Classifcation
Decision Tree algorithms (ID3, C4, C5, CART) Decision support
Classification
Combined use of K-means, SOM & Naive Bayes Accurate classification
Combination of SVM, ANN & ID3 Classification
Logistic Regression (LR)
 A popular method for classifying individuals, given the values of a set of explanatory
variables
 Will a subject develop diabetes ?
 Will a subject respond to a treatment ?
 It estimates the probability that an individaul is in a particular group
 LR does not make any assumptions of normality, linearity and homogeneity of variance
for the independent variables
Fig. 1. Logistic regression curve
 Value produced by logistic regression is a probability value between 0.0 and 1.0
 If the probability for group membership in the modeled category is above some cut point (the
default is 0.50) - the subject is predicted to be a member of the modeled group
 If the probability is below the cut point - the subject is predicted to be a member of the other
group
-7.5 -5 -2.5 2.5 5 7.5
0.2
0.4
0.6
0.8
1
Testing the LR model performances (a fit to a series of data)
 Testing the models depending on the probability p
 ROC curve
 C statistics
 GINI coefficient
 KS test
 Testing the models depending on the cuf-off values
 Sensitivity (true positive rate)
 Specificity (true negative rate)
 Accuracy
 Type I error (misclassification of diabetic)
 Type II error (misclassification of healty)
Linear vs Logistic regression model
 In linear regression - the outcome (dependent variable) is continuous - it can have any
of an infinite number of possible values.
 In logistic regression - the outcome (dependent variable) has only a limited number of
possible values - it is used when the response variable is categorical in nature
 The logistic model is unavoidable if it fits the data much better than the linear model
 In many situations - the linear model fits just as well, or almost as well as the logistic
model
 In fact, in many situations, the linear and logistic model give results that are practically
indistinguishable
Fig. 2. Linear vs Logistic regression model
The linear model assumes that the probability p is a linear function of the regressors
The logistic model assumes that the log of the odds p/(1-p) is a linear function of the regressors
Support Vector Machine
 Supervised ML method
 For classification and regression challenges (mostly for classification)
 The principle algorithm is laying on:
 Each data item is plotted as a point in n-dimensional space (n= number of features the
varible posses) with the value of each feature being the value of a particular coordinate
 Then, classification is performed - by finding the hyper-plane that differentiates the two
classes very well
Supervised ML Unsupervised ML
The major part of practical ML uses supervised learning
When there are input variables (x) and an output variable (Y) - an algorithm is used to
learn the mapping function from the input to the output: Y = f(X)
The goal is to approximate the mapping function so well that when you have new
input data (x) - you can predict the output variables (Y) for that data
It is called supervised learning because the process of an algorithm learning from the
training dataset can be thought of as a teacher supervising the learning process.
We know the correct answers, the algorithm iteratively makes predictions on the
training data and is corrected by the teacher
Learning stops when the algorithm achieves an acceptable level of performance
Supervised learning problems can be grouped into regression and classification
problems
Classification - when the output variable is a category, such as “disease” and “no
disease”
Regression - when the output variable is a real value, such as “weight”
Usual methods of Supervised ML are:
Linear regression - for regression problems
Random forest - for classification and regression problems
Support vector machines -for classification problems
When there are only input data (X) and no corresponding
output variables
The goal is to model the underlying structure or
distribution in the data - in order to learn more about the
data
It is called unsupervised learning because unlike supervised
learning - there is no known answer and there is no teacher
Algorithms are left to their own devises to discover and
present the interesting structure in the data
Unsupervised learning problems can be grouped into
clustering and association problems
Clustering - when the problem is to discover the inherent
groupings in the data, such as grouping by purchasing
behavior
Association - when the problem is to discover rules that
describe large portions of your data
Usual methods of Unsupervised ML are:
k-means - for clustering problems
Apriori algorithm - for association rule learning problems
Appriori algorithm (AA)
/ other Association Rule Mining (ARM)
 ARM - a technique to uncover how items are associated to each other
 AA - mining association rules between frequent sets of Items in large databases (Fig. 3.)
Decision Tree (DT) algorithms
 In supervised learning algorithms
 For classification and regression problems
 The DT algorithm tries to solve the problem by using tree representation (Fig. 4.)
 A flow-chart-like structure (Fig. )
 Each internal node denotes a test on an attribute
 Each branch represents the outcome of a test
 Each leaf (a terminal node) holds a class label
 The topmost node in a tree is the root node
 There are many specific decision-tree algorithms
Fig. 4. DT algorithm simulate the brancing logic of the tree
Fig.5. DT-based classification results
(the personal archive)
Arteficial Neural Networks (ANN)
 A method of artificial intelligence inspired by and structured according to the human brain
 It is a ML & DM method - a method that learn on examples
 Uses retrospective data
 It can be used for prediction, classification and pattern recognition (e.g. association problems)
 Prediction - a numeric value is predicted as the output (e.g. blood pressure, age etc.) and MSE
or RMSE error is used as the evaluation measure of model performance
 Classification - cases are assigned into two or more categories of the output (e.g.
presence/absence of a disease, treatment outcome, etc.) and classification rate is used as the
evaluation measure of model performance
 ANNs have shown success in modelling real world situations, so they can be used both in
research purpose and for practical usage as a decision support or a simulation tool
Biological vs Arteficial Neural Network
(Fig. 6.)
 Biological neural network - consists of mutually connected biological neurons
 A biological neuron - a cell that receives information from other neurons through dendrites, processes it
and sends impuls through the axon and synapses to other neurons in the network
 Learning - is being performed by the change of the weights of synaptic connections - millions of neurons
can parallely process information
 Artificial neural network
 An artificial neuron - a processing unit (variable) that receives weighted input from other variables,
transforms the input according to a formula and sends the output to other variables
 Learning - is being performed by the change of weight values of variables (weights wji are ponders by
which the inputs are multiplied)
Fig. 6. - Biological vs arteficial NN
Fig. 7. - Generalization ability of the ANN model needs to be tested
 It does not rely on results obtained on a single sample - many learning iterations
on the training set take place within the middle (hidden) layer - staying between
input and output layers
Criteria for distinguishing ANN algorithms
 Nummber of layers
 Type of learning
• Supervised - real output values are known from the past and provided in the dataset
• Unsupervised - real output values are not known, and not provided in the dataset, these networks are used
to cluster data in groups by characteristics
 Type of connections among neurons
 Connection among input and output data
 Input and transfer functions
 Time characteristics
 Learning time
 etc.
II. Modern computer-based methods
 Graph-based DM
 Data Visualization and Visual Analytics
 Topological DM
 Similar techniques that can be used to organize highly complex and heterogeneous
data
 Data can be very powerful, if you can actually understand what it's telling you
 It's not easy to get clear takeaways by looking at a slew of numbers and stats - you
need the data presented in a logical, easy-to-understand way – that`s the situation
when to enter some of these techniques
Graph-based DM
 In order to apply graph-based data mining techniques, such as classification and
clustering - it is necessary to define proximity measures between data represented in the
graph form (Fig. 8. and 9.)
 There are several within-graph proximity measures
 Hyperlink-Induced Topic Search (HITS)
 The Neumann Kernel (NK)
 Shared Nearest Neighbor (SNN)
Fig. 8. - Defining proximity measures enables structure visible
Scatter plots showing the similarity from -1 to 1
Fig. 9. - Citation graph by using NK-proximity measures
- n1…n8 vertices (articles)
- edges indicate a citation
Citation Matrix C can be formed - If an edge between two vertices exists
then the matrix cell = 1 else = 0
Fig. 10. - How to generalize mathematically
the pattern of a dalmatian dog?
Data Visualization
 The human brain processes visual information better than it processes text - so by
using charts, graphs and design elements - data visualization can help us to explain
(understand) trends and stats much more easily (Fig. 10.)
Fig. 10. - The structure of population by age - commoly used data
visualisation procedure in public health domain
Data visualization
 The samples of data being mined are so vast that scatter plots and histograms will
often fall short representing any information of realistic value (Fig. 11.)
 For that very reason, the analysts concerned with data mining are constantly looking
for better ways to graphically represent data
 No matter what tools analysts will have at their fingertips - the patterns and models
being mined will only be as good in quality as the data that it is being derived from
Fig. 11. - Making graph more simple and easier for understanding
Application domains of Data Visualization and Visual Analytics
techniques
 Visualization of large, complex, multivariate, biological networks
 Visual text analytics and classify relevant related work on biological entities in publi
cation databases (e.g. PubMed)
 Visualization for exploring heterogeneous data
and data from multiple data sources
 Visual analytics as support for understanding uncertainty
and data quality issues
Fig. 12. - Complex data visual analytics computer-based tool
(the personal archive)
Fig. 13. - First visualization of the human
Protein-Protein-Interaction structure
Topological DM
 Applying topological techniques to DM and KDD is a hot and promising future research
area.
 Topology has its roots in theoretical mathematics, but within the last decade,
computational topology rapidly gains interest among computer scientists.
 It is a study of abstract shapes and spaces and mappings between them. It originated
from the study of geometry and set theory.
 Topological methods can be applied to data represented by point clouds, that is, finite
subsets of the n-dimensional Euclidean space.
 The input is presented with a sample of some unknown space which one wishes to
reconstruct and understand.
 Distinguishing between the ambient (embedding) dimension n, and the intrinsic
dimension of the data is of primary interest towards understanding the intrinsic
structure of data.
Topological DM
 Geometrical and topological methods are tools allowing us to analyse highly complex data
 Modern data science uses topological methods to find the structural features of data sets before
further supervised or unsupervised analysis
 Mathematical formalism, which has been developed for incorporating geometric and topological
techniques, deals with point cloud data sets, i.e. finite sets of points
 The point clouds are finite samples taken from a geometric object
 Tools from the various branches of geometry and topology are then used to study the point
cloud data sets
 Topology provides a formal language for qualitative mathematics, whereas geometry is mainly
quantitative.
 Topology studies the relationships of proximity or nearness, since geometry can be regarded as
the study of distance functions
 These methods create a summary or compressed representation of all of the data features to
help to rapidly uncover particular patterns and relationships in data.
 The idea of constructing summaries of entire domains of attributes involves understanding the
relationship between topological and geometric objects constructed from data using various
features
Topological DM
 Fig. 14.
 Forming the computational
structure (down below) from
the shape which one wishes to
reconstruct and understand
(up above)

More Related Content

What's hot

Data Mining
Data MiningData Mining
Data Mining
IIIT ALLAHABAD
 
A survey of modified support vector machine using particle of swarm optimizat...
A survey of modified support vector machine using particle of swarm optimizat...A survey of modified support vector machine using particle of swarm optimizat...
A survey of modified support vector machine using particle of swarm optimizat...
Editor Jacotech
 
Classification techniques in data mining
Classification techniques in data miningClassification techniques in data mining
Classification techniques in data mining
Kamal Acharya
 
IJCSI-10-6-1-288-292
IJCSI-10-6-1-288-292IJCSI-10-6-1-288-292
IJCSI-10-6-1-288-292HARDIK SINGH
 
lazy learners and other classication methods
lazy learners and other classication methodslazy learners and other classication methods
lazy learners and other classication methods
rajshreemuthiah
 
Dma unit 1
Dma unit   1Dma unit   1
Dma unit 1
thamizh arasi
 
Dsa unit 1
Dsa unit 1Dsa unit 1
Dsa unit 1
thamizh arasi
 
Decision tree induction
Decision tree inductionDecision tree induction
Decision tree induction
thamizh arasi
 
IRJET- Evaluation of Classification Algorithms with Solutions to Class Imbala...
IRJET- Evaluation of Classification Algorithms with Solutions to Class Imbala...IRJET- Evaluation of Classification Algorithms with Solutions to Class Imbala...
IRJET- Evaluation of Classification Algorithms with Solutions to Class Imbala...
IRJET Journal
 
Classification and prediction
Classification and predictionClassification and prediction
Classification and prediction
Acad
 
05 Classification And Prediction
05   Classification And Prediction05   Classification And Prediction
05 Classification And Prediction
Achmad Solichin
 
DATA MINING.doc
DATA MINING.docDATA MINING.doc
DATA MINING.docbutest
 
Classification of Breast Cancer Diseases using Data Mining Techniques
Classification of Breast Cancer Diseases using Data Mining TechniquesClassification of Breast Cancer Diseases using Data Mining Techniques
Classification of Breast Cancer Diseases using Data Mining Techniques
inventionjournals
 
Analysis On Classification Techniques In Mammographic Mass Data Set
Analysis On Classification Techniques In Mammographic Mass Data SetAnalysis On Classification Techniques In Mammographic Mass Data Set
Analysis On Classification Techniques In Mammographic Mass Data Set
IJERA Editor
 
Incremental learning from unbalanced data with concept class, concept drift a...
Incremental learning from unbalanced data with concept class, concept drift a...Incremental learning from unbalanced data with concept class, concept drift a...
Incremental learning from unbalanced data with concept class, concept drift a...
IJDKP
 
KNOWLEDGE BASED ANALYSIS OF VARIOUS STATISTICAL TOOLS IN DETECTING BREAST CANCER
KNOWLEDGE BASED ANALYSIS OF VARIOUS STATISTICAL TOOLS IN DETECTING BREAST CANCERKNOWLEDGE BASED ANALYSIS OF VARIOUS STATISTICAL TOOLS IN DETECTING BREAST CANCER
KNOWLEDGE BASED ANALYSIS OF VARIOUS STATISTICAL TOOLS IN DETECTING BREAST CANCER
cscpconf
 
Data mining technique (decision tree)
Data mining technique (decision tree)Data mining technique (decision tree)
Data mining technique (decision tree)
Shweta Ghate
 
report.doc
report.docreport.doc
report.docbutest
 
Associative Classification: Synopsis
Associative Classification: SynopsisAssociative Classification: Synopsis
Associative Classification: SynopsisJagdeep Singh Malhi
 
Lect8 Classification & prediction
Lect8 Classification & predictionLect8 Classification & prediction
Lect8 Classification & prediction
hktripathy
 

What's hot (20)

Data Mining
Data MiningData Mining
Data Mining
 
A survey of modified support vector machine using particle of swarm optimizat...
A survey of modified support vector machine using particle of swarm optimizat...A survey of modified support vector machine using particle of swarm optimizat...
A survey of modified support vector machine using particle of swarm optimizat...
 
Classification techniques in data mining
Classification techniques in data miningClassification techniques in data mining
Classification techniques in data mining
 
IJCSI-10-6-1-288-292
IJCSI-10-6-1-288-292IJCSI-10-6-1-288-292
IJCSI-10-6-1-288-292
 
lazy learners and other classication methods
lazy learners and other classication methodslazy learners and other classication methods
lazy learners and other classication methods
 
Dma unit 1
Dma unit   1Dma unit   1
Dma unit 1
 
Dsa unit 1
Dsa unit 1Dsa unit 1
Dsa unit 1
 
Decision tree induction
Decision tree inductionDecision tree induction
Decision tree induction
 
IRJET- Evaluation of Classification Algorithms with Solutions to Class Imbala...
IRJET- Evaluation of Classification Algorithms with Solutions to Class Imbala...IRJET- Evaluation of Classification Algorithms with Solutions to Class Imbala...
IRJET- Evaluation of Classification Algorithms with Solutions to Class Imbala...
 
Classification and prediction
Classification and predictionClassification and prediction
Classification and prediction
 
05 Classification And Prediction
05   Classification And Prediction05   Classification And Prediction
05 Classification And Prediction
 
DATA MINING.doc
DATA MINING.docDATA MINING.doc
DATA MINING.doc
 
Classification of Breast Cancer Diseases using Data Mining Techniques
Classification of Breast Cancer Diseases using Data Mining TechniquesClassification of Breast Cancer Diseases using Data Mining Techniques
Classification of Breast Cancer Diseases using Data Mining Techniques
 
Analysis On Classification Techniques In Mammographic Mass Data Set
Analysis On Classification Techniques In Mammographic Mass Data SetAnalysis On Classification Techniques In Mammographic Mass Data Set
Analysis On Classification Techniques In Mammographic Mass Data Set
 
Incremental learning from unbalanced data with concept class, concept drift a...
Incremental learning from unbalanced data with concept class, concept drift a...Incremental learning from unbalanced data with concept class, concept drift a...
Incremental learning from unbalanced data with concept class, concept drift a...
 
KNOWLEDGE BASED ANALYSIS OF VARIOUS STATISTICAL TOOLS IN DETECTING BREAST CANCER
KNOWLEDGE BASED ANALYSIS OF VARIOUS STATISTICAL TOOLS IN DETECTING BREAST CANCERKNOWLEDGE BASED ANALYSIS OF VARIOUS STATISTICAL TOOLS IN DETECTING BREAST CANCER
KNOWLEDGE BASED ANALYSIS OF VARIOUS STATISTICAL TOOLS IN DETECTING BREAST CANCER
 
Data mining technique (decision tree)
Data mining technique (decision tree)Data mining technique (decision tree)
Data mining technique (decision tree)
 
report.doc
report.docreport.doc
report.doc
 
Associative Classification: Synopsis
Associative Classification: SynopsisAssociative Classification: Synopsis
Associative Classification: Synopsis
 
Lect8 Classification & prediction
Lect8 Classification & predictionLect8 Classification & prediction
Lect8 Classification & prediction
 

Similar to Basic course on computer-based methods

Singular Value Decomposition (SVD).pptx
Singular Value Decomposition (SVD).pptxSingular Value Decomposition (SVD).pptx
Singular Value Decomposition (SVD).pptx
rajalakshmi5921
 
EDAB Module 5 Singular Value Decomposition (SVD).pptx
EDAB Module 5 Singular Value Decomposition (SVD).pptxEDAB Module 5 Singular Value Decomposition (SVD).pptx
EDAB Module 5 Singular Value Decomposition (SVD).pptx
rajalakshmi5921
 
Unit-3 Data Analytics.pdf
Unit-3 Data Analytics.pdfUnit-3 Data Analytics.pdf
Unit-3 Data Analytics.pdf
Sitamarhi Institute of Technology
 
Unit-3 Data Analytics.pdf
Unit-3 Data Analytics.pdfUnit-3 Data Analytics.pdf
Unit-3 Data Analytics.pdf
Sitamarhi Institute of Technology
 
Unit-3 Data Analytics.pdf
Unit-3 Data Analytics.pdfUnit-3 Data Analytics.pdf
Unit-3 Data Analytics.pdf
Sitamarhi Institute of Technology
 
Classifiers
ClassifiersClassifiers
Classifiers
Ayurdata
 
5. Machine Learning.pptx
5.  Machine Learning.pptx5.  Machine Learning.pptx
5. Machine Learning.pptx
ssuser6654de1
 
Performance Comparision of Machine Learning Algorithms
Performance Comparision of Machine Learning AlgorithmsPerformance Comparision of Machine Learning Algorithms
Performance Comparision of Machine Learning Algorithms
Dinusha Dilanka
 
Machine learning module 2
Machine learning module 2Machine learning module 2
Machine learning module 2
Gokulks007
 
Data mining: Classification and Prediction
Data mining: Classification and PredictionData mining: Classification and Prediction
Data mining: Classification and Prediction
Datamining Tools
 
Machine learning - session 3
Machine learning - session 3Machine learning - session 3
Machine learning - session 3
Luis Borbon
 
Data Science - Part V - Decision Trees & Random Forests
Data Science - Part V - Decision Trees & Random Forests Data Science - Part V - Decision Trees & Random Forests
Data Science - Part V - Decision Trees & Random Forests
Derek Kane
 
Machine Learning.pptx
Machine Learning.pptxMachine Learning.pptx
Machine Learning.pptx
NitinSharma134320
 
IT-601 Lecture Notes-UNIT-2.pdf Data Analysis
IT-601 Lecture Notes-UNIT-2.pdf Data AnalysisIT-601 Lecture Notes-UNIT-2.pdf Data Analysis
IT-601 Lecture Notes-UNIT-2.pdf Data Analysis
Dr. Radhey Shyam
 
KIT-601 Lecture Notes-UNIT-2.pdf
KIT-601 Lecture Notes-UNIT-2.pdfKIT-601 Lecture Notes-UNIT-2.pdf
KIT-601 Lecture Notes-UNIT-2.pdf
Dr. Radhey Shyam
 
Exam Short Preparation on Data Analytics
Exam Short Preparation on Data AnalyticsExam Short Preparation on Data Analytics
Exam Short Preparation on Data Analytics
Harsh Parekh
 
IMAGE CLASSIFICATION USING DIFFERENT CLASSICAL APPROACHES
IMAGE CLASSIFICATION USING DIFFERENT CLASSICAL APPROACHESIMAGE CLASSIFICATION USING DIFFERENT CLASSICAL APPROACHES
IMAGE CLASSIFICATION USING DIFFERENT CLASSICAL APPROACHES
Vikash Kumar
 
A discriminative-feature-space-for-detecting-and-recognizing-pathologies-of-t...
A discriminative-feature-space-for-detecting-and-recognizing-pathologies-of-t...A discriminative-feature-space-for-detecting-and-recognizing-pathologies-of-t...
A discriminative-feature-space-for-detecting-and-recognizing-pathologies-of-t...
Damian R. Mingle, MBA
 
Top Machine Learning Algorithms Used By AI Professionals ARTiBA.pdf
Top Machine Learning Algorithms Used By AI Professionals ARTiBA.pdfTop Machine Learning Algorithms Used By AI Professionals ARTiBA.pdf
Top Machine Learning Algorithms Used By AI Professionals ARTiBA.pdf
Artificial Intelligence Board of America
 
A Formal Machine Learning or Multi Objective Decision Making System for Deter...
A Formal Machine Learning or Multi Objective Decision Making System for Deter...A Formal Machine Learning or Multi Objective Decision Making System for Deter...
A Formal Machine Learning or Multi Objective Decision Making System for Deter...
Editor IJCATR
 

Similar to Basic course on computer-based methods (20)

Singular Value Decomposition (SVD).pptx
Singular Value Decomposition (SVD).pptxSingular Value Decomposition (SVD).pptx
Singular Value Decomposition (SVD).pptx
 
EDAB Module 5 Singular Value Decomposition (SVD).pptx
EDAB Module 5 Singular Value Decomposition (SVD).pptxEDAB Module 5 Singular Value Decomposition (SVD).pptx
EDAB Module 5 Singular Value Decomposition (SVD).pptx
 
Unit-3 Data Analytics.pdf
Unit-3 Data Analytics.pdfUnit-3 Data Analytics.pdf
Unit-3 Data Analytics.pdf
 
Unit-3 Data Analytics.pdf
Unit-3 Data Analytics.pdfUnit-3 Data Analytics.pdf
Unit-3 Data Analytics.pdf
 
Unit-3 Data Analytics.pdf
Unit-3 Data Analytics.pdfUnit-3 Data Analytics.pdf
Unit-3 Data Analytics.pdf
 
Classifiers
ClassifiersClassifiers
Classifiers
 
5. Machine Learning.pptx
5.  Machine Learning.pptx5.  Machine Learning.pptx
5. Machine Learning.pptx
 
Performance Comparision of Machine Learning Algorithms
Performance Comparision of Machine Learning AlgorithmsPerformance Comparision of Machine Learning Algorithms
Performance Comparision of Machine Learning Algorithms
 
Machine learning module 2
Machine learning module 2Machine learning module 2
Machine learning module 2
 
Data mining: Classification and Prediction
Data mining: Classification and PredictionData mining: Classification and Prediction
Data mining: Classification and Prediction
 
Machine learning - session 3
Machine learning - session 3Machine learning - session 3
Machine learning - session 3
 
Data Science - Part V - Decision Trees & Random Forests
Data Science - Part V - Decision Trees & Random Forests Data Science - Part V - Decision Trees & Random Forests
Data Science - Part V - Decision Trees & Random Forests
 
Machine Learning.pptx
Machine Learning.pptxMachine Learning.pptx
Machine Learning.pptx
 
IT-601 Lecture Notes-UNIT-2.pdf Data Analysis
IT-601 Lecture Notes-UNIT-2.pdf Data AnalysisIT-601 Lecture Notes-UNIT-2.pdf Data Analysis
IT-601 Lecture Notes-UNIT-2.pdf Data Analysis
 
KIT-601 Lecture Notes-UNIT-2.pdf
KIT-601 Lecture Notes-UNIT-2.pdfKIT-601 Lecture Notes-UNIT-2.pdf
KIT-601 Lecture Notes-UNIT-2.pdf
 
Exam Short Preparation on Data Analytics
Exam Short Preparation on Data AnalyticsExam Short Preparation on Data Analytics
Exam Short Preparation on Data Analytics
 
IMAGE CLASSIFICATION USING DIFFERENT CLASSICAL APPROACHES
IMAGE CLASSIFICATION USING DIFFERENT CLASSICAL APPROACHESIMAGE CLASSIFICATION USING DIFFERENT CLASSICAL APPROACHES
IMAGE CLASSIFICATION USING DIFFERENT CLASSICAL APPROACHES
 
A discriminative-feature-space-for-detecting-and-recognizing-pathologies-of-t...
A discriminative-feature-space-for-detecting-and-recognizing-pathologies-of-t...A discriminative-feature-space-for-detecting-and-recognizing-pathologies-of-t...
A discriminative-feature-space-for-detecting-and-recognizing-pathologies-of-t...
 
Top Machine Learning Algorithms Used By AI Professionals ARTiBA.pdf
Top Machine Learning Algorithms Used By AI Professionals ARTiBA.pdfTop Machine Learning Algorithms Used By AI Professionals ARTiBA.pdf
Top Machine Learning Algorithms Used By AI Professionals ARTiBA.pdf
 
A Formal Machine Learning or Multi Objective Decision Making System for Deter...
A Formal Machine Learning or Multi Objective Decision Making System for Deter...A Formal Machine Learning or Multi Objective Decision Making System for Deter...
A Formal Machine Learning or Multi Objective Decision Making System for Deter...
 

More from improvemed

2019 2020 predavanje letenje, ronjenje drenjancevic
2019 2020 predavanje letenje, ronjenje drenjancevic2019 2020 predavanje letenje, ronjenje drenjancevic
2019 2020 predavanje letenje, ronjenje drenjancevic
improvemed
 
In vitro models of hepatotoxicity
In vitro models of hepatotoxicityIn vitro models of hepatotoxicity
In vitro models of hepatotoxicity
improvemed
 
Etiology of liver diseases
Etiology of liver diseasesEtiology of liver diseases
Etiology of liver diseases
improvemed
 
An introduction to experimental epidemiology
An introduction to experimental epidemiology An introduction to experimental epidemiology
An introduction to experimental epidemiology
improvemed
 
Genotyping methods of nosocomial infections pathogen
Genotyping methods of nosocomial infections pathogenGenotyping methods of nosocomial infections pathogen
Genotyping methods of nosocomial infections pathogen
improvemed
 
Use of MALDI-TOF in the diagnosis of infectious diseases
Use of MALDI-TOF in the diagnosis of infectious diseasesUse of MALDI-TOF in the diagnosis of infectious diseases
Use of MALDI-TOF in the diagnosis of infectious diseases
improvemed
 
Molecular microbiology methods
Molecular microbiology methodsMolecular microbiology methods
Molecular microbiology methods
improvemed
 
Isolated vascular rings
Isolated vascular ringsIsolated vascular rings
Isolated vascular rings
improvemed
 
Isolated blood vessels
Isolated blood vesselsIsolated blood vessels
Isolated blood vessels
improvemed
 
Notes for Measuring blood flow and reactivity of the blood vessels in the ski...
Notes for Measuring blood flow and reactivity of the blood vessels in the ski...Notes for Measuring blood flow and reactivity of the blood vessels in the ski...
Notes for Measuring blood flow and reactivity of the blood vessels in the ski...
improvemed
 
Notes for STAINING AND ANALYSIS of HISTOLOGICAL PREPARATIONS
Notes for STAINING AND ANALYSIS of HISTOLOGICAL PREPARATIONSNotes for STAINING AND ANALYSIS of HISTOLOGICAL PREPARATIONS
Notes for STAINING AND ANALYSIS of HISTOLOGICAL PREPARATIONS
improvemed
 
Notes for Fixation of tissues and organs for educational and scientific purposes
Notes for Fixation of tissues and organs for educational and scientific purposesNotes for Fixation of tissues and organs for educational and scientific purposes
Notes for Fixation of tissues and organs for educational and scientific purposes
improvemed
 
Notes for
Notes for Notes for
Notes for
improvemed
 
Notes for The principle and performance of capillary electrophoresis
Notes for The principle and performance of capillary electrophoresisNotes for The principle and performance of capillary electrophoresis
Notes for The principle and performance of capillary electrophoresis
improvemed
 
Notes for The principle and performance of liquid chromatography–mass spectro...
Notes for The principle and performance of liquid chromatography–mass spectro...Notes for The principle and performance of liquid chromatography–mass spectro...
Notes for The principle and performance of liquid chromatography–mass spectro...
improvemed
 
Notes for Cell Culture Basic Techniques
Notes for Cell Culture Basic TechniquesNotes for Cell Culture Basic Techniques
Notes for Cell Culture Basic Techniques
improvemed
 
Big datasets
Big datasetsBig datasets
Big datasets
improvemed
 
Systems biology for Medicine' is 'Experimental methods and the big datasets
Systems biology for Medicine' is 'Experimental methods and the big datasetsSystems biology for Medicine' is 'Experimental methods and the big datasets
Systems biology for Medicine' is 'Experimental methods and the big datasets
improvemed
 
Systems biology for medical students/Systems medicine
Systems biology for medical students/Systems medicineSystems biology for medical students/Systems medicine
Systems biology for medical students/Systems medicine
improvemed
 
Use cases
Use casesUse cases
Use cases
improvemed
 

More from improvemed (20)

2019 2020 predavanje letenje, ronjenje drenjancevic
2019 2020 predavanje letenje, ronjenje drenjancevic2019 2020 predavanje letenje, ronjenje drenjancevic
2019 2020 predavanje letenje, ronjenje drenjancevic
 
In vitro models of hepatotoxicity
In vitro models of hepatotoxicityIn vitro models of hepatotoxicity
In vitro models of hepatotoxicity
 
Etiology of liver diseases
Etiology of liver diseasesEtiology of liver diseases
Etiology of liver diseases
 
An introduction to experimental epidemiology
An introduction to experimental epidemiology An introduction to experimental epidemiology
An introduction to experimental epidemiology
 
Genotyping methods of nosocomial infections pathogen
Genotyping methods of nosocomial infections pathogenGenotyping methods of nosocomial infections pathogen
Genotyping methods of nosocomial infections pathogen
 
Use of MALDI-TOF in the diagnosis of infectious diseases
Use of MALDI-TOF in the diagnosis of infectious diseasesUse of MALDI-TOF in the diagnosis of infectious diseases
Use of MALDI-TOF in the diagnosis of infectious diseases
 
Molecular microbiology methods
Molecular microbiology methodsMolecular microbiology methods
Molecular microbiology methods
 
Isolated vascular rings
Isolated vascular ringsIsolated vascular rings
Isolated vascular rings
 
Isolated blood vessels
Isolated blood vesselsIsolated blood vessels
Isolated blood vessels
 
Notes for Measuring blood flow and reactivity of the blood vessels in the ski...
Notes for Measuring blood flow and reactivity of the blood vessels in the ski...Notes for Measuring blood flow and reactivity of the blood vessels in the ski...
Notes for Measuring blood flow and reactivity of the blood vessels in the ski...
 
Notes for STAINING AND ANALYSIS of HISTOLOGICAL PREPARATIONS
Notes for STAINING AND ANALYSIS of HISTOLOGICAL PREPARATIONSNotes for STAINING AND ANALYSIS of HISTOLOGICAL PREPARATIONS
Notes for STAINING AND ANALYSIS of HISTOLOGICAL PREPARATIONS
 
Notes for Fixation of tissues and organs for educational and scientific purposes
Notes for Fixation of tissues and organs for educational and scientific purposesNotes for Fixation of tissues and organs for educational and scientific purposes
Notes for Fixation of tissues and organs for educational and scientific purposes
 
Notes for
Notes for Notes for
Notes for
 
Notes for The principle and performance of capillary electrophoresis
Notes for The principle and performance of capillary electrophoresisNotes for The principle and performance of capillary electrophoresis
Notes for The principle and performance of capillary electrophoresis
 
Notes for The principle and performance of liquid chromatography–mass spectro...
Notes for The principle and performance of liquid chromatography–mass spectro...Notes for The principle and performance of liquid chromatography–mass spectro...
Notes for The principle and performance of liquid chromatography–mass spectro...
 
Notes for Cell Culture Basic Techniques
Notes for Cell Culture Basic TechniquesNotes for Cell Culture Basic Techniques
Notes for Cell Culture Basic Techniques
 
Big datasets
Big datasetsBig datasets
Big datasets
 
Systems biology for Medicine' is 'Experimental methods and the big datasets
Systems biology for Medicine' is 'Experimental methods and the big datasetsSystems biology for Medicine' is 'Experimental methods and the big datasets
Systems biology for Medicine' is 'Experimental methods and the big datasets
 
Systems biology for medical students/Systems medicine
Systems biology for medical students/Systems medicineSystems biology for medical students/Systems medicine
Systems biology for medical students/Systems medicine
 
Use cases
Use casesUse cases
Use cases
 

Recently uploaded

New Drug Discovery and Development .....
New Drug Discovery and Development .....New Drug Discovery and Development .....
New Drug Discovery and Development .....
NEHA GUPTA
 
Knee anatomy and clinical tests 2024.pdf
Knee anatomy and clinical tests 2024.pdfKnee anatomy and clinical tests 2024.pdf
Knee anatomy and clinical tests 2024.pdf
vimalpl1234
 
Best Ayurvedic medicine for Gas and Indigestion
Best Ayurvedic medicine for Gas and IndigestionBest Ayurvedic medicine for Gas and Indigestion
Best Ayurvedic medicine for Gas and Indigestion
SwastikAyurveda
 
CDSCO and Phamacovigilance {Regulatory body in India}
CDSCO and Phamacovigilance {Regulatory body in India}CDSCO and Phamacovigilance {Regulatory body in India}
CDSCO and Phamacovigilance {Regulatory body in India}
NEHA GUPTA
 
SURGICAL ANATOMY OF THE RETROPERITONEUM, ADRENALS, KIDNEYS AND URETERS.pptx
SURGICAL ANATOMY OF THE RETROPERITONEUM, ADRENALS, KIDNEYS AND URETERS.pptxSURGICAL ANATOMY OF THE RETROPERITONEUM, ADRENALS, KIDNEYS AND URETERS.pptx
SURGICAL ANATOMY OF THE RETROPERITONEUM, ADRENALS, KIDNEYS AND URETERS.pptx
Bright Chipili
 
Light House Retreats: Plant Medicine Retreat Europe
Light House Retreats: Plant Medicine Retreat EuropeLight House Retreats: Plant Medicine Retreat Europe
Light House Retreats: Plant Medicine Retreat Europe
Lighthouse Retreat
 
Sex determination from mandible pelvis and skull
Sex determination from mandible pelvis and skullSex determination from mandible pelvis and skull
Sex determination from mandible pelvis and skull
ShashankRoodkee
 
Superficial & Deep Fascia of the NECK.pptx
Superficial & Deep Fascia of the NECK.pptxSuperficial & Deep Fascia of the NECK.pptx
Superficial & Deep Fascia of the NECK.pptx
Dr. Rabia Inam Gandapore
 
Pharma Pcd Franchise in Jharkhand - Yodley Lifesciences
Pharma Pcd Franchise in Jharkhand - Yodley LifesciencesPharma Pcd Franchise in Jharkhand - Yodley Lifesciences
Pharma Pcd Franchise in Jharkhand - Yodley Lifesciences
Yodley Lifesciences
 
Role of Mukta Pishti in the Management of Hyperthyroidism
Role of Mukta Pishti in the Management of HyperthyroidismRole of Mukta Pishti in the Management of Hyperthyroidism
Role of Mukta Pishti in the Management of Hyperthyroidism
Dr. Jyothirmai Paindla
 
KDIGO 2024 guidelines for diabetologists
KDIGO 2024 guidelines for diabetologistsKDIGO 2024 guidelines for diabetologists
KDIGO 2024 guidelines for diabetologists
د.محمود نجيب
 
Cervical & Brachial Plexus By Dr. RIG.pptx
Cervical & Brachial Plexus By Dr. RIG.pptxCervical & Brachial Plexus By Dr. RIG.pptx
Cervical & Brachial Plexus By Dr. RIG.pptx
Dr. Rabia Inam Gandapore
 
Hemodialysis: Chapter 4, Dialysate Circuit - Dr.Gawad
Hemodialysis: Chapter 4, Dialysate Circuit - Dr.GawadHemodialysis: Chapter 4, Dialysate Circuit - Dr.Gawad
Hemodialysis: Chapter 4, Dialysate Circuit - Dr.Gawad
NephroTube - Dr.Gawad
 
Basavarajeeyam - Ayurvedic heritage book of Andhra pradesh
Basavarajeeyam - Ayurvedic heritage book of Andhra pradeshBasavarajeeyam - Ayurvedic heritage book of Andhra pradesh
Basavarajeeyam - Ayurvedic heritage book of Andhra pradesh
Dr. Madduru Muni Haritha
 
Cardiac Assessment for B.sc Nursing Student.pdf
Cardiac Assessment for B.sc Nursing Student.pdfCardiac Assessment for B.sc Nursing Student.pdf
Cardiac Assessment for B.sc Nursing Student.pdf
shivalingatalekar1
 
micro teaching on communication m.sc nursing.pdf
micro teaching on communication m.sc nursing.pdfmicro teaching on communication m.sc nursing.pdf
micro teaching on communication m.sc nursing.pdf
Anurag Sharma
 
Tom Selleck Health: A Comprehensive Look at the Iconic Actor’s Wellness Journey
Tom Selleck Health: A Comprehensive Look at the Iconic Actor’s Wellness JourneyTom Selleck Health: A Comprehensive Look at the Iconic Actor’s Wellness Journey
Tom Selleck Health: A Comprehensive Look at the Iconic Actor’s Wellness Journey
greendigital
 
Novas diretrizes da OMS para os cuidados perinatais de mais qualidade
Novas diretrizes da OMS para os cuidados perinatais de mais qualidadeNovas diretrizes da OMS para os cuidados perinatais de mais qualidade
Novas diretrizes da OMS para os cuidados perinatais de mais qualidade
Prof. Marcus Renato de Carvalho
 
Top-Vitamin-Supplement-Brands-in-India.pptx
Top-Vitamin-Supplement-Brands-in-India.pptxTop-Vitamin-Supplement-Brands-in-India.pptx
Top-Vitamin-Supplement-Brands-in-India.pptx
SwisschemDerma
 
Physiology of Special Chemical Sensation of Taste
Physiology of Special Chemical Sensation of TastePhysiology of Special Chemical Sensation of Taste
Physiology of Special Chemical Sensation of Taste
MedicoseAcademics
 

Recently uploaded (20)

New Drug Discovery and Development .....
New Drug Discovery and Development .....New Drug Discovery and Development .....
New Drug Discovery and Development .....
 
Knee anatomy and clinical tests 2024.pdf
Knee anatomy and clinical tests 2024.pdfKnee anatomy and clinical tests 2024.pdf
Knee anatomy and clinical tests 2024.pdf
 
Best Ayurvedic medicine for Gas and Indigestion
Best Ayurvedic medicine for Gas and IndigestionBest Ayurvedic medicine for Gas and Indigestion
Best Ayurvedic medicine for Gas and Indigestion
 
CDSCO and Phamacovigilance {Regulatory body in India}
CDSCO and Phamacovigilance {Regulatory body in India}CDSCO and Phamacovigilance {Regulatory body in India}
CDSCO and Phamacovigilance {Regulatory body in India}
 
SURGICAL ANATOMY OF THE RETROPERITONEUM, ADRENALS, KIDNEYS AND URETERS.pptx
SURGICAL ANATOMY OF THE RETROPERITONEUM, ADRENALS, KIDNEYS AND URETERS.pptxSURGICAL ANATOMY OF THE RETROPERITONEUM, ADRENALS, KIDNEYS AND URETERS.pptx
SURGICAL ANATOMY OF THE RETROPERITONEUM, ADRENALS, KIDNEYS AND URETERS.pptx
 
Light House Retreats: Plant Medicine Retreat Europe
Light House Retreats: Plant Medicine Retreat EuropeLight House Retreats: Plant Medicine Retreat Europe
Light House Retreats: Plant Medicine Retreat Europe
 
Sex determination from mandible pelvis and skull
Sex determination from mandible pelvis and skullSex determination from mandible pelvis and skull
Sex determination from mandible pelvis and skull
 
Superficial & Deep Fascia of the NECK.pptx
Superficial & Deep Fascia of the NECK.pptxSuperficial & Deep Fascia of the NECK.pptx
Superficial & Deep Fascia of the NECK.pptx
 
Pharma Pcd Franchise in Jharkhand - Yodley Lifesciences
Pharma Pcd Franchise in Jharkhand - Yodley LifesciencesPharma Pcd Franchise in Jharkhand - Yodley Lifesciences
Pharma Pcd Franchise in Jharkhand - Yodley Lifesciences
 
Role of Mukta Pishti in the Management of Hyperthyroidism
Role of Mukta Pishti in the Management of HyperthyroidismRole of Mukta Pishti in the Management of Hyperthyroidism
Role of Mukta Pishti in the Management of Hyperthyroidism
 
KDIGO 2024 guidelines for diabetologists
KDIGO 2024 guidelines for diabetologistsKDIGO 2024 guidelines for diabetologists
KDIGO 2024 guidelines for diabetologists
 
Cervical & Brachial Plexus By Dr. RIG.pptx
Cervical & Brachial Plexus By Dr. RIG.pptxCervical & Brachial Plexus By Dr. RIG.pptx
Cervical & Brachial Plexus By Dr. RIG.pptx
 
Hemodialysis: Chapter 4, Dialysate Circuit - Dr.Gawad
Hemodialysis: Chapter 4, Dialysate Circuit - Dr.GawadHemodialysis: Chapter 4, Dialysate Circuit - Dr.Gawad
Hemodialysis: Chapter 4, Dialysate Circuit - Dr.Gawad
 
Basavarajeeyam - Ayurvedic heritage book of Andhra pradesh
Basavarajeeyam - Ayurvedic heritage book of Andhra pradeshBasavarajeeyam - Ayurvedic heritage book of Andhra pradesh
Basavarajeeyam - Ayurvedic heritage book of Andhra pradesh
 
Cardiac Assessment for B.sc Nursing Student.pdf
Cardiac Assessment for B.sc Nursing Student.pdfCardiac Assessment for B.sc Nursing Student.pdf
Cardiac Assessment for B.sc Nursing Student.pdf
 
micro teaching on communication m.sc nursing.pdf
micro teaching on communication m.sc nursing.pdfmicro teaching on communication m.sc nursing.pdf
micro teaching on communication m.sc nursing.pdf
 
Tom Selleck Health: A Comprehensive Look at the Iconic Actor’s Wellness Journey
Tom Selleck Health: A Comprehensive Look at the Iconic Actor’s Wellness JourneyTom Selleck Health: A Comprehensive Look at the Iconic Actor’s Wellness Journey
Tom Selleck Health: A Comprehensive Look at the Iconic Actor’s Wellness Journey
 
Novas diretrizes da OMS para os cuidados perinatais de mais qualidade
Novas diretrizes da OMS para os cuidados perinatais de mais qualidadeNovas diretrizes da OMS para os cuidados perinatais de mais qualidade
Novas diretrizes da OMS para os cuidados perinatais de mais qualidade
 
Top-Vitamin-Supplement-Brands-in-India.pptx
Top-Vitamin-Supplement-Brands-in-India.pptxTop-Vitamin-Supplement-Brands-in-India.pptx
Top-Vitamin-Supplement-Brands-in-India.pptx
 
Physiology of Special Chemical Sensation of Taste
Physiology of Special Chemical Sensation of TastePhysiology of Special Chemical Sensation of Taste
Physiology of Special Chemical Sensation of Taste
 

Basic course on computer-based methods

  • 1. Intereg Project Biomedical Informatics Ljiljana Majnarić Trtica II. Basic course on computer-based methods
  • 2. I. Data Mining  DM is defined as “the process of seeking interesting or valuable information (patterns) within the large databases”  At first glance, this definition seems more like a new name for statistics  However, DM is actually performed on sets of data that are far larger than statistical methods can accurately analyze
  • 3. Data Mining methods  DM involves methods that are at the intersection of arteficial intelligence, machine learning, statistics and database systems  Sometimes, these methods support dimensionality reduction, by mapping a set of maximally informative dimensions  Sometimes, they represent definite mathematical models  Often, combination of methods is used to problem solving
  • 4. Data Mining methods  Essentially, patterns are often defined relative to the overall model of the data set from which it is derived  There are many tools involved in data mining that help find these structures  Some of the most important tools include  Clustering - the act of partitioning data sets of many random items into subsets of smaller size that show commonality between them - by looking at such clusters, analysts are able to extract statistical models from the data fields  Regression - the method of fitting a curve through a set of points using some goodness-of-fit criterion - while examining predefined goodness-of-fit parameters - analysts can locate and describe patterns  Rule extraction - the method of using relationships between variables to establish some sort of rule  Data visualization - a sort of technique that can help us to explain (understand) trends and complexity in data much easily
  • 5. Data Mining methods most commonly used in health science  Logistic Regression (LR)  Support Vector Machine (SVM)  Appriori and other association rule mining (AR)  Decision Tree algorithms(DT)  Classification algorithms: K-means, SOM (Self-organizing Map), Naive Bayes  Arteficial Neural Networks (ANN)
  • 6. Yet a combination of techniques can elicite a particular mining function Techniques Utility Appriori & FP Growth Association rule mining for finding frequent item sets (e.g. diseases) in medical databases ANN & Genetic algorithm Extracting patterns Detecting trends Classifcation Decision Tree algorithms (ID3, C4, C5, CART) Decision support Classification Combined use of K-means, SOM & Naive Bayes Accurate classification Combination of SVM, ANN & ID3 Classification
  • 7. Logistic Regression (LR)  A popular method for classifying individuals, given the values of a set of explanatory variables  Will a subject develop diabetes ?  Will a subject respond to a treatment ?  It estimates the probability that an individaul is in a particular group  LR does not make any assumptions of normality, linearity and homogeneity of variance for the independent variables
  • 8. Fig. 1. Logistic regression curve  Value produced by logistic regression is a probability value between 0.0 and 1.0  If the probability for group membership in the modeled category is above some cut point (the default is 0.50) - the subject is predicted to be a member of the modeled group  If the probability is below the cut point - the subject is predicted to be a member of the other group -7.5 -5 -2.5 2.5 5 7.5 0.2 0.4 0.6 0.8 1
  • 9. Testing the LR model performances (a fit to a series of data)  Testing the models depending on the probability p  ROC curve  C statistics  GINI coefficient  KS test  Testing the models depending on the cuf-off values  Sensitivity (true positive rate)  Specificity (true negative rate)  Accuracy  Type I error (misclassification of diabetic)  Type II error (misclassification of healty)
  • 10. Linear vs Logistic regression model  In linear regression - the outcome (dependent variable) is continuous - it can have any of an infinite number of possible values.  In logistic regression - the outcome (dependent variable) has only a limited number of possible values - it is used when the response variable is categorical in nature  The logistic model is unavoidable if it fits the data much better than the linear model  In many situations - the linear model fits just as well, or almost as well as the logistic model  In fact, in many situations, the linear and logistic model give results that are practically indistinguishable
  • 11. Fig. 2. Linear vs Logistic regression model The linear model assumes that the probability p is a linear function of the regressors The logistic model assumes that the log of the odds p/(1-p) is a linear function of the regressors
  • 12. Support Vector Machine  Supervised ML method  For classification and regression challenges (mostly for classification)  The principle algorithm is laying on:  Each data item is plotted as a point in n-dimensional space (n= number of features the varible posses) with the value of each feature being the value of a particular coordinate  Then, classification is performed - by finding the hyper-plane that differentiates the two classes very well
  • 13. Supervised ML Unsupervised ML The major part of practical ML uses supervised learning When there are input variables (x) and an output variable (Y) - an algorithm is used to learn the mapping function from the input to the output: Y = f(X) The goal is to approximate the mapping function so well that when you have new input data (x) - you can predict the output variables (Y) for that data It is called supervised learning because the process of an algorithm learning from the training dataset can be thought of as a teacher supervising the learning process. We know the correct answers, the algorithm iteratively makes predictions on the training data and is corrected by the teacher Learning stops when the algorithm achieves an acceptable level of performance Supervised learning problems can be grouped into regression and classification problems Classification - when the output variable is a category, such as “disease” and “no disease” Regression - when the output variable is a real value, such as “weight” Usual methods of Supervised ML are: Linear regression - for regression problems Random forest - for classification and regression problems Support vector machines -for classification problems When there are only input data (X) and no corresponding output variables The goal is to model the underlying structure or distribution in the data - in order to learn more about the data It is called unsupervised learning because unlike supervised learning - there is no known answer and there is no teacher Algorithms are left to their own devises to discover and present the interesting structure in the data Unsupervised learning problems can be grouped into clustering and association problems Clustering - when the problem is to discover the inherent groupings in the data, such as grouping by purchasing behavior Association - when the problem is to discover rules that describe large portions of your data Usual methods of Unsupervised ML are: k-means - for clustering problems Apriori algorithm - for association rule learning problems
  • 14. Appriori algorithm (AA) / other Association Rule Mining (ARM)  ARM - a technique to uncover how items are associated to each other  AA - mining association rules between frequent sets of Items in large databases (Fig. 3.)
  • 15. Decision Tree (DT) algorithms  In supervised learning algorithms  For classification and regression problems  The DT algorithm tries to solve the problem by using tree representation (Fig. 4.)  A flow-chart-like structure (Fig. )  Each internal node denotes a test on an attribute  Each branch represents the outcome of a test  Each leaf (a terminal node) holds a class label  The topmost node in a tree is the root node  There are many specific decision-tree algorithms
  • 16. Fig. 4. DT algorithm simulate the brancing logic of the tree
  • 17. Fig.5. DT-based classification results (the personal archive)
  • 18. Arteficial Neural Networks (ANN)  A method of artificial intelligence inspired by and structured according to the human brain  It is a ML & DM method - a method that learn on examples  Uses retrospective data  It can be used for prediction, classification and pattern recognition (e.g. association problems)  Prediction - a numeric value is predicted as the output (e.g. blood pressure, age etc.) and MSE or RMSE error is used as the evaluation measure of model performance  Classification - cases are assigned into two or more categories of the output (e.g. presence/absence of a disease, treatment outcome, etc.) and classification rate is used as the evaluation measure of model performance  ANNs have shown success in modelling real world situations, so they can be used both in research purpose and for practical usage as a decision support or a simulation tool
  • 19. Biological vs Arteficial Neural Network (Fig. 6.)  Biological neural network - consists of mutually connected biological neurons  A biological neuron - a cell that receives information from other neurons through dendrites, processes it and sends impuls through the axon and synapses to other neurons in the network  Learning - is being performed by the change of the weights of synaptic connections - millions of neurons can parallely process information  Artificial neural network  An artificial neuron - a processing unit (variable) that receives weighted input from other variables, transforms the input according to a formula and sends the output to other variables  Learning - is being performed by the change of weight values of variables (weights wji are ponders by which the inputs are multiplied)
  • 20. Fig. 6. - Biological vs arteficial NN
  • 21. Fig. 7. - Generalization ability of the ANN model needs to be tested  It does not rely on results obtained on a single sample - many learning iterations on the training set take place within the middle (hidden) layer - staying between input and output layers
  • 22. Criteria for distinguishing ANN algorithms  Nummber of layers  Type of learning • Supervised - real output values are known from the past and provided in the dataset • Unsupervised - real output values are not known, and not provided in the dataset, these networks are used to cluster data in groups by characteristics  Type of connections among neurons  Connection among input and output data  Input and transfer functions  Time characteristics  Learning time  etc.
  • 23. II. Modern computer-based methods  Graph-based DM  Data Visualization and Visual Analytics  Topological DM  Similar techniques that can be used to organize highly complex and heterogeneous data  Data can be very powerful, if you can actually understand what it's telling you  It's not easy to get clear takeaways by looking at a slew of numbers and stats - you need the data presented in a logical, easy-to-understand way – that`s the situation when to enter some of these techniques
  • 24. Graph-based DM  In order to apply graph-based data mining techniques, such as classification and clustering - it is necessary to define proximity measures between data represented in the graph form (Fig. 8. and 9.)  There are several within-graph proximity measures  Hyperlink-Induced Topic Search (HITS)  The Neumann Kernel (NK)  Shared Nearest Neighbor (SNN)
  • 25. Fig. 8. - Defining proximity measures enables structure visible Scatter plots showing the similarity from -1 to 1
  • 26. Fig. 9. - Citation graph by using NK-proximity measures - n1…n8 vertices (articles) - edges indicate a citation Citation Matrix C can be formed - If an edge between two vertices exists then the matrix cell = 1 else = 0
  • 27. Fig. 10. - How to generalize mathematically the pattern of a dalmatian dog?
  • 28. Data Visualization  The human brain processes visual information better than it processes text - so by using charts, graphs and design elements - data visualization can help us to explain (understand) trends and stats much more easily (Fig. 10.) Fig. 10. - The structure of population by age - commoly used data visualisation procedure in public health domain
  • 29. Data visualization  The samples of data being mined are so vast that scatter plots and histograms will often fall short representing any information of realistic value (Fig. 11.)  For that very reason, the analysts concerned with data mining are constantly looking for better ways to graphically represent data  No matter what tools analysts will have at their fingertips - the patterns and models being mined will only be as good in quality as the data that it is being derived from
  • 30. Fig. 11. - Making graph more simple and easier for understanding
  • 31. Application domains of Data Visualization and Visual Analytics techniques  Visualization of large, complex, multivariate, biological networks  Visual text analytics and classify relevant related work on biological entities in publi cation databases (e.g. PubMed)  Visualization for exploring heterogeneous data and data from multiple data sources  Visual analytics as support for understanding uncertainty and data quality issues
  • 32. Fig. 12. - Complex data visual analytics computer-based tool (the personal archive)
  • 33. Fig. 13. - First visualization of the human Protein-Protein-Interaction structure
  • 34. Topological DM  Applying topological techniques to DM and KDD is a hot and promising future research area.  Topology has its roots in theoretical mathematics, but within the last decade, computational topology rapidly gains interest among computer scientists.  It is a study of abstract shapes and spaces and mappings between them. It originated from the study of geometry and set theory.  Topological methods can be applied to data represented by point clouds, that is, finite subsets of the n-dimensional Euclidean space.  The input is presented with a sample of some unknown space which one wishes to reconstruct and understand.  Distinguishing between the ambient (embedding) dimension n, and the intrinsic dimension of the data is of primary interest towards understanding the intrinsic structure of data.
  • 35. Topological DM  Geometrical and topological methods are tools allowing us to analyse highly complex data  Modern data science uses topological methods to find the structural features of data sets before further supervised or unsupervised analysis  Mathematical formalism, which has been developed for incorporating geometric and topological techniques, deals with point cloud data sets, i.e. finite sets of points  The point clouds are finite samples taken from a geometric object  Tools from the various branches of geometry and topology are then used to study the point cloud data sets  Topology provides a formal language for qualitative mathematics, whereas geometry is mainly quantitative.  Topology studies the relationships of proximity or nearness, since geometry can be regarded as the study of distance functions  These methods create a summary or compressed representation of all of the data features to help to rapidly uncover particular patterns and relationships in data.  The idea of constructing summaries of entire domains of attributes involves understanding the relationship between topological and geometric objects constructed from data using various features
  • 36. Topological DM  Fig. 14.  Forming the computational structure (down below) from the shape which one wishes to reconstruct and understand (up above)