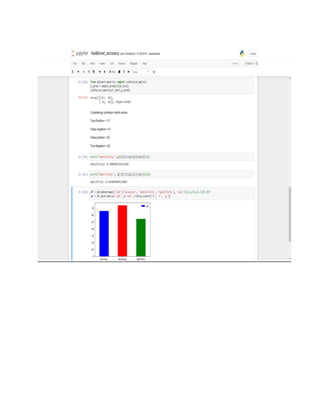
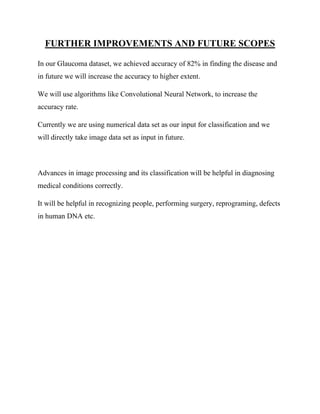
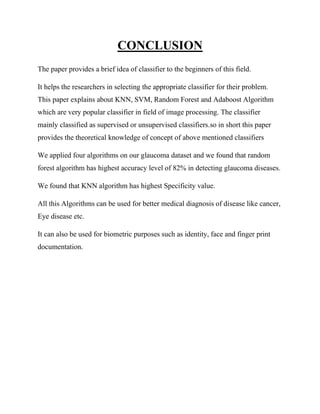
This document is a progress report on image classification methods applied to retinal image datasets with a focus on glaucoma detection, utilizing algorithms like K-Nearest Neighbors, Random Forest, Adaptive Boosting, and Support Vector Machine. The study achieved an accuracy of 82% using Random Forest and suggests future research directions, including the use of convolutional neural networks and direct image dataset input for improved classification accuracy. It serves as a theoretical guide for researchers in selecting appropriate classifiers for similar tasks in image processing.
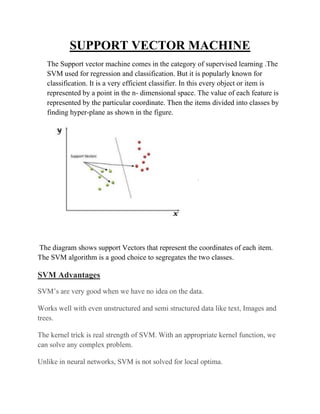
![SOFTWARE AND HARDWARE REQUIREMENTS
• SOFTWARE
1. Jupyter Notebook (Anaconda):Anaconda is a free and open-
source[5] distribution of the Python and R programming languages
for scientific computing (data science, machine
learning applications, large-scale data processing, predictive
analytics, etc.), that aims to simplify package management and
deployment. Package versions are managed by the package
management system conda.[6] The Anaconda distribution includes
data-science packages suitable for Windows, Linux, and MacOS.
And Different Package install for implementation
a) NumPy Library
b) Pandas Library
c) Matplotlib
2. Browser
• HARDWARE
1. Windows 7/8/10
2. RAM 2GB
3. Minimum Storage 20GB](https://image.slidesharecdn.com/reports-200103123902/85/IMAGE-CLASSIFICATION-USING-DIFFERENT-CLASSICAL-APPROACHES-7-320.jpg)


![[ppt]](https://cdn.slidesharecdn.com/ss_thumbnails/ppt2931-thumbnail.jpg?width=640&height=640&fit=bounds)
![[ppt]](https://cdn.slidesharecdn.com/ss_thumbnails/ppt3441-thumbnail.jpg?width=640&height=640&fit=bounds)