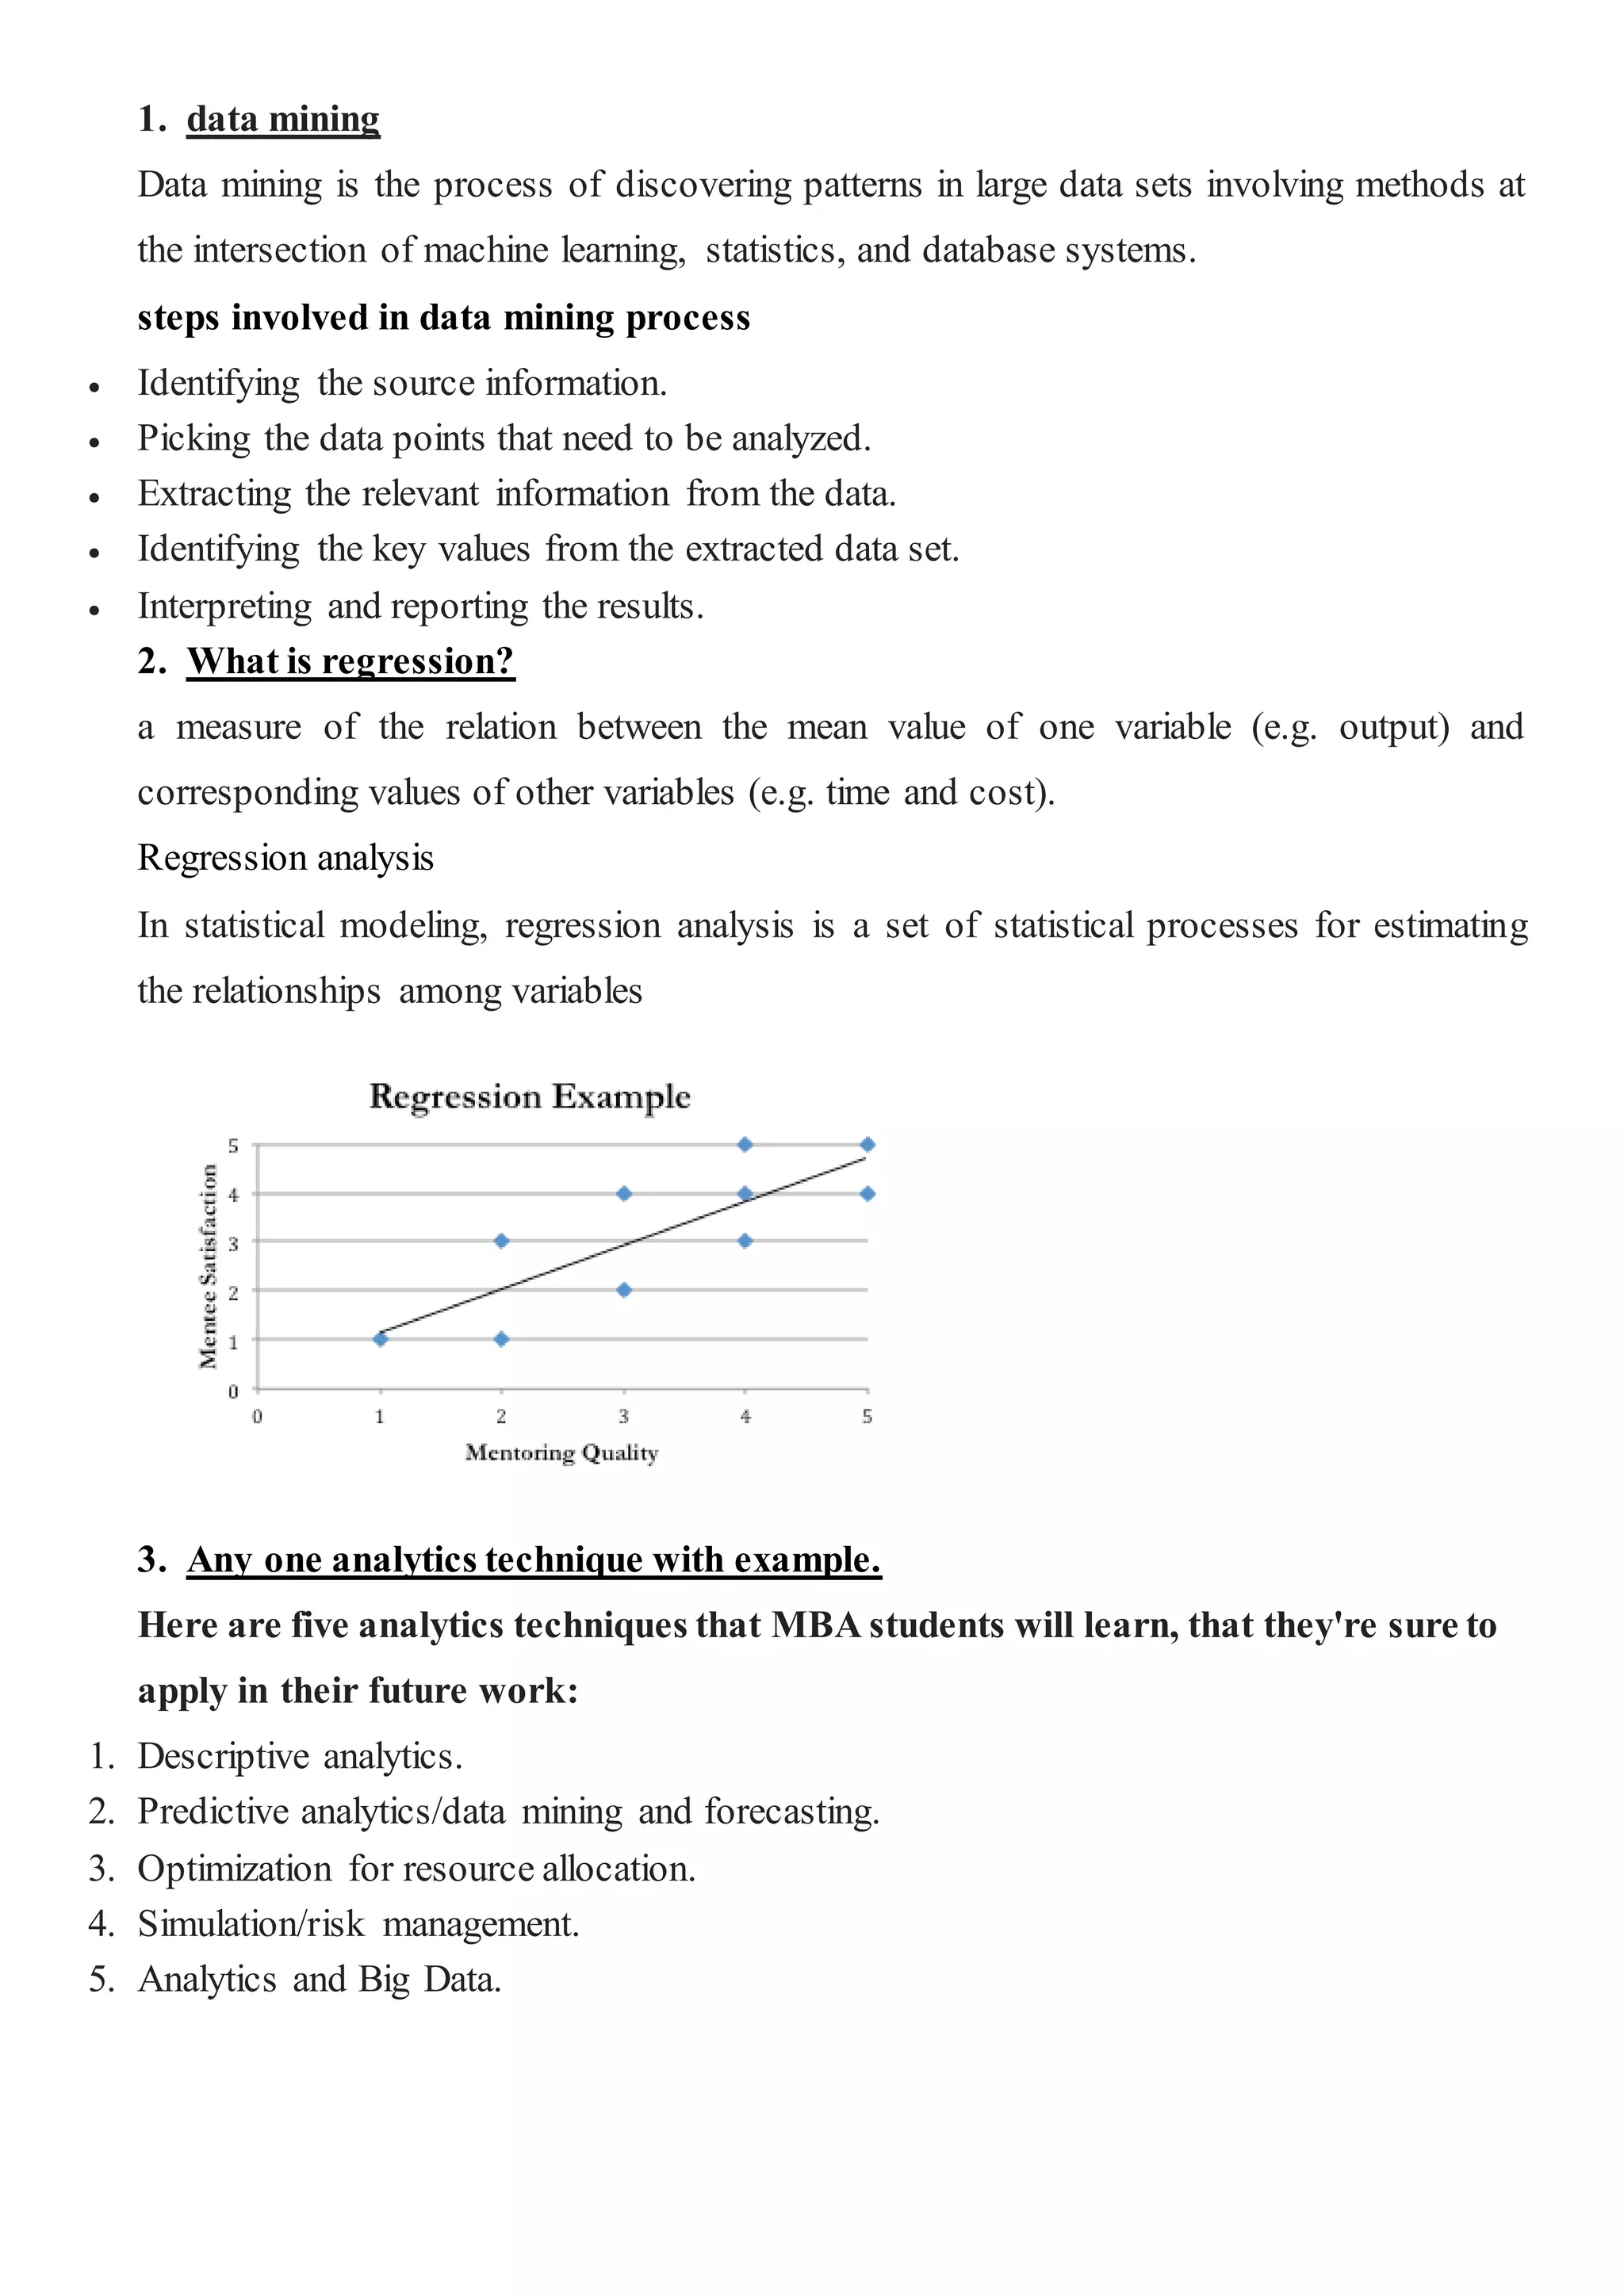
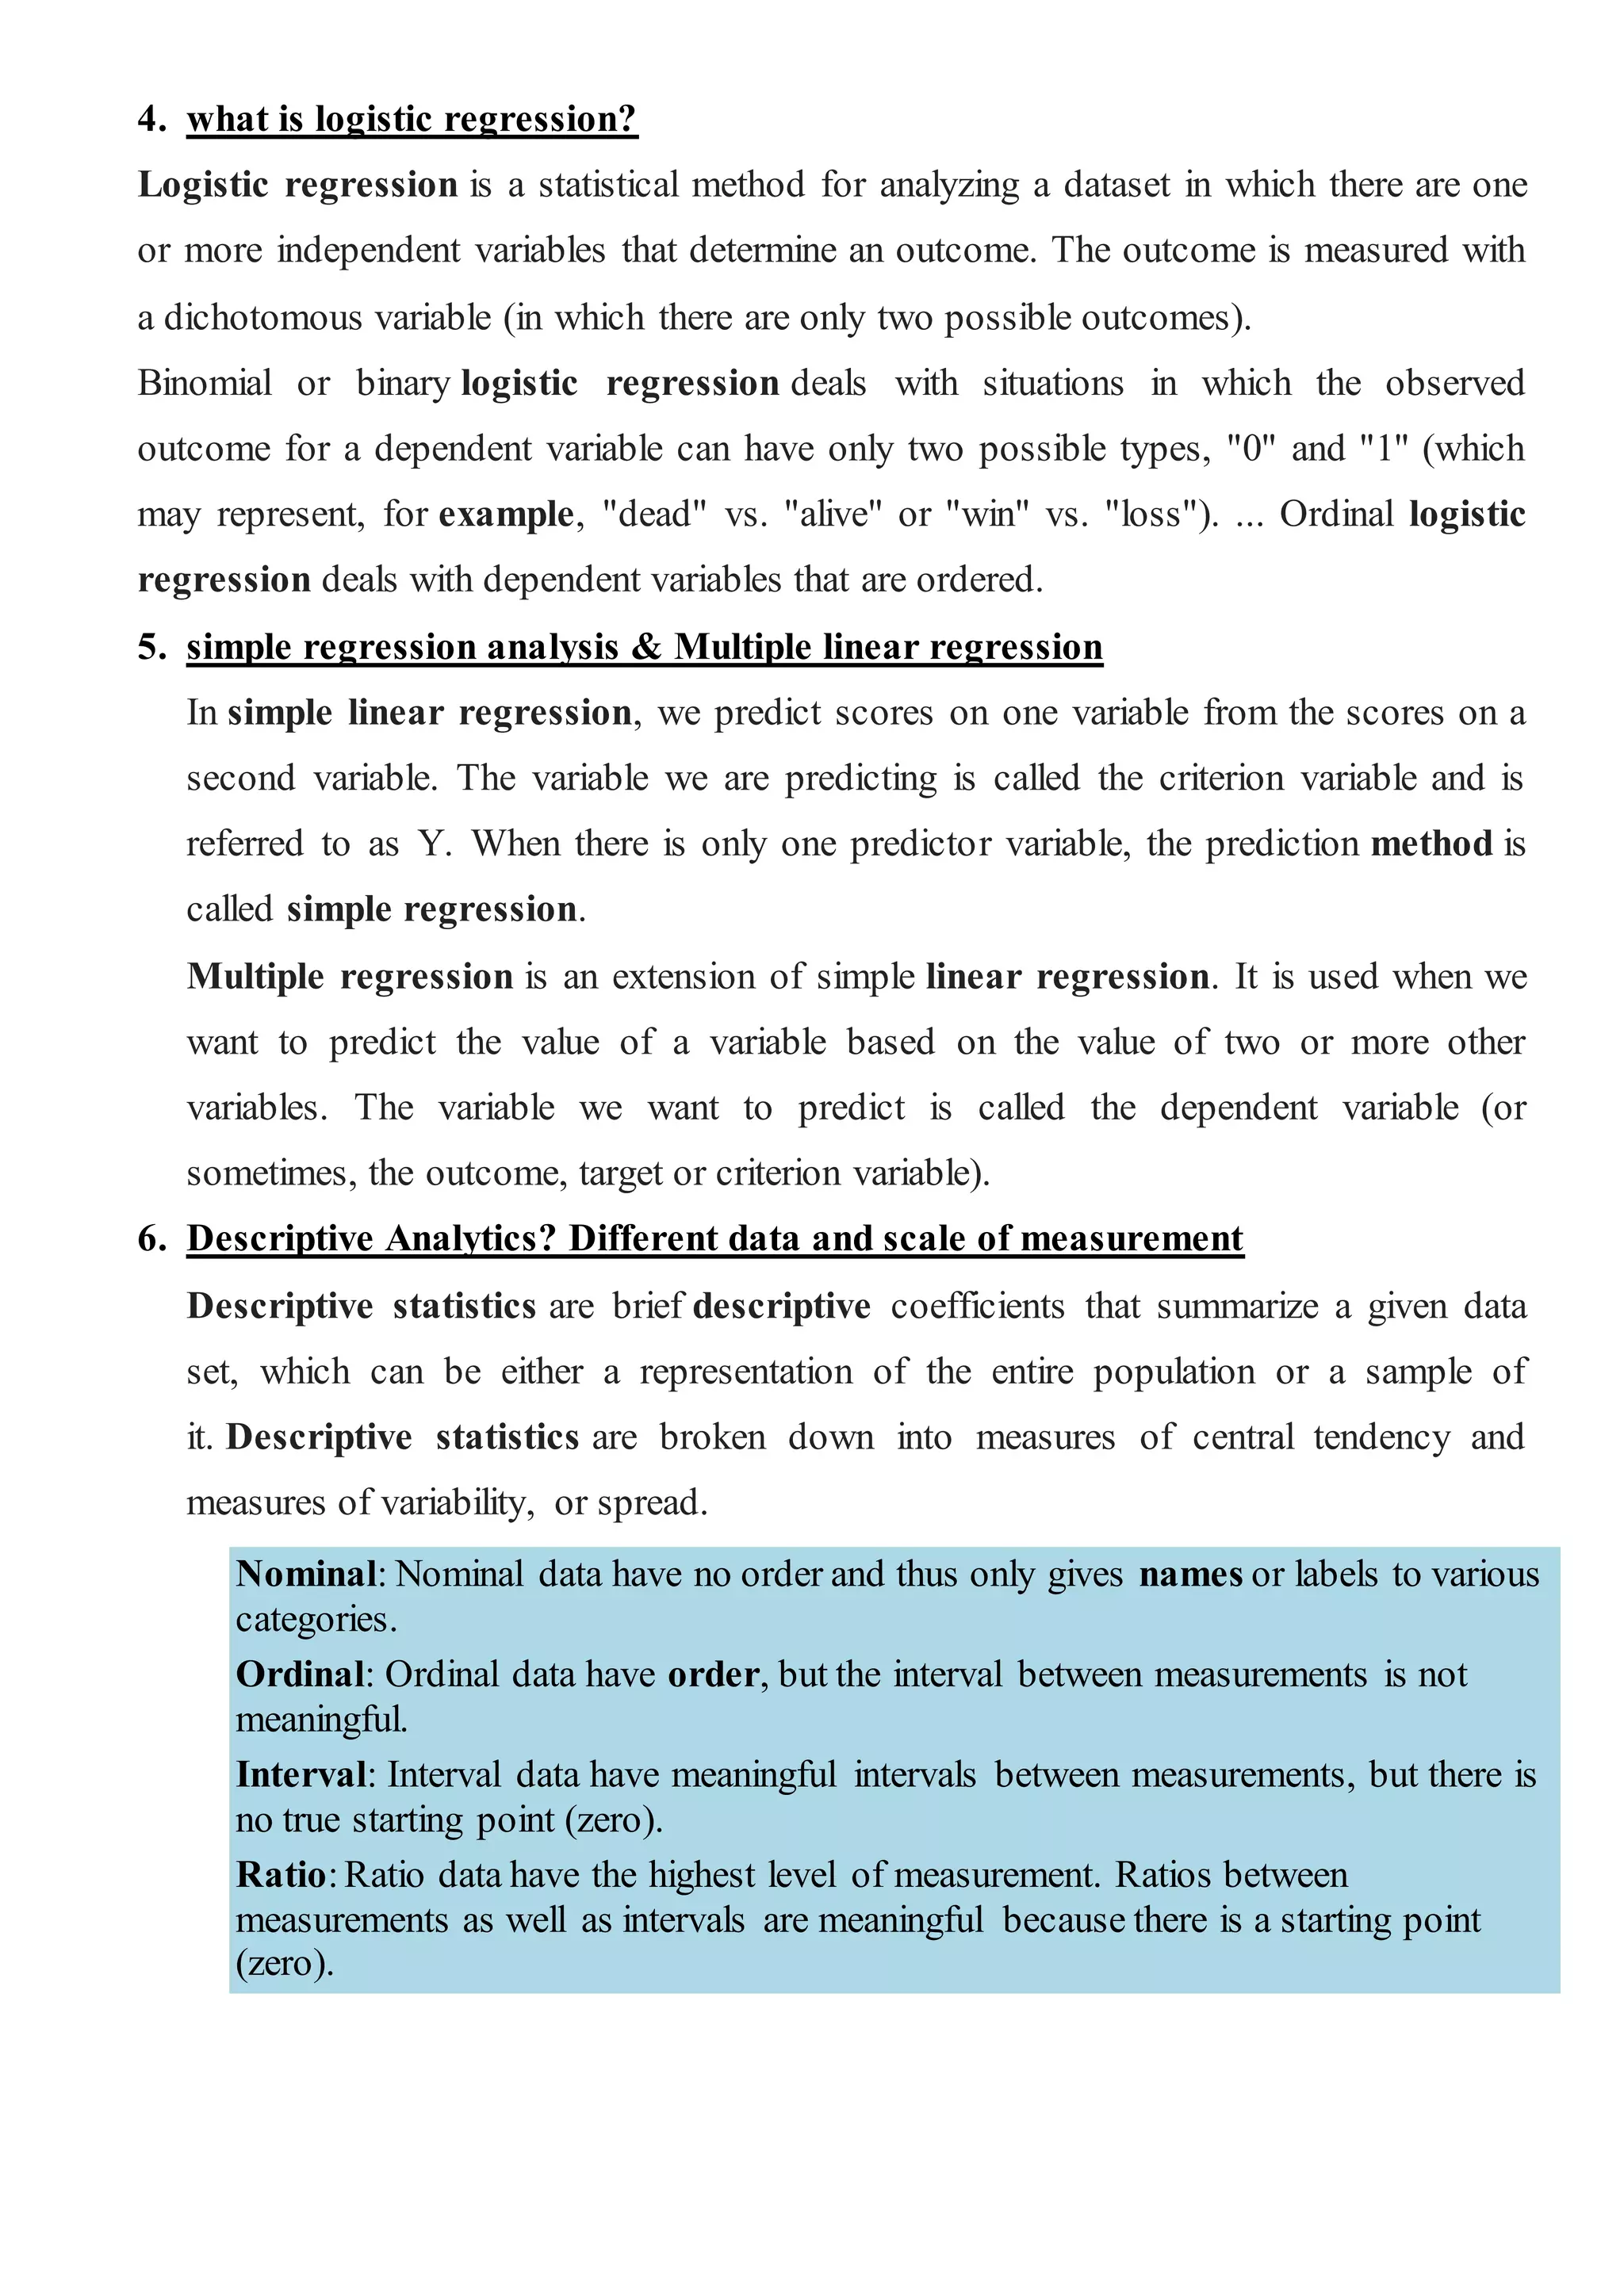
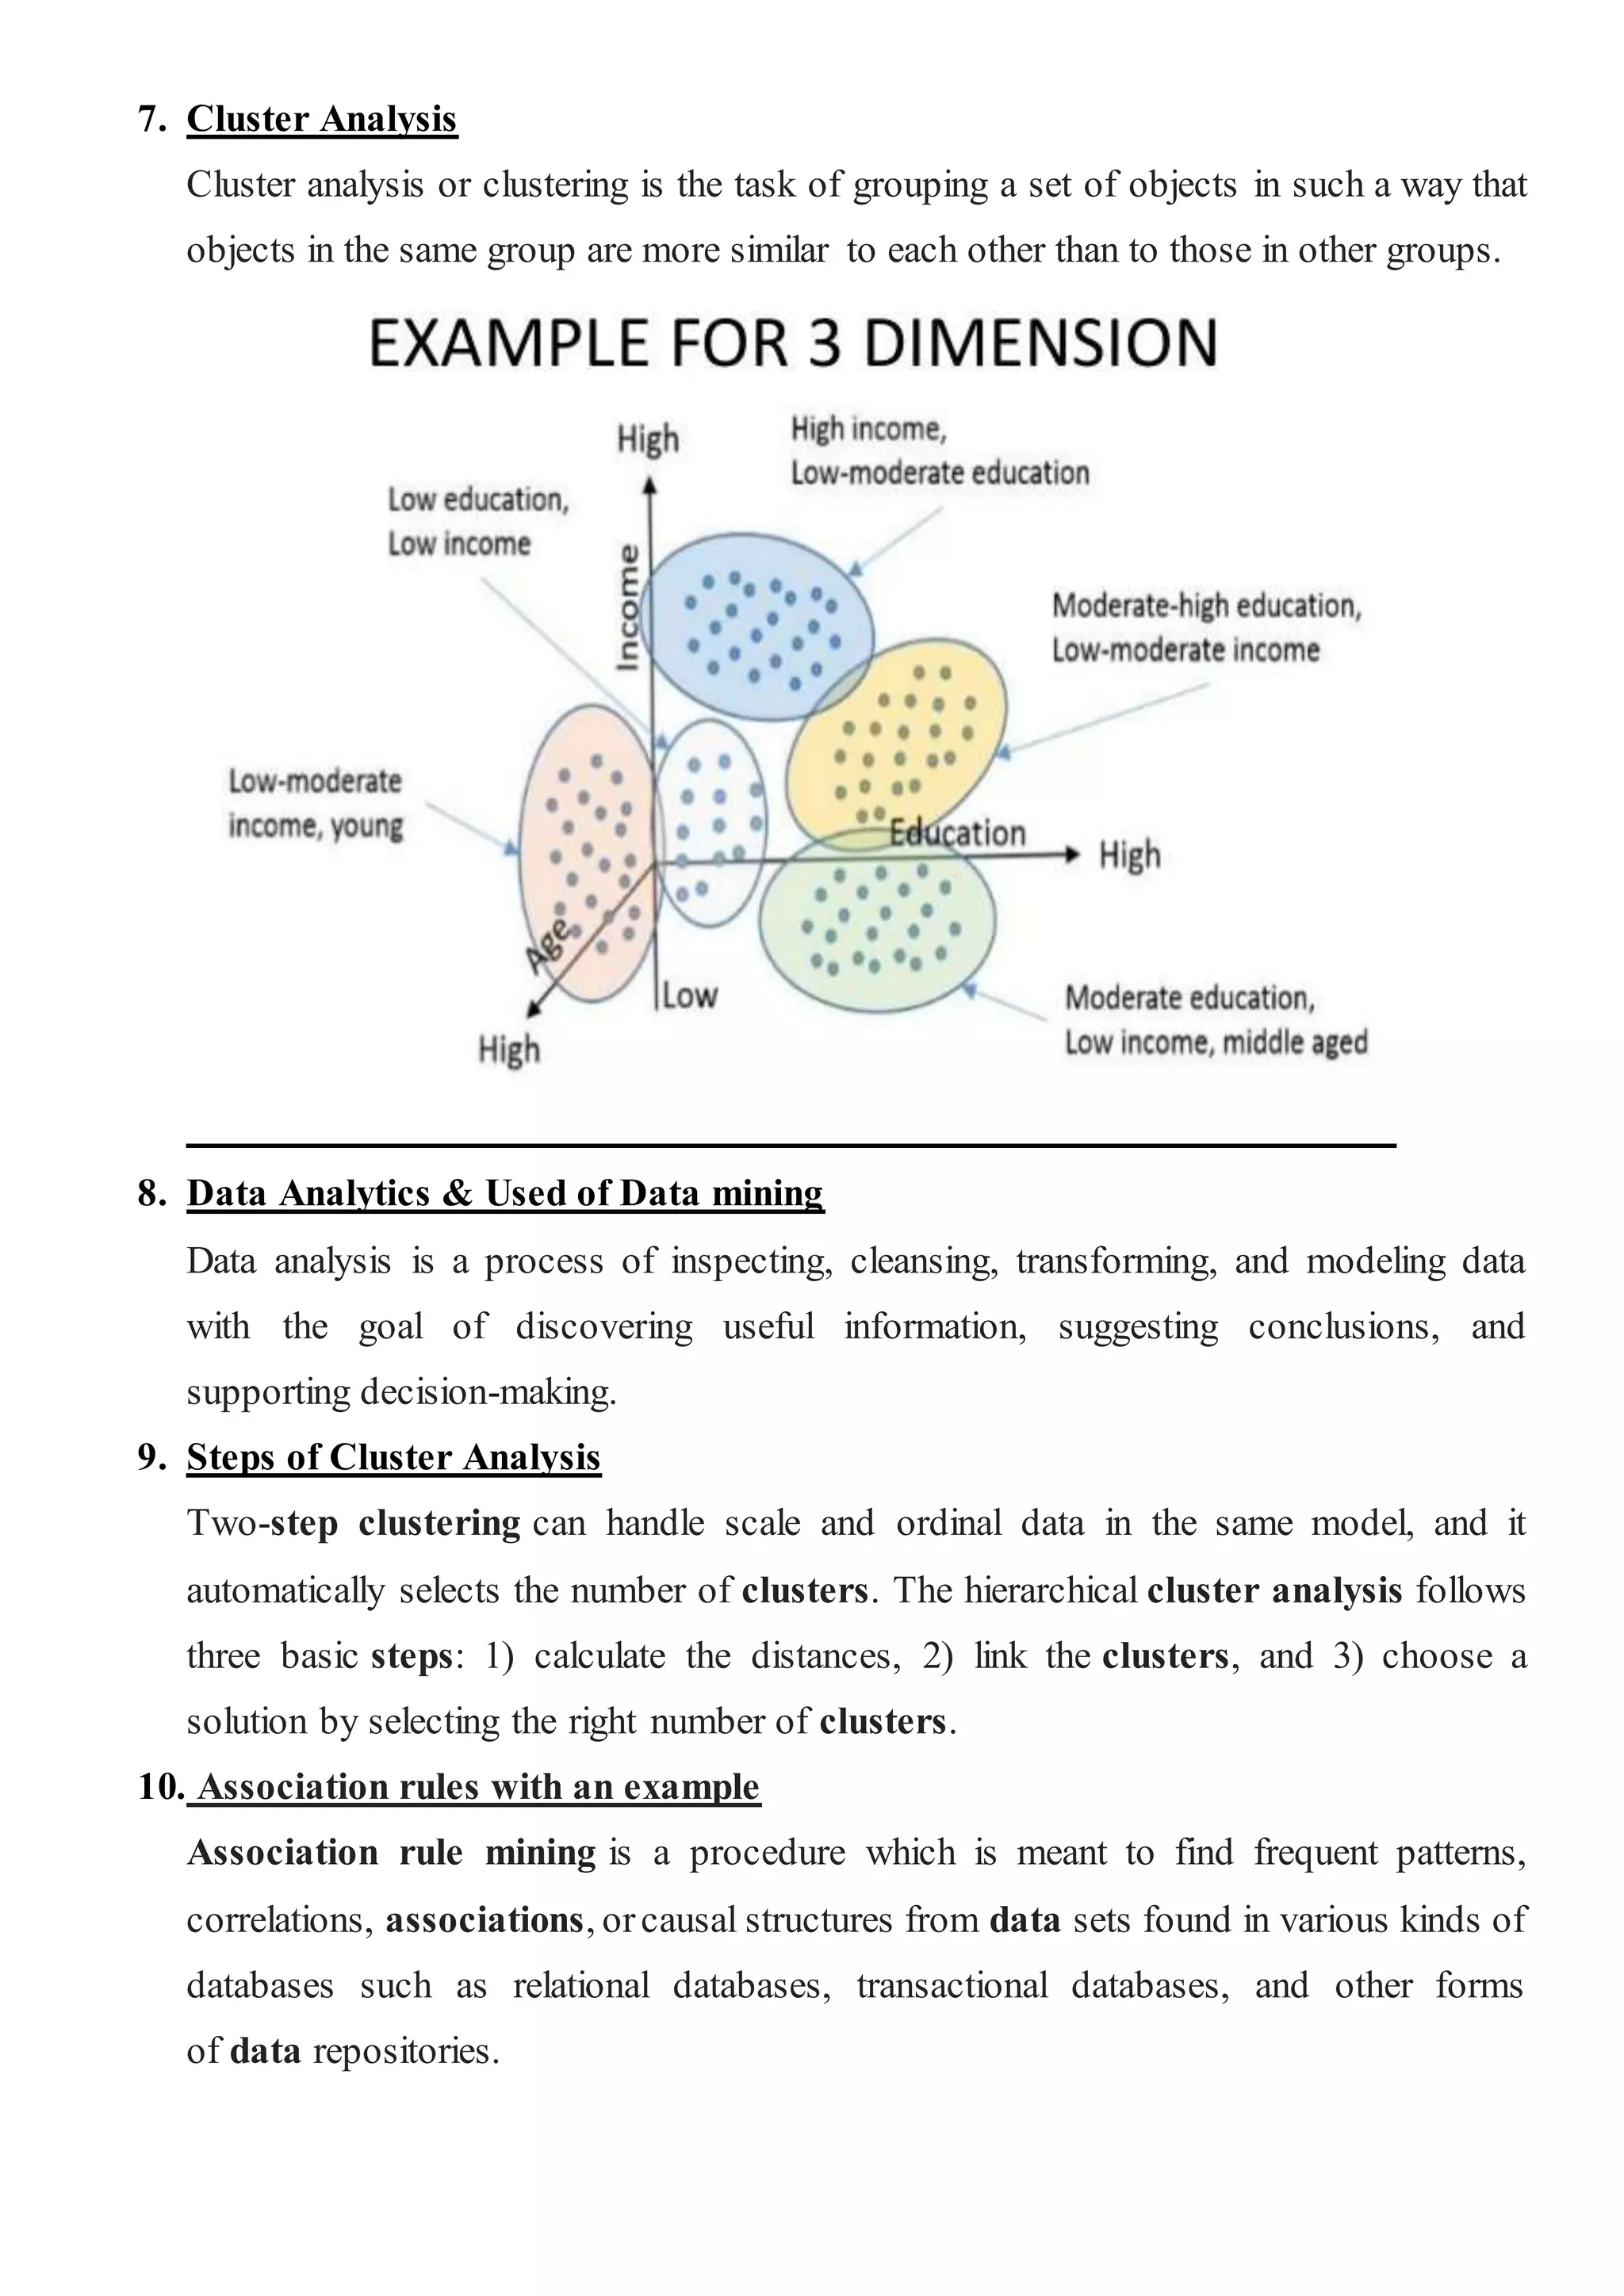
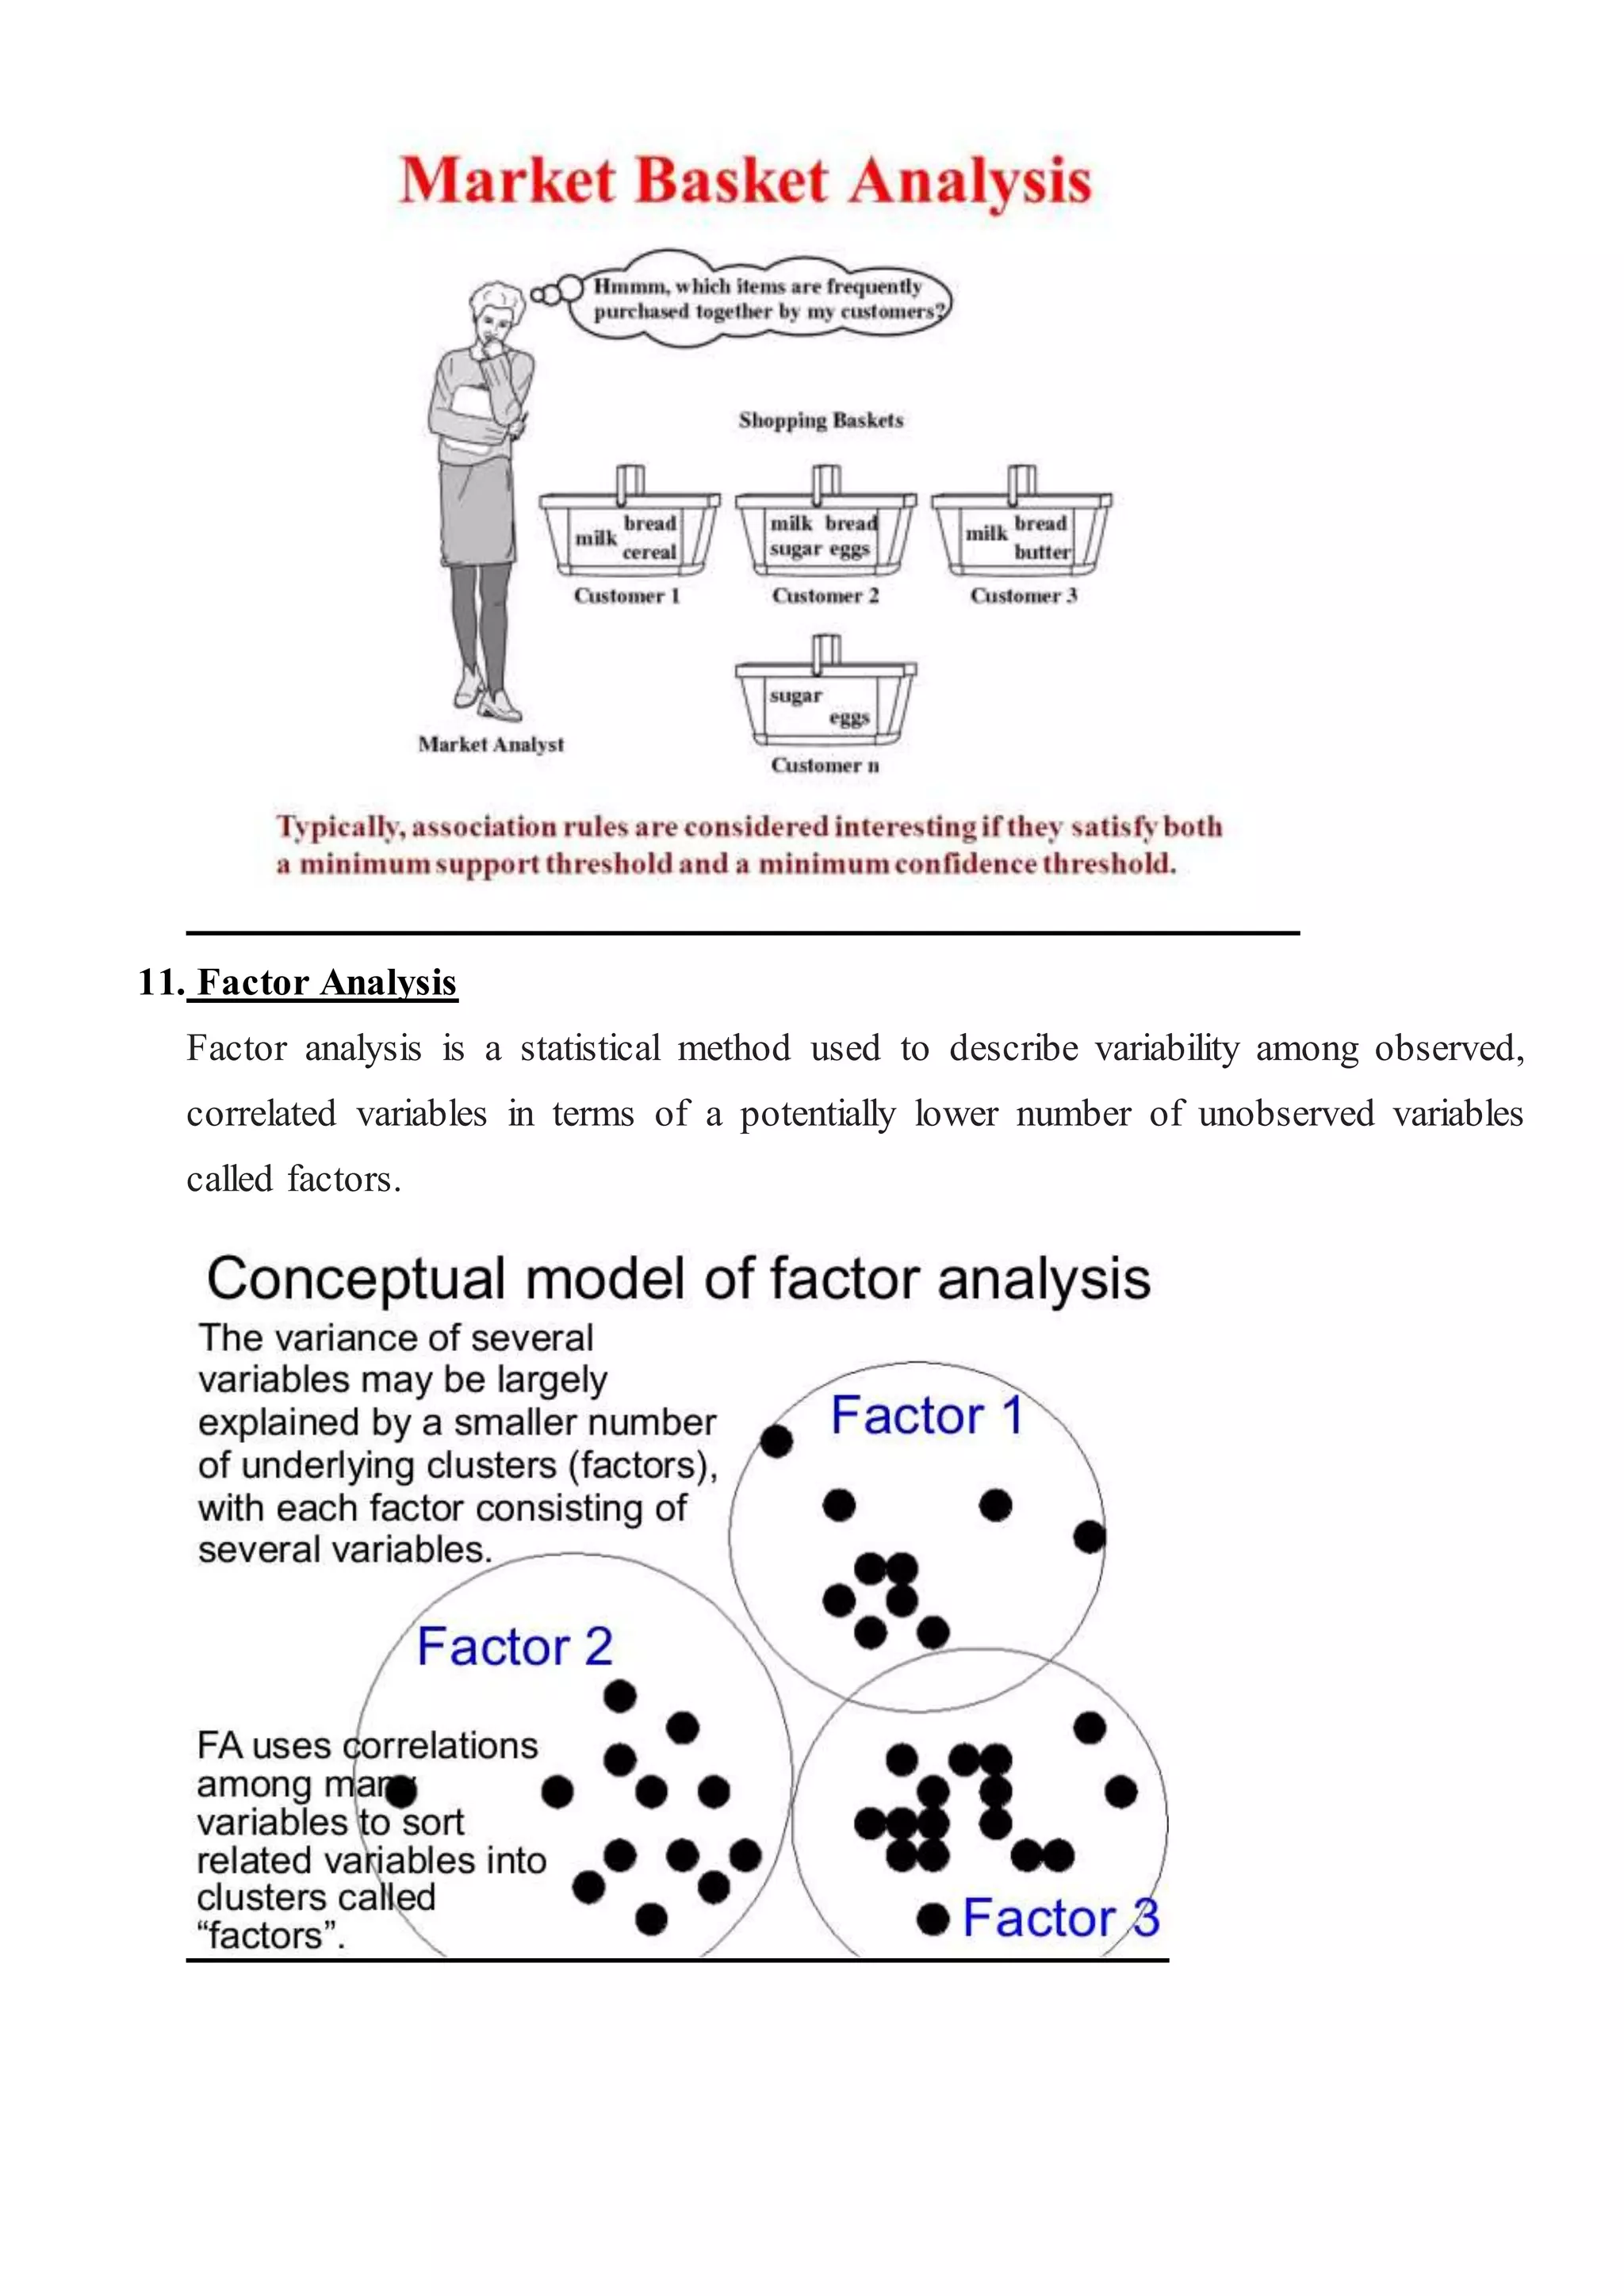
1. data mining
Data mining is the process of discovering patterns in large data sets involving methods at
the intersection of machine learning, statistics, and database systems.
steps involved in data mining process
 Identifying the source information.
 Picking the data points that need to be analyzed.
 Extracting the relevant information from the data.
 Identifying the key values from the extracted data set.
 Interpreting and reporting the results.
2. What is regression?
a measure of the relation between the mean value of one variable (e.g. output) and
corresponding values of other variables (e.g. time and cost).
Regression analysis
In statistical modeling, regression analysis is a set of statistical processes for estimating
the relationships among variables
3. Any one analytics technique with example.
Here are five analytics techniques that MBA students will learn, that they're sure to
apply in their future work:
1. Descriptive analytics.
2. Predictive analytics/data mining and forecasting.
3. Optimization for resource allocation.
4. Simulation/risk management.
5. Analytics and Big Data.
4. what is logistic regression?
Logistic regression is a statistical method for analyzing a dataset in which there are one
or more independent variables that determine an outcome. The outcome is measured with
a dichotomous variable (in which there are only two possible outcomes).
Binomial or binary logistic regression deals with situations in which the observed
outcome for a dependent variable can have only two possible types, "0" and "1" (which
may represent, for example, "dead" vs. "alive" or "win" vs. "loss"). ... Ordinal logistic
regression deals with dependent variables that are ordered.
5. simple regression analysis & Multiple linear regression
In simple linear regression, we predict scores on one variable from the scores on a
second variable. The variable we are predicting is called the criterion variable and is
referred to as Y. When there is only one predictor variable, the prediction method is
called simple regression.
Multiple regression is an extension of simple linear regression. It is used when we
want to predict the value of a variable based on the value of two or more other
variables. The variable we want to predict is called the dependent variable (or
sometimes, the outcome, target or criterion variable).
6. Descriptive Analytics? Different data and scale of measurement
Descriptive statistics are brief descriptive coefficients that summarize a given data
set, which can be either a representation of the entire population or a sample of
it. Descriptive statistics are broken down into measures of central tendency and
measures of variability, or spread.
Nominal: Nominal data have no order and thus only gives names or labels to various
categories.
Ordinal: Ordinal data have order, but the interval between measurements is not
meaningful.
Interval: Interval data have meaningful intervals between measurements, but there is
no true starting point (zero).
Ratio:Ratio data have the highest level of measurement. Ratios between
measurements as well as intervals are meaningful because there is a starting point
(zero).
7. Cluster Analysis
Cluster analysis or clustering is the task of grouping a set of objects in such a way that
objects in the same group are more similar to each other than to those in other groups.
8. Data Analytics & Used of Data mining
Data analysis is a process of inspecting, cleansing, transforming, and modeling data
with the goal of discovering useful information, suggesting conclusions, and
supporting decision-making.
9. Steps of Cluster Analysis
Two-step clustering can handle scale and ordinal data in the same model, and it
automatically selects the number of clusters. The hierarchical cluster analysis follows
three basic steps: 1) calculate the distances, 2) link the clusters, and 3) choose a
solution by selecting the right number of clusters.
10. Association rules with an example
Association rule mining is a procedure which is meant to find frequent patterns,
correlations, associations, orcausal structures from data sets found in various kinds of
databases such as relational databases, transactional databases, and other forms
of data repositories.
11. Factor Analysis
Factor analysis is a statistical method used to describe variability among observed,
correlated variables in terms of a potentially lower number of unobserved variables
called factors.
12. Explain Modeling process
Business process modeling (BPM) in business process management and systems
engineering is the activity of representing processes of an enterprise, so that the
current process may be analysed, improved, and automated. ... Alternatively,
the process model can be derived directly from events' logs using process mining
tools.
13. Types of Variables
14. Market Basket Analysis
Market Basket Analysis is a modelling technique based upon the theory that if you
buy a certain group of items, you are more (or less) likely to buy another group of
items. For example, if you are in an English pub and you buy a pint of beer and don't
buy a bar meal, you are more likely to buy crisps
For investors, the market basket is the principal idea behind index funds, which are
essentially a broad sample of stocks, bonds or other securities in the market; this
provides investors with a benchmark against which to compare their investment
returns.
15. Generating Candidate Rules?
Association Rules find all sets of items (item sets) that have support greater than the
minimum support and then using the large item sets to generate the desired rules that
have confidence greater than the minimum confidence. The lift of a rule is the ratio of
the observed support to that expected if X and Y were independent. A typical and
widely used example of association rules application is market basket analysis.
How to Generate Candidates? How to Generate Candidates?
Step 1: self-joining
„ Step 2: pruning (before counting its support)
16.Selecting Strong Rule & Lift Ratio
Lift (data mining) ... Lift is simply the ratio of these values: target response divided by
average response. For example, suppose a population has an average response rate of
5%, but a certain model (or rule) has identified a segment with a response rate of 20%.
17. Explanatory vs. Predictive Modeling
When building multivariate statistical models, researchers need to be clear as to
whether their goals are explanatory or predictive. Explanatory research aims to
identify risk (or protective) factors that are causally related to an outcome. ...
Unfortunately, researchers often conflate the two, which leads to errors

Exam Short Preparation on Data Analytics

  • 1.
    1. data mining Datamining is the process of discovering patterns in large data sets involving methods at the intersection of machine learning, statistics, and database systems. steps involved in data mining process  Identifying the source information.  Picking the data points that need to be analyzed.  Extracting the relevant information from the data.  Identifying the key values from the extracted data set.  Interpreting and reporting the results. 2. What is regression? a measure of the relation between the mean value of one variable (e.g. output) and corresponding values of other variables (e.g. time and cost). Regression analysis In statistical modeling, regression analysis is a set of statistical processes for estimating the relationships among variables 3. Any one analytics technique with example. Here are five analytics techniques that MBA students will learn, that they're sure to apply in their future work: 1. Descriptive analytics. 2. Predictive analytics/data mining and forecasting. 3. Optimization for resource allocation. 4. Simulation/risk management. 5. Analytics and Big Data.
  • 2.
    4. what islogistic regression? Logistic regression is a statistical method for analyzing a dataset in which there are one or more independent variables that determine an outcome. The outcome is measured with a dichotomous variable (in which there are only two possible outcomes). Binomial or binary logistic regression deals with situations in which the observed outcome for a dependent variable can have only two possible types, "0" and "1" (which may represent, for example, "dead" vs. "alive" or "win" vs. "loss"). ... Ordinal logistic regression deals with dependent variables that are ordered. 5. simple regression analysis & Multiple linear regression In simple linear regression, we predict scores on one variable from the scores on a second variable. The variable we are predicting is called the criterion variable and is referred to as Y. When there is only one predictor variable, the prediction method is called simple regression. Multiple regression is an extension of simple linear regression. It is used when we want to predict the value of a variable based on the value of two or more other variables. The variable we want to predict is called the dependent variable (or sometimes, the outcome, target or criterion variable). 6. Descriptive Analytics? Different data and scale of measurement Descriptive statistics are brief descriptive coefficients that summarize a given data set, which can be either a representation of the entire population or a sample of it. Descriptive statistics are broken down into measures of central tendency and measures of variability, or spread. Nominal: Nominal data have no order and thus only gives names or labels to various categories. Ordinal: Ordinal data have order, but the interval between measurements is not meaningful. Interval: Interval data have meaningful intervals between measurements, but there is no true starting point (zero). Ratio:Ratio data have the highest level of measurement. Ratios between measurements as well as intervals are meaningful because there is a starting point (zero).
  • 3.
    7. Cluster Analysis Clusteranalysis or clustering is the task of grouping a set of objects in such a way that objects in the same group are more similar to each other than to those in other groups. 8. Data Analytics & Used of Data mining Data analysis is a process of inspecting, cleansing, transforming, and modeling data with the goal of discovering useful information, suggesting conclusions, and supporting decision-making. 9. Steps of Cluster Analysis Two-step clustering can handle scale and ordinal data in the same model, and it automatically selects the number of clusters. The hierarchical cluster analysis follows three basic steps: 1) calculate the distances, 2) link the clusters, and 3) choose a solution by selecting the right number of clusters. 10. Association rules with an example Association rule mining is a procedure which is meant to find frequent patterns, correlations, associations, orcausal structures from data sets found in various kinds of databases such as relational databases, transactional databases, and other forms of data repositories.
  • 4.
    11. Factor Analysis Factoranalysis is a statistical method used to describe variability among observed, correlated variables in terms of a potentially lower number of unobserved variables called factors.
  • 5.
    12. Explain Modelingprocess Business process modeling (BPM) in business process management and systems engineering is the activity of representing processes of an enterprise, so that the current process may be analysed, improved, and automated. ... Alternatively, the process model can be derived directly from events' logs using process mining tools. 13. Types of Variables
  • 6.
    14. Market BasketAnalysis Market Basket Analysis is a modelling technique based upon the theory that if you buy a certain group of items, you are more (or less) likely to buy another group of items. For example, if you are in an English pub and you buy a pint of beer and don't buy a bar meal, you are more likely to buy crisps For investors, the market basket is the principal idea behind index funds, which are essentially a broad sample of stocks, bonds or other securities in the market; this provides investors with a benchmark against which to compare their investment returns. 15. Generating Candidate Rules? Association Rules find all sets of items (item sets) that have support greater than the minimum support and then using the large item sets to generate the desired rules that have confidence greater than the minimum confidence. The lift of a rule is the ratio of the observed support to that expected if X and Y were independent. A typical and widely used example of association rules application is market basket analysis. How to Generate Candidates? How to Generate Candidates? Step 1: self-joining „ Step 2: pruning (before counting its support)
  • 7.
    16.Selecting Strong Rule& Lift Ratio Lift (data mining) ... Lift is simply the ratio of these values: target response divided by average response. For example, suppose a population has an average response rate of 5%, but a certain model (or rule) has identified a segment with a response rate of 20%. 17. Explanatory vs. Predictive Modeling When building multivariate statistical models, researchers need to be clear as to whether their goals are explanatory or predictive. Explanatory research aims to identify risk (or protective) factors that are causally related to an outcome. ... Unfortunately, researchers often conflate the two, which leads to errors