Detailed Lesson Planin Mathematics IV
I. Objectives
A. Analyze the data presented in single vertical and horizontal bar graphs
B. Read and Interpret the data presented in single vertical and horizontal bar
graphs
C. Appreciate the importance of bar graph
II. Subject Matter
Topic: Interpreting Data presented in a single vertical and horizontal bar graphs
Concept Idea: Bar graphs can be in a form of vertical bar graph and horizontal
bar graph with labels, scale, and title.
Reference: K to 12 Grade 4 Curriculum, LM Math Grade 4 pages 241 to 244
Materials:
Values Integration: Accuracy, Cooperation
A. Song-Mapeh
B. Bar Graph examples
Sports-P.E
Colors- Art
Food-Nutrition
III. Procedure
Teacher’s Activity Pupil’s Activity
A. Preparatory Activities
1. Daily Routine
a. Prayer
b. Greetings
c. Checking of attendance
d. Song
-Before we start, let’s sing first. Do you
know the Mathematics song?
-Well, let’s sing together
Mathematic Song
Mathematics, Mathematics
Lots of fun, lots of fun
It is so exciting,
It is interesting,
I love Math!
I love Math!
(Repeat twice)
2. Drill
-Are you ready to learn something new
today?
-Let’s have a game, this game is called
“Skip Counting Game” I will group you into
three groups. As you can see in the board,
there are 9 caterpillars, 3 caterpillars for
each group and on its body are numbers, to
complete those numbers all you need to do
is to skip count to fill in the missing numbers
-Yes Ma’am
Mathematic Song
Mathematics, Mathematics
Lots of fun, lots of fun
It is so exciting,
It is interesting,
I love Math!
I love Math!
(Repeat twice)
-Yes Ma’am
2.
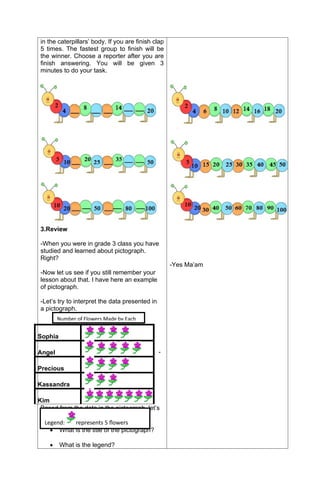
in the caterpillars’body. If you are finish clap
5 times. The fastest group to finish will be
the winner. Choose a reporter after you are
finish answering. You will be given 3
minutes to do your task.
3.Review
-When you were in grade 3 class you have
studied and learned about pictograph.
Right?
-Now let us see if you still remember your
lesson about that. I have here an example
of pictograph.
-Let’s try to interpret the data presented in
a pictograph.
-
Based from the data in the pictograph, let’s
answer the following questions.
What is the title of the pictograph?
What is the legend?
-Yes Ma’am
Number of Flowers Made by Each
Sophia
Angel
Precious
Kassandra
Kim
Legend: represents 5 flowers
3.
Who madethe least number of
flowers?
Who made the highest number of
flowers?
How many flowers were made by
Sophia and Precious?
How many flowers are there all in all?
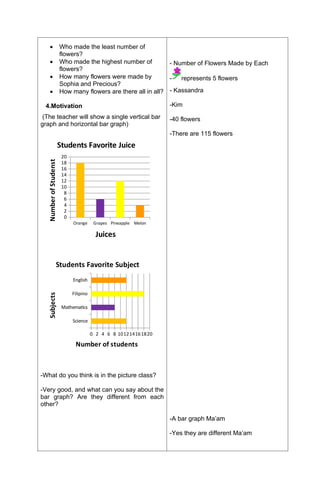
4.Motivation
(The teacher will show a single vertical bar
graph and horizontal bar graph)
Orange Grapes Pineapple Melon
0
2
4
6
8
10
12
14
16
18
20
Students Favorite Juice
Juices
Number
of
Studenst
Science
Mathematics
Filipino
English
0 2 4 6 8 101214161820
Students Favorite Subject
Number of students
Subjects
-What do you think is in the picture class?
-Very good, and what can you say about the
bar graph? Are they different from each
other?
- Number of Flowers Made by Each
- represents 5 flowers
- Kassandra
-Kim
-40 flowers
-There are 115 flowers
-A bar graph Ma’am
-Yes they are different Ma’am
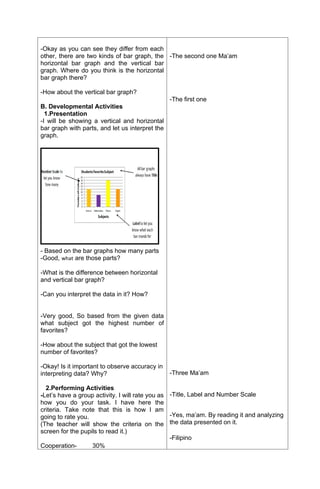
4.
-Okay as youcan see they differ from each
other, there are two kinds of bar graph, the
horizontal bar graph and the vertical bar
graph. Where do you think is the horizontal
bar graph there?
-How about the vertical bar graph?
B. Developmental Activities
1.Presentation
-I will be showing a vertical and horizontal
bar graph with parts, and let us interpret the
graph.
- Based on the bar graphs how many parts
-Good, what are those parts?
-What is the difference between horizontal
and vertical bar graph?
-Can you interpret the data in it? How?
-Very good, So based from the given data
what subject got the highest number of
favorites?
-How about the subject that got the lowest
number of favorites?
-Okay! Is it important to observe accuracy in
interpreting data? Why?
2.Performing Activities
-Let’s have a group activity. I will rate you as
how you do your task. I have here the
criteria. Take note that this is how I am
going to rate you.
(The teacher will show the criteria on the
screen for the pupils to read it.)
Cooperation- 30%
-The second one Ma’am
-The first one
-Three Ma’am
-Title, Label and Number Scale
-Yes, ma’am. By reading it and analyzing
the data presented on it.
-Filipino
5.
Discipline- 25%
Correctness of
theanswer- 30%
Reporting- 15%
100%
-This is what you will do, Interpret the given
graph to your group and answer the
following questions. You are given only 5
minutes to answer and if you are finish clap
5 times. The first group to finish will be the
winner.
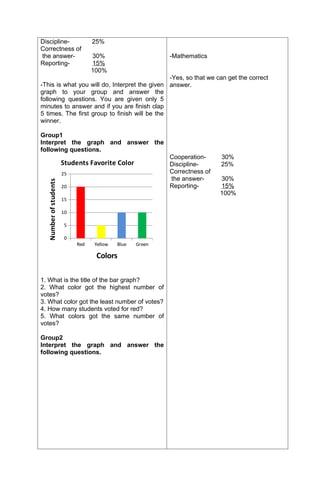
Group1
Interpret the graph and answer the
following questions.
Red Yellow Blue Green
0
5
10
15
20
25
Students Favorite Color
Colors
Number
of
students
1. What is the title of the bar graph?
2. What color got the highest number of
votes?
3. What color got the least number of votes?
4. How many students voted for red?
5. What colors got the same number of
votes?
Group2
Interpret the graph and answer the
following questions.
-Mathematics
-Yes, so that we can get the correct
answer.
Cooperation- 30%
Discipline- 25%
Correctness of
the answer- 30%
Reporting- 15%
100%
6.
Red Yellow BlueGreen
0
5
10
15
20
25
Students Favorite Color
Colors
Number
of
students
1. What is the title of the bar graph?
2. What color got the highest number of
votes?
3. What color got the least number of votes?
4. How many students voted for red?
5. What colors got the same number of
votes?
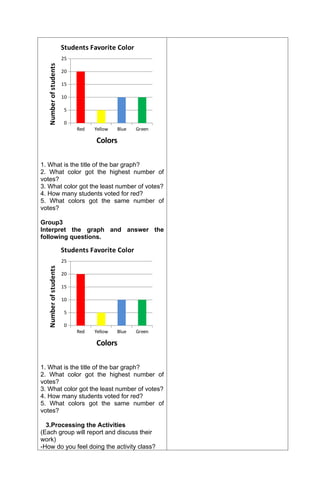
Group3
Interpret the graph and answer the
following questions.
Red Yellow Blue Green
0
5
10
15
20
25
Students Favorite Color
Colors
Number
of
students
1. What is the title of the bar graph?
2. What color got the highest number of
votes?
3. What color got the least number of votes?
4. How many students voted for red?
5. What colors got the same number of
votes?
3.Processing the Activities
(Each group will report and discuss their
work)
-How do you feel doing the activity class?
7.
-Okay do allof the groups have the same
interpretation and answers?
4.Reinforcing the Concept and Skill
-Now I will group you into three groups, we
will have a game I called this game
“MATHinik Challenge” what you will do is to
answer the following questions that I am
going to flash in the white screen in as fast
as you can by pressing the buzzer. One of
the members of your group will be the first
to play to be followed by the next member
until all of you are done. The first groups to
press the buzzer is the one to answer if
he/she got to answer correctly then your
group have 1 point. You need to get 10
points for your group to win. Do you
understand class?
(The presentation will then flash in the white
screen after the question the correct answer
will follow. The game will be guided by the
teacher)
5.Summarizing the Lesson
-Now, based from the given examples what
is a bar graph?
-What are the two kinds of bar graph?
-What are the parts of the bar graph?
-What is the use of a bar graph?
-For you what is the importance of a bar
graph?
6.Applying to New and Other Situation
-Let us have another game again. Using the
information from the bar graph, you are
going to pick one question inside the box.
The student who can give me the correct
answer may have the chance to call his/her
classmate to answer another question and
so to repeat the process until all questions
are given and answered correctly. Do you
get it?
-Great Ma’am
-Yes Ma’am
-Yes Ma’am
-Bar graph is used to compare data from
different groups or period.
-Horizontal and Vertical bar graph
-Title, label and scale
-It gives us information presented in a
graph.
-It helps us see the data in clear manner.
We can read it by means of answering
the questions as to interpret it.
8.
DancingWriting Poem SingingDrawing
0
2
4
6
8
10
12
14
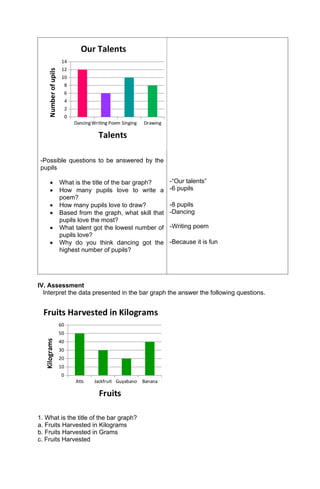
Our Talents
Talents
Number
of
upils
-Possible questions to be answered by the
pupils
What is the title of the bar graph?
How many pupils love to write a
poem?
How many pupils love to draw?
Based from the graph, what skill that
pupils love the most?
What talent got the lowest number of
pupils love?
Why do you think dancing got the
highest number of pupils?
-“Our talents”
-6 pupils
-8 pupils
-Dancing
-Writing poem
-Because it is fun
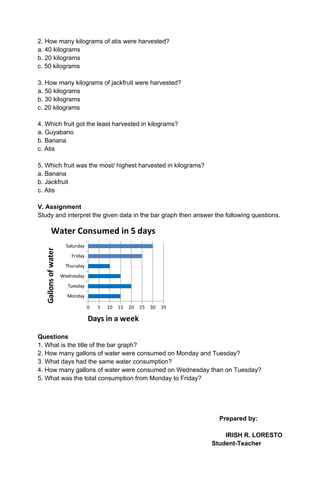
IV. Assessment
Interpret the data presented in the bar graph the answer the following questions.
Atis Jackfruit Guyabano Banana
0
10
20
30
40
50
60
Fruits Harvested in Kilograms
Fruits
Kilograms
1. What is the title of the bar graph?
a. Fruits Harvested in Kilograms
b. Fruits Harvested in Grams
c. Fruits Harvested
9.
2. How manykilograms of atis were harvested?
a. 40 kilograms
b. 20 kilograms
c. 50 kilograms
3. How many kilograms of jackfruit were harvested?
a. 50 kilograms
b. 30 kilograms
c. 20 kilograms
4. Which fruit got the least harvested in kilograms?
a. Guyabano
b. Banana
c. Atis
5. Which fruit was the most/ highest harvested in kilograms?
a. Banana
b. Jackfruit
c. Atis
V. Assignment
Study and interpret the given data in the bar graph then answer the following questions.
Monday
Tuesday
Wednesday
Thursday
Friday
Saturday
0 5 10 15 20 25 30 35
Water Consumed in 5 days
Days in a week
Gallons
of
water
Questions
1. What is the title of the bar graph?
2. How many gallons of water were consumed on Monday and Tuesday?
3. What days had the same water consumption?
4. How many gallons of water were consumed on Wednesday than on Tuesday?
Prepared by:
IRISH R. LORESTO
Student-Teacher
5. What was the total consumption from Monday to Friday?