Constructing Single Vertical and Horizontal Bar Graphs.pptx
1.
Math Q4
Lesson 75
ConstuctingSingle Vertical and
Horizontal Bar Graphs
MARVIE T.BLANCO
FOUR-KINDNESS
URDANETA I CENTRAL SCHOOL
URDANETA CITY,PANGASINAN
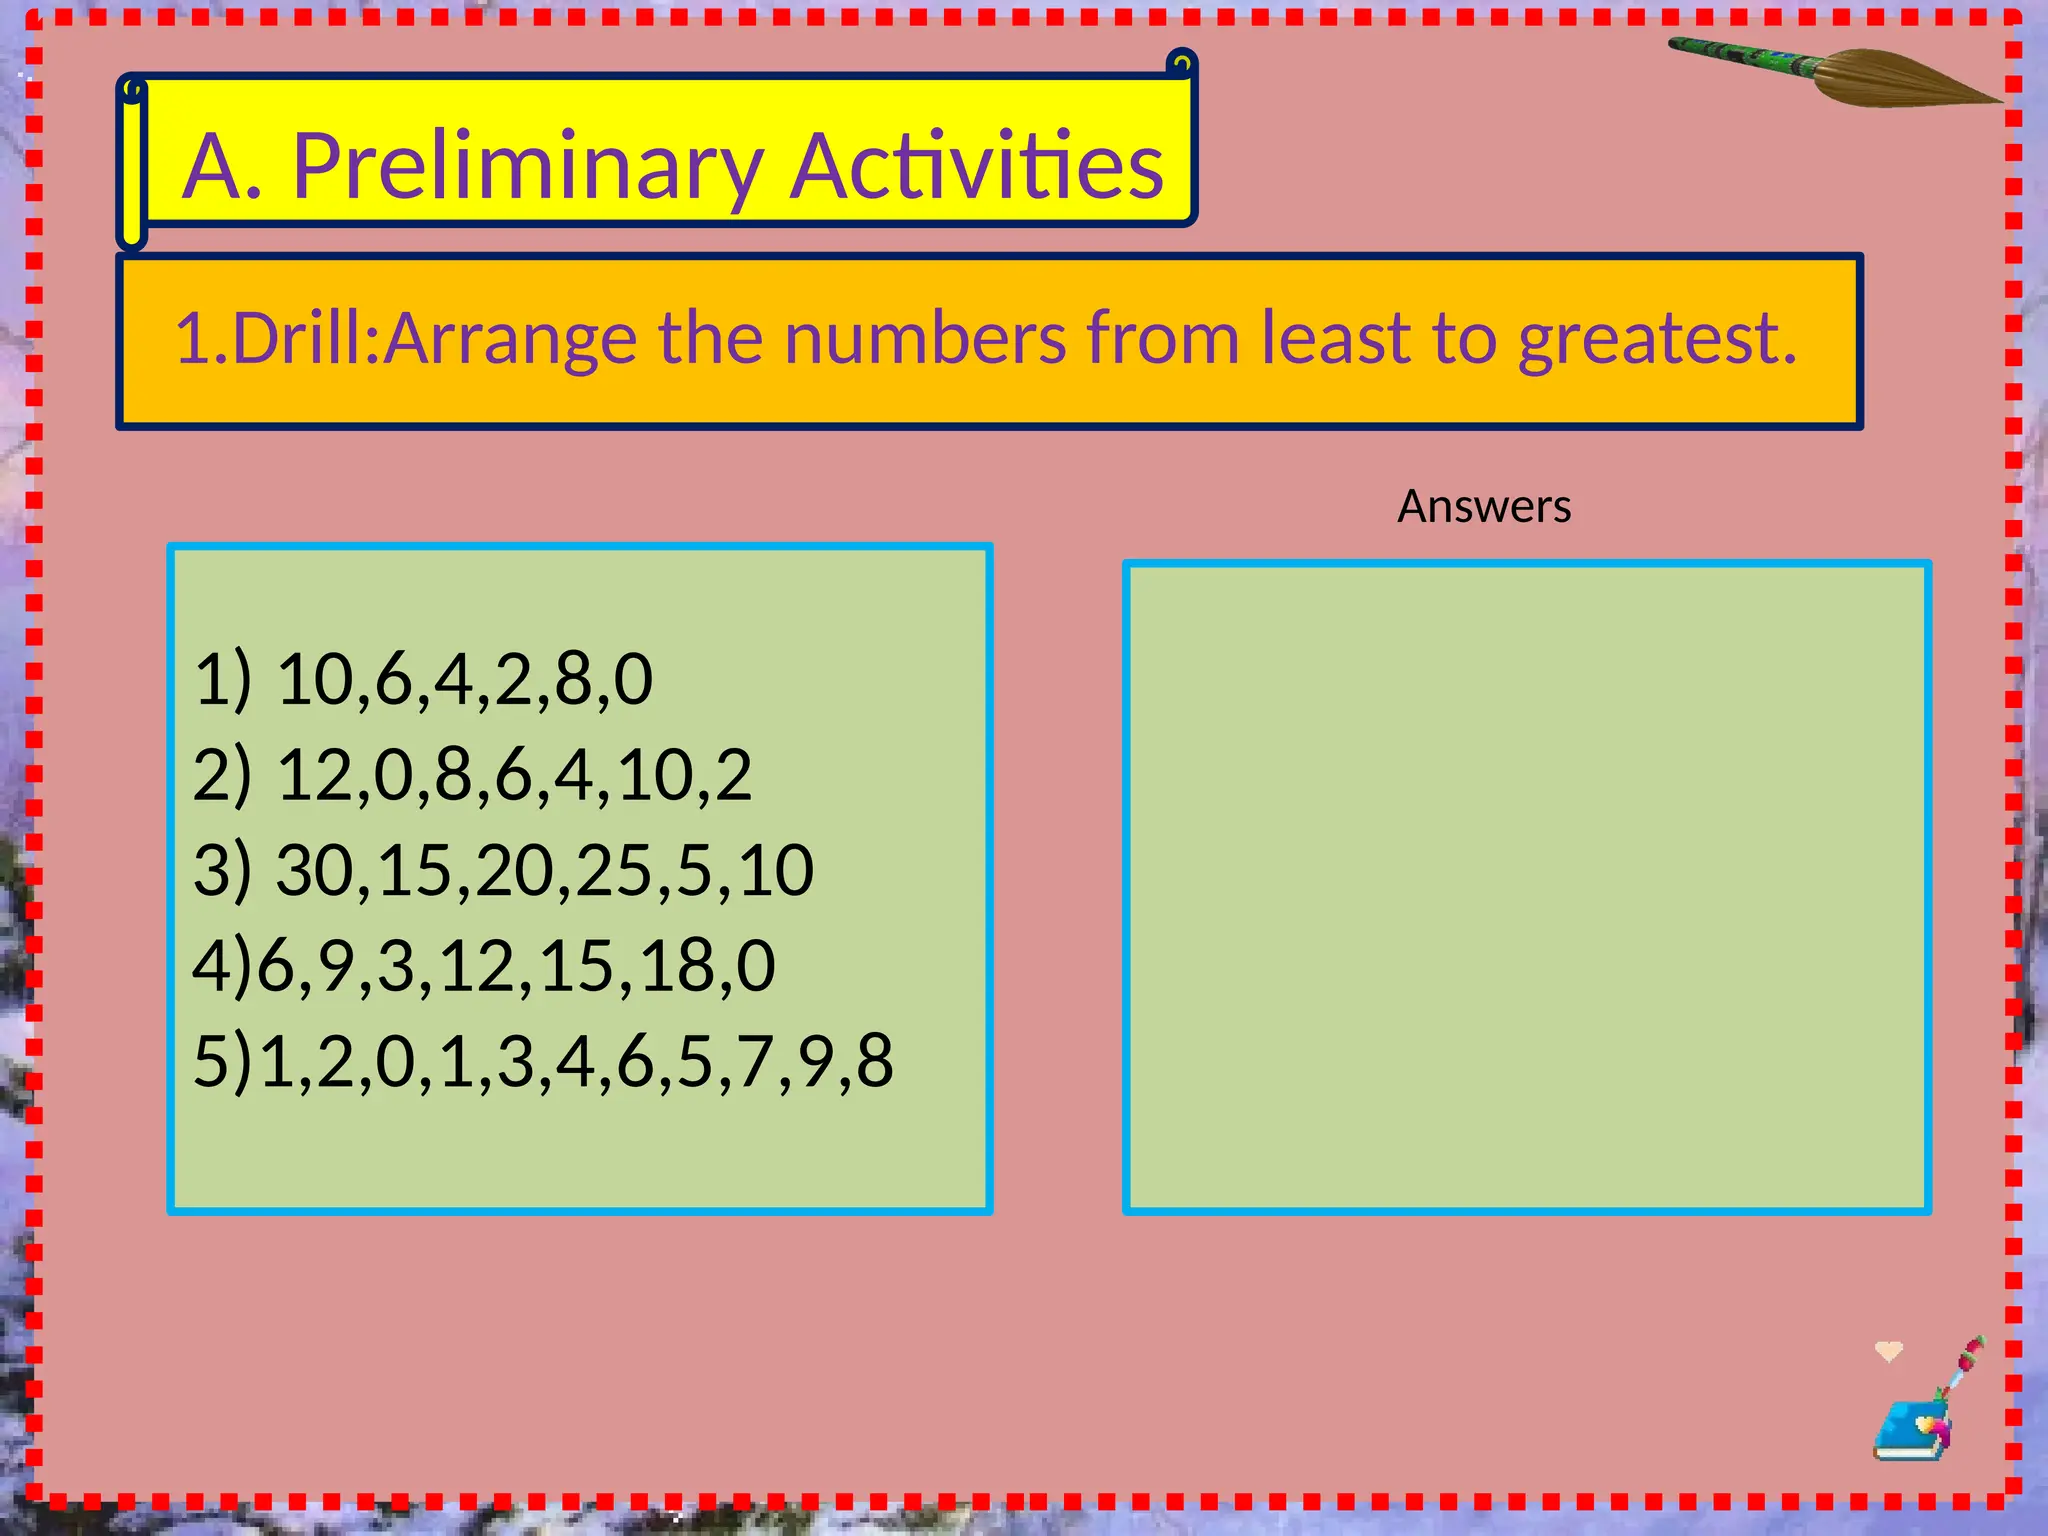
A. Preliminary Activities
1.Drill:Arrangethe numbers from least to greatest.
1) 10,6,4,2,8,0
2) 12,0,8,6,4,10,2
3) 30,15,20,25,5,10
4)6,9,3,12,15,18,0
5)1,2,0,1,3,4,6,5,7,9,8
Answers
4.
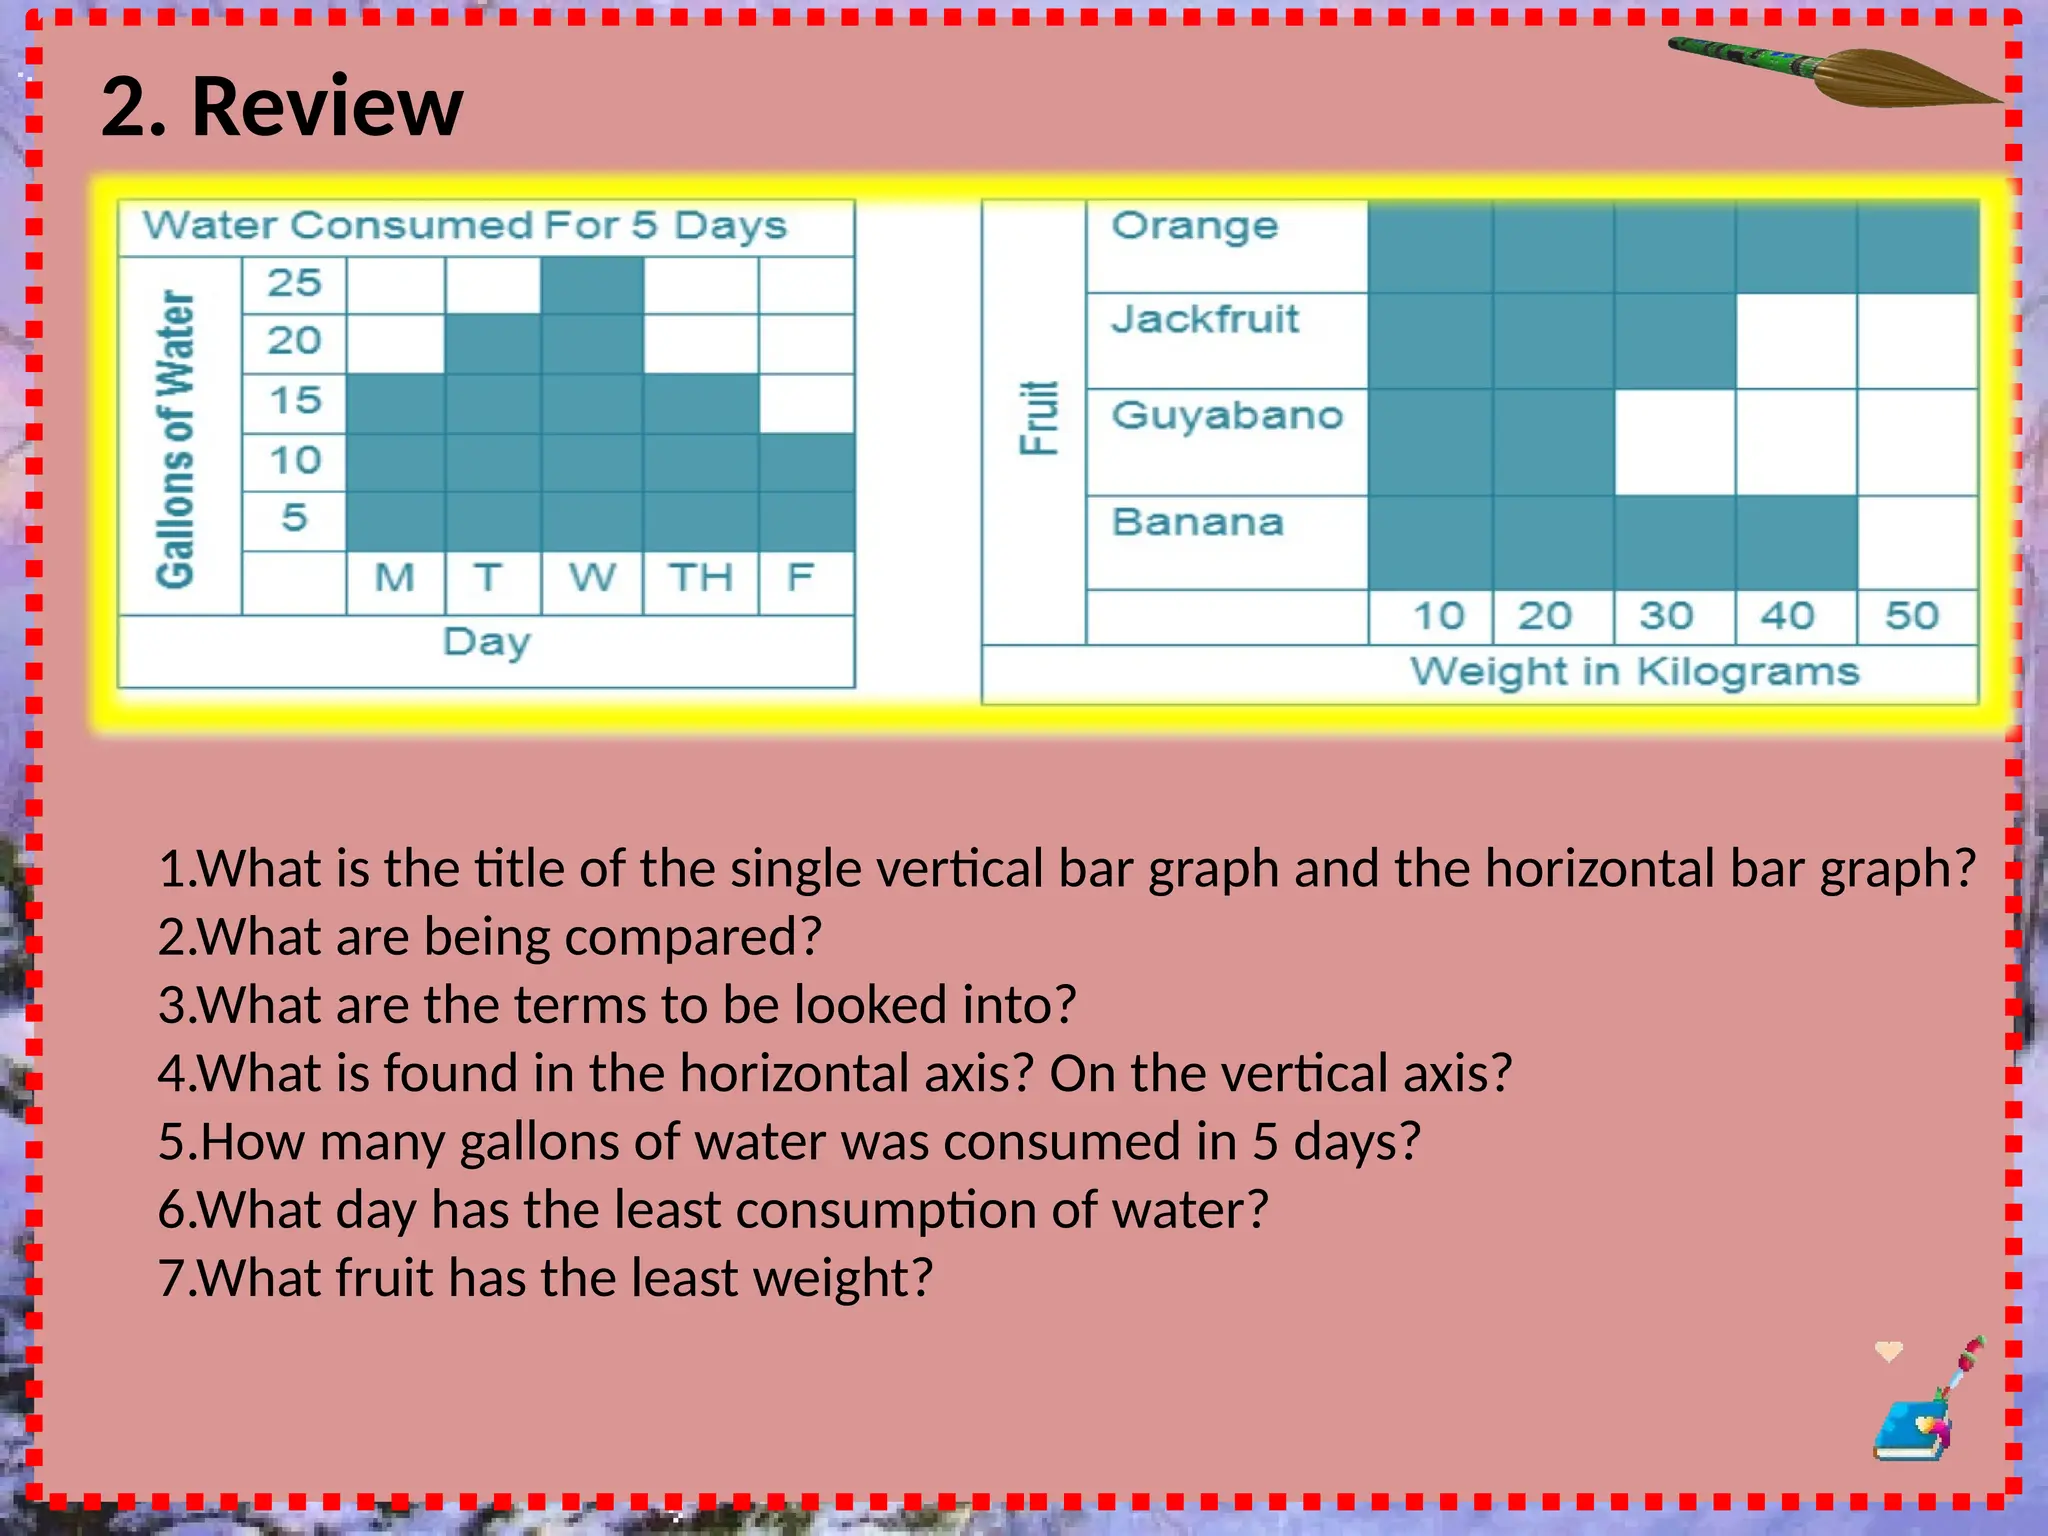
2. Review
1.What isthe title of the single vertical bar graph and the horizontal bar graph?
2.What are being compared?
3.What are the terms to be looked into?
4.What is found in the horizontal axis? On the vertical axis?
5.How many gallons of water was consumed in 5 days?
6.What day has the least consumption of water?
7.What fruit has the least weight?
5.
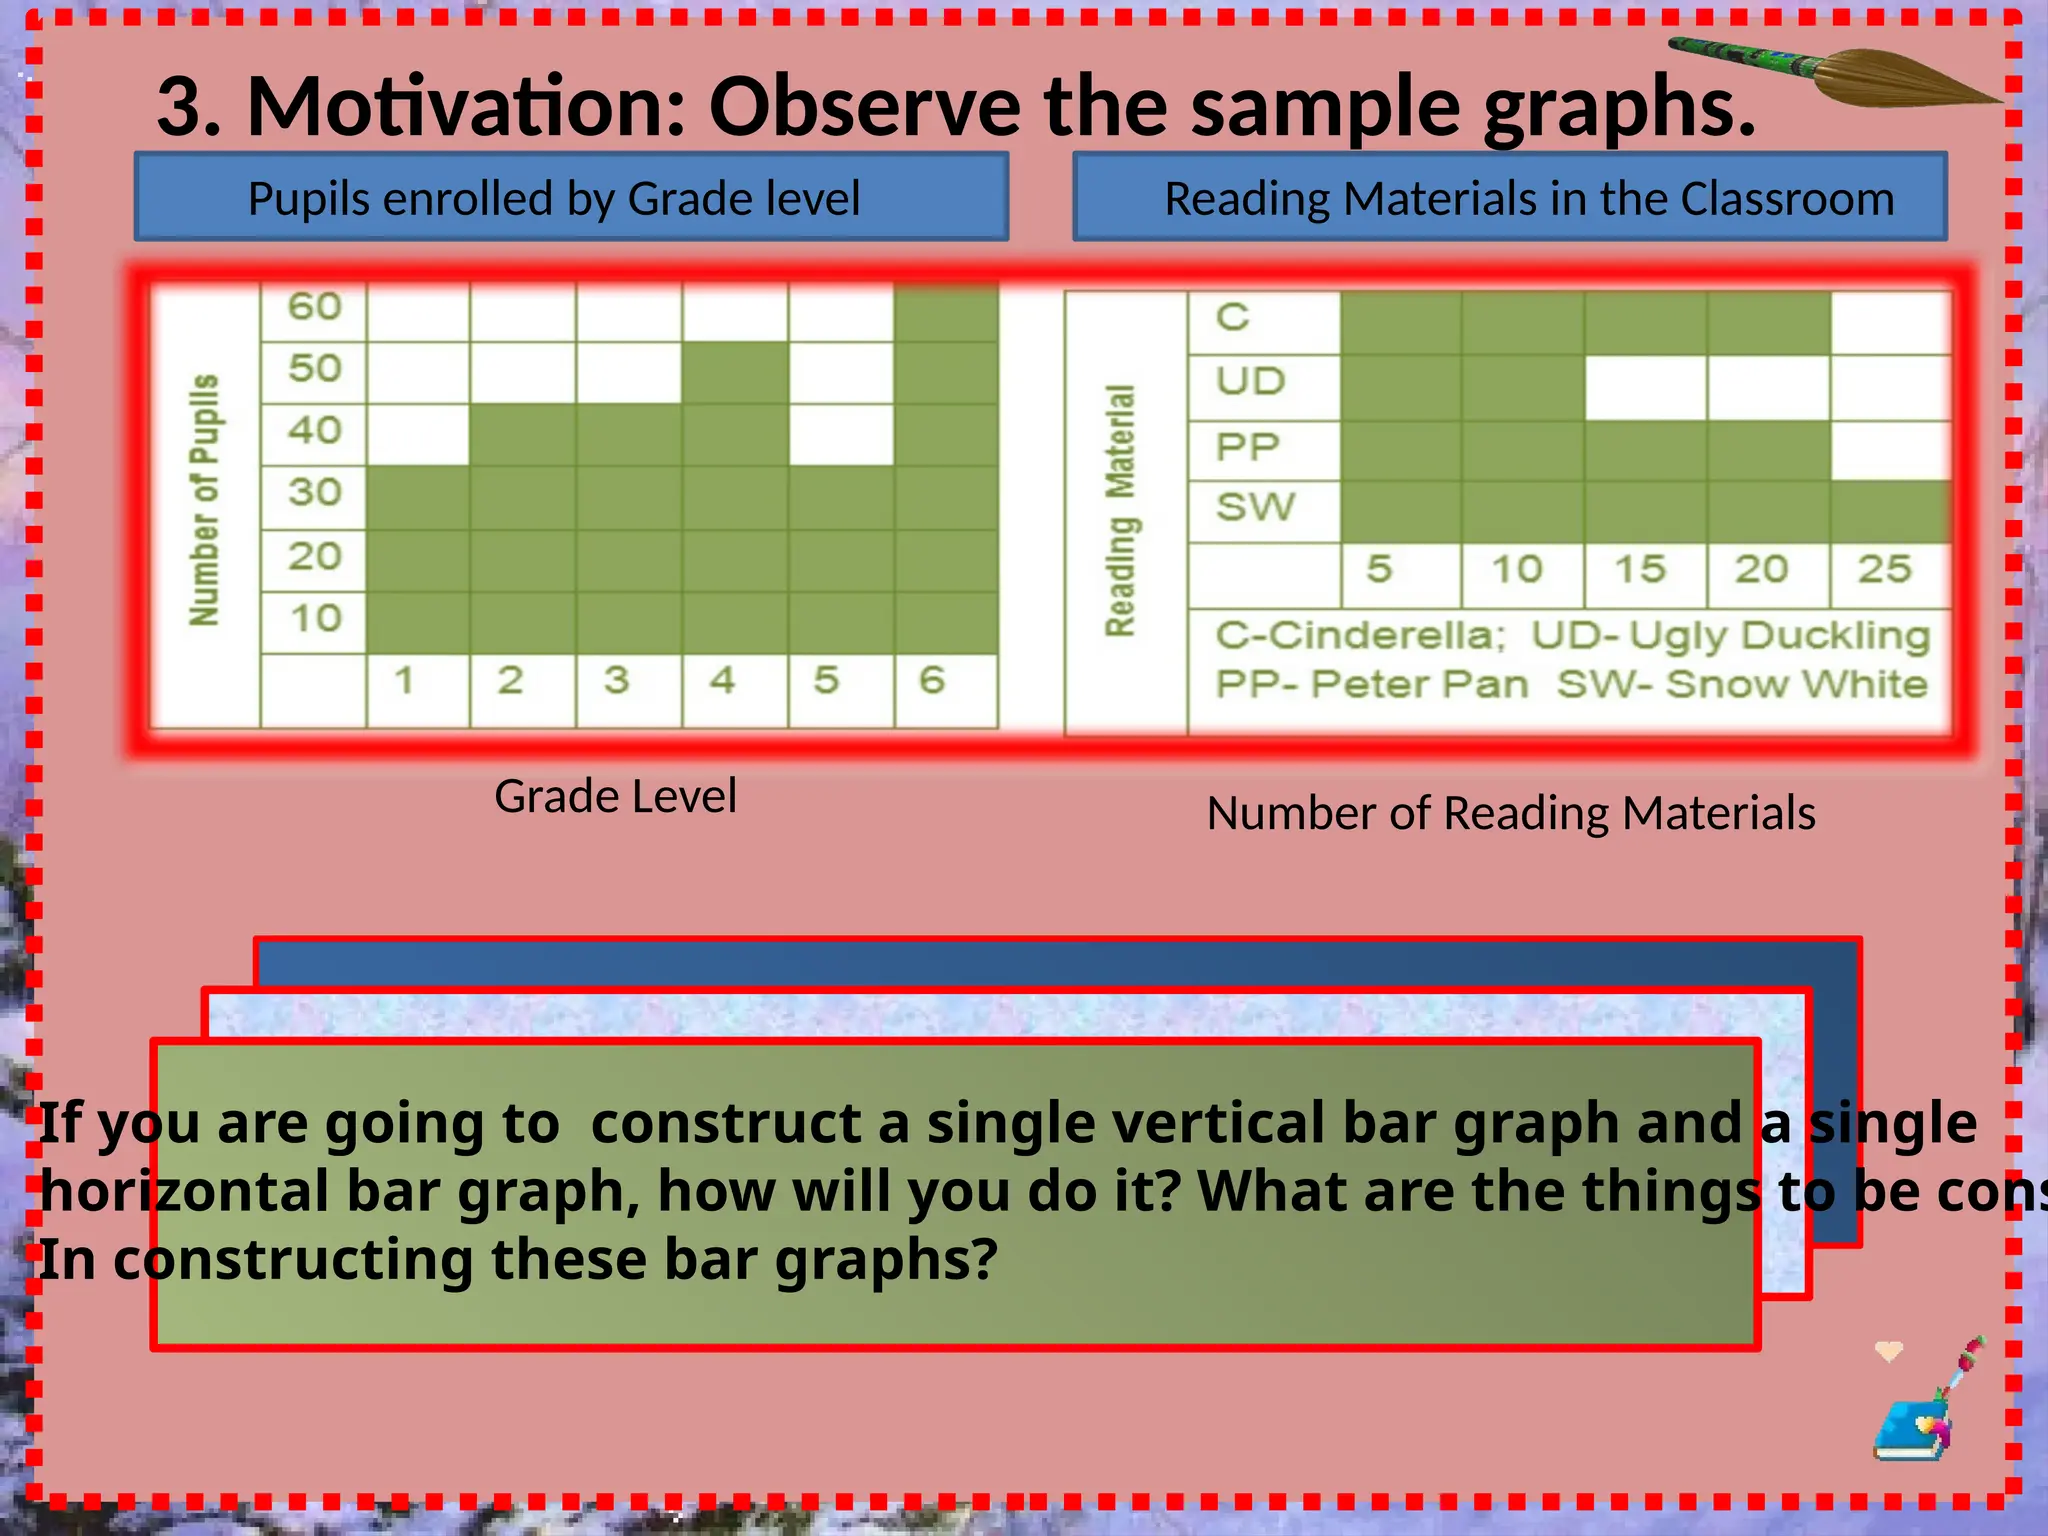
3. Motivation: Observethe sample graphs.
Pupils enrolled by Grade level Reading Materials in the Classroom
Grade Level Number of Reading Materials
If you are going to construct a single vertical bar graph and a single
horizontal bar graph, how will you do it? What are the things to be cons
In constructing these bar graphs?
6.
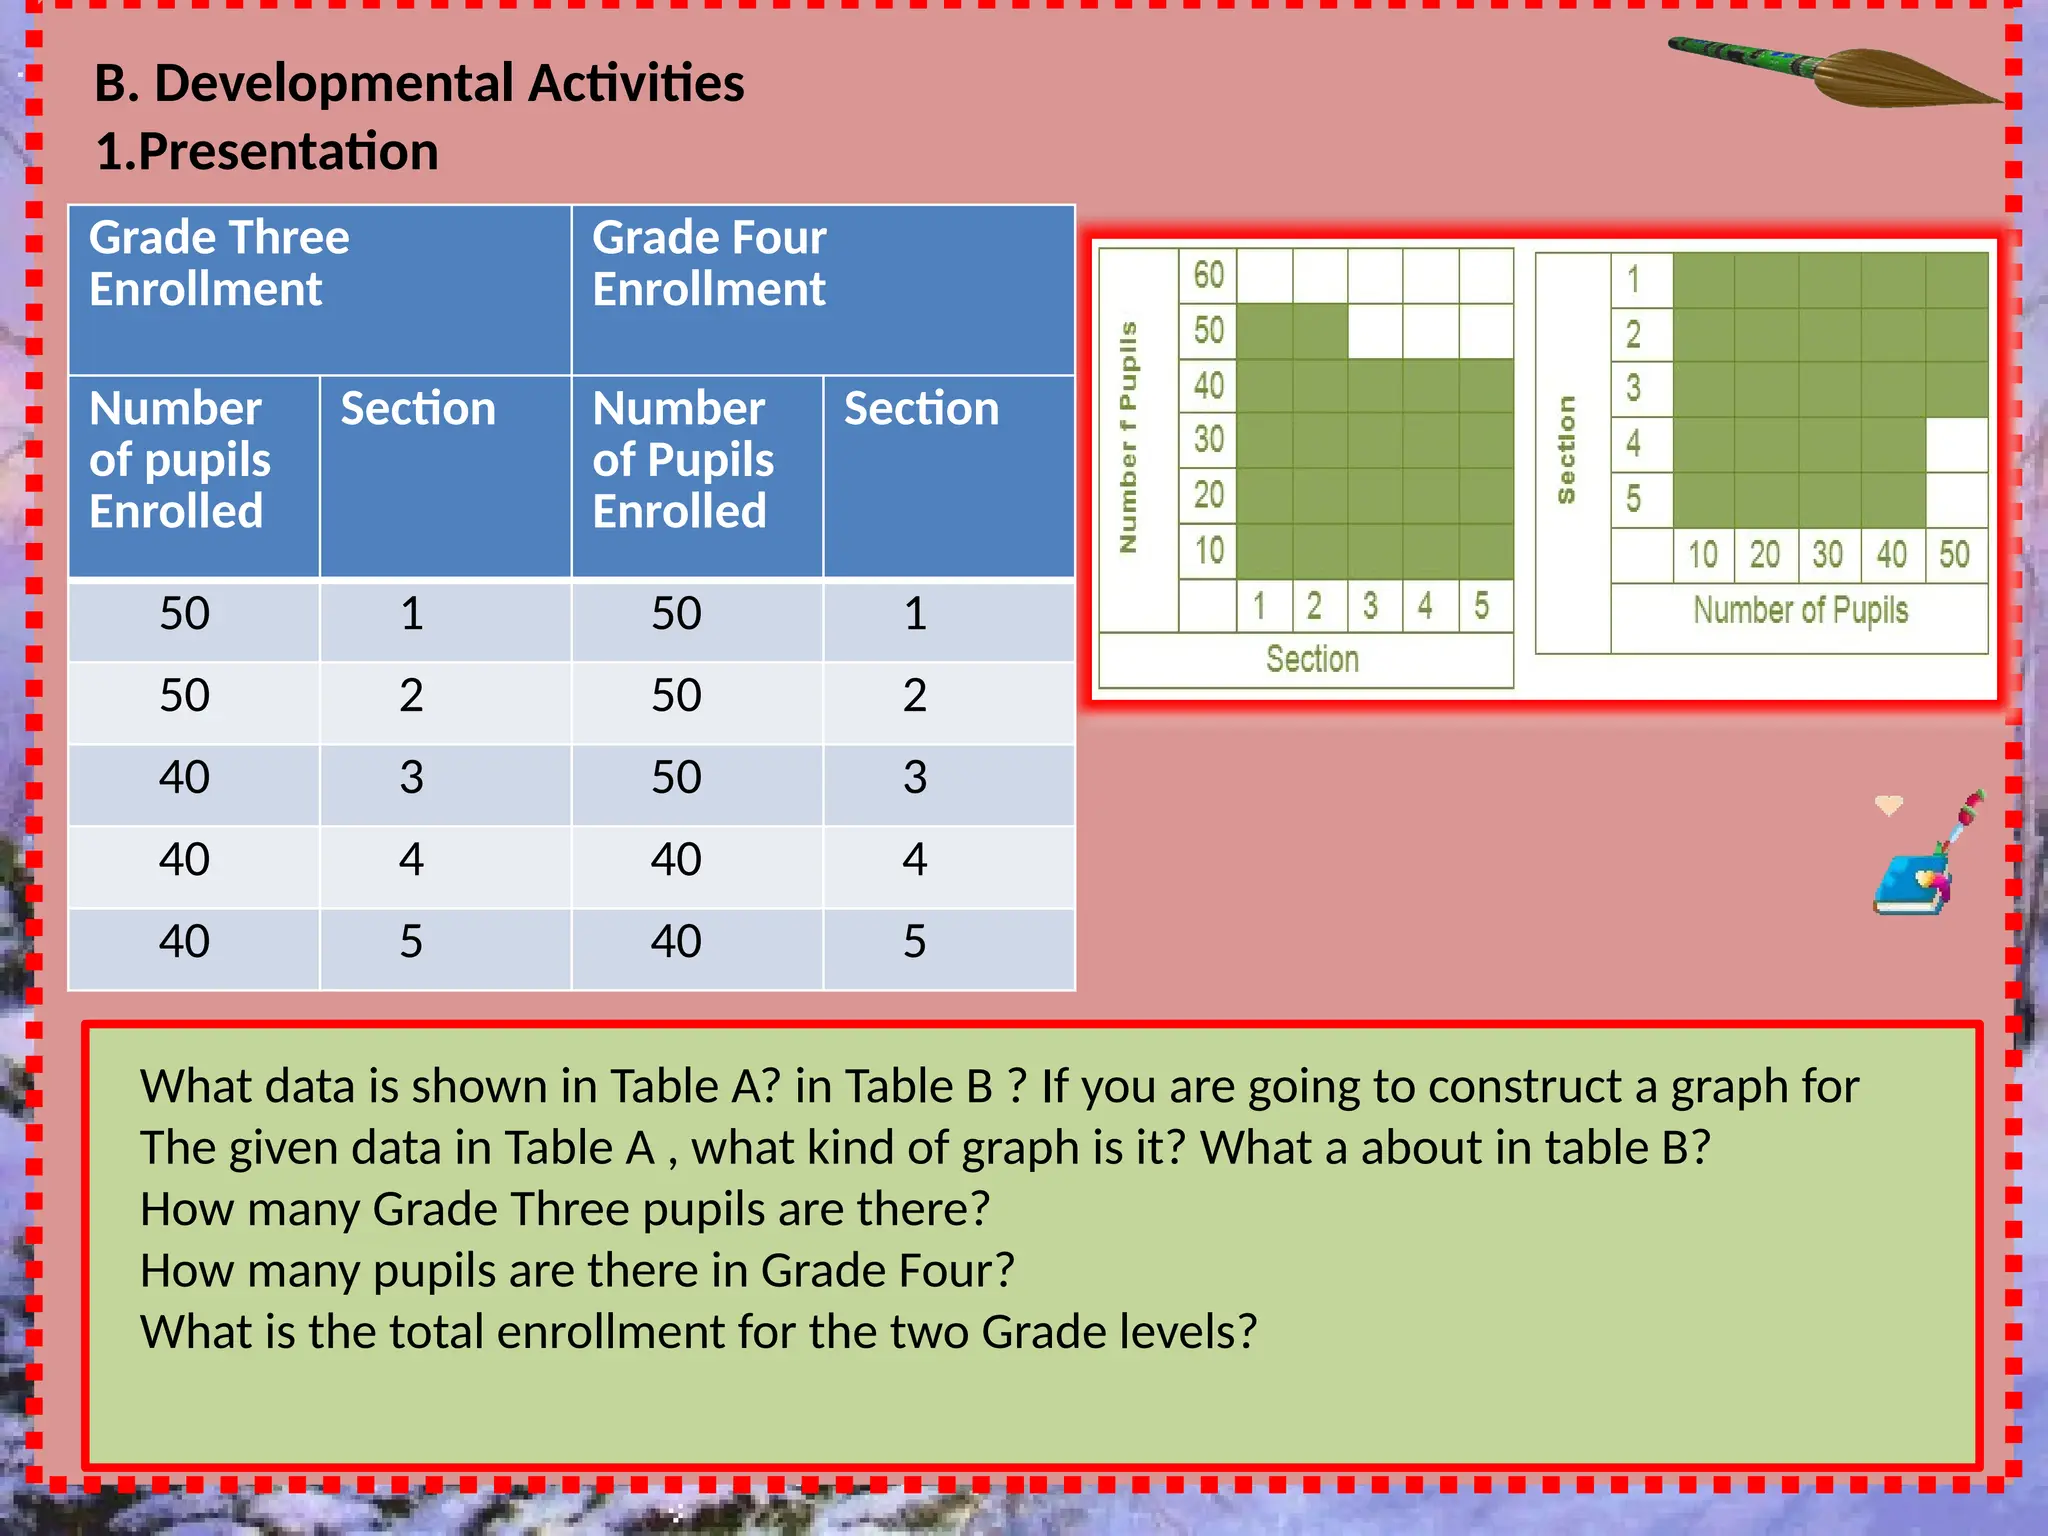
B. Developmental Activities
1.Presentation
GradeThree
Enrollment
Grade Four
Enrollment
Number
of pupils
Enrolled
Section Number
of Pupils
Enrolled
Section
50 1 50 1
50 2 50 2
40 3 50 3
40 4 40 4
40 5 40 5
What data is shown in Table A? in Table B ? If you are going to construct a graph for
The given data in Table A , what kind of graph is it? What a about in table B?
How many Grade Three pupils are there?
How many pupils are there in Grade Four?
What is the total enrollment for the two Grade levels?
7.
2. Performing theActivities : Team work[4 groups]
Present the given data into a graph . NOTE:Tables A and B are vertical
bar graphs . Tables C and D are horizontal bar graphs.]
Color No.of pupils who
prefer the color
Blue 25
Red 5
Orange 10
Pink 10
Yellow 20
Food Price
Chopsuey Php 35.00
Kaldereta Php 20.00
Kare-Kare Php 15.00
Adobo Php 35.00
Fried Chicken Php 25.00
Table A Table B
Favorite Color
Price of Food
8.
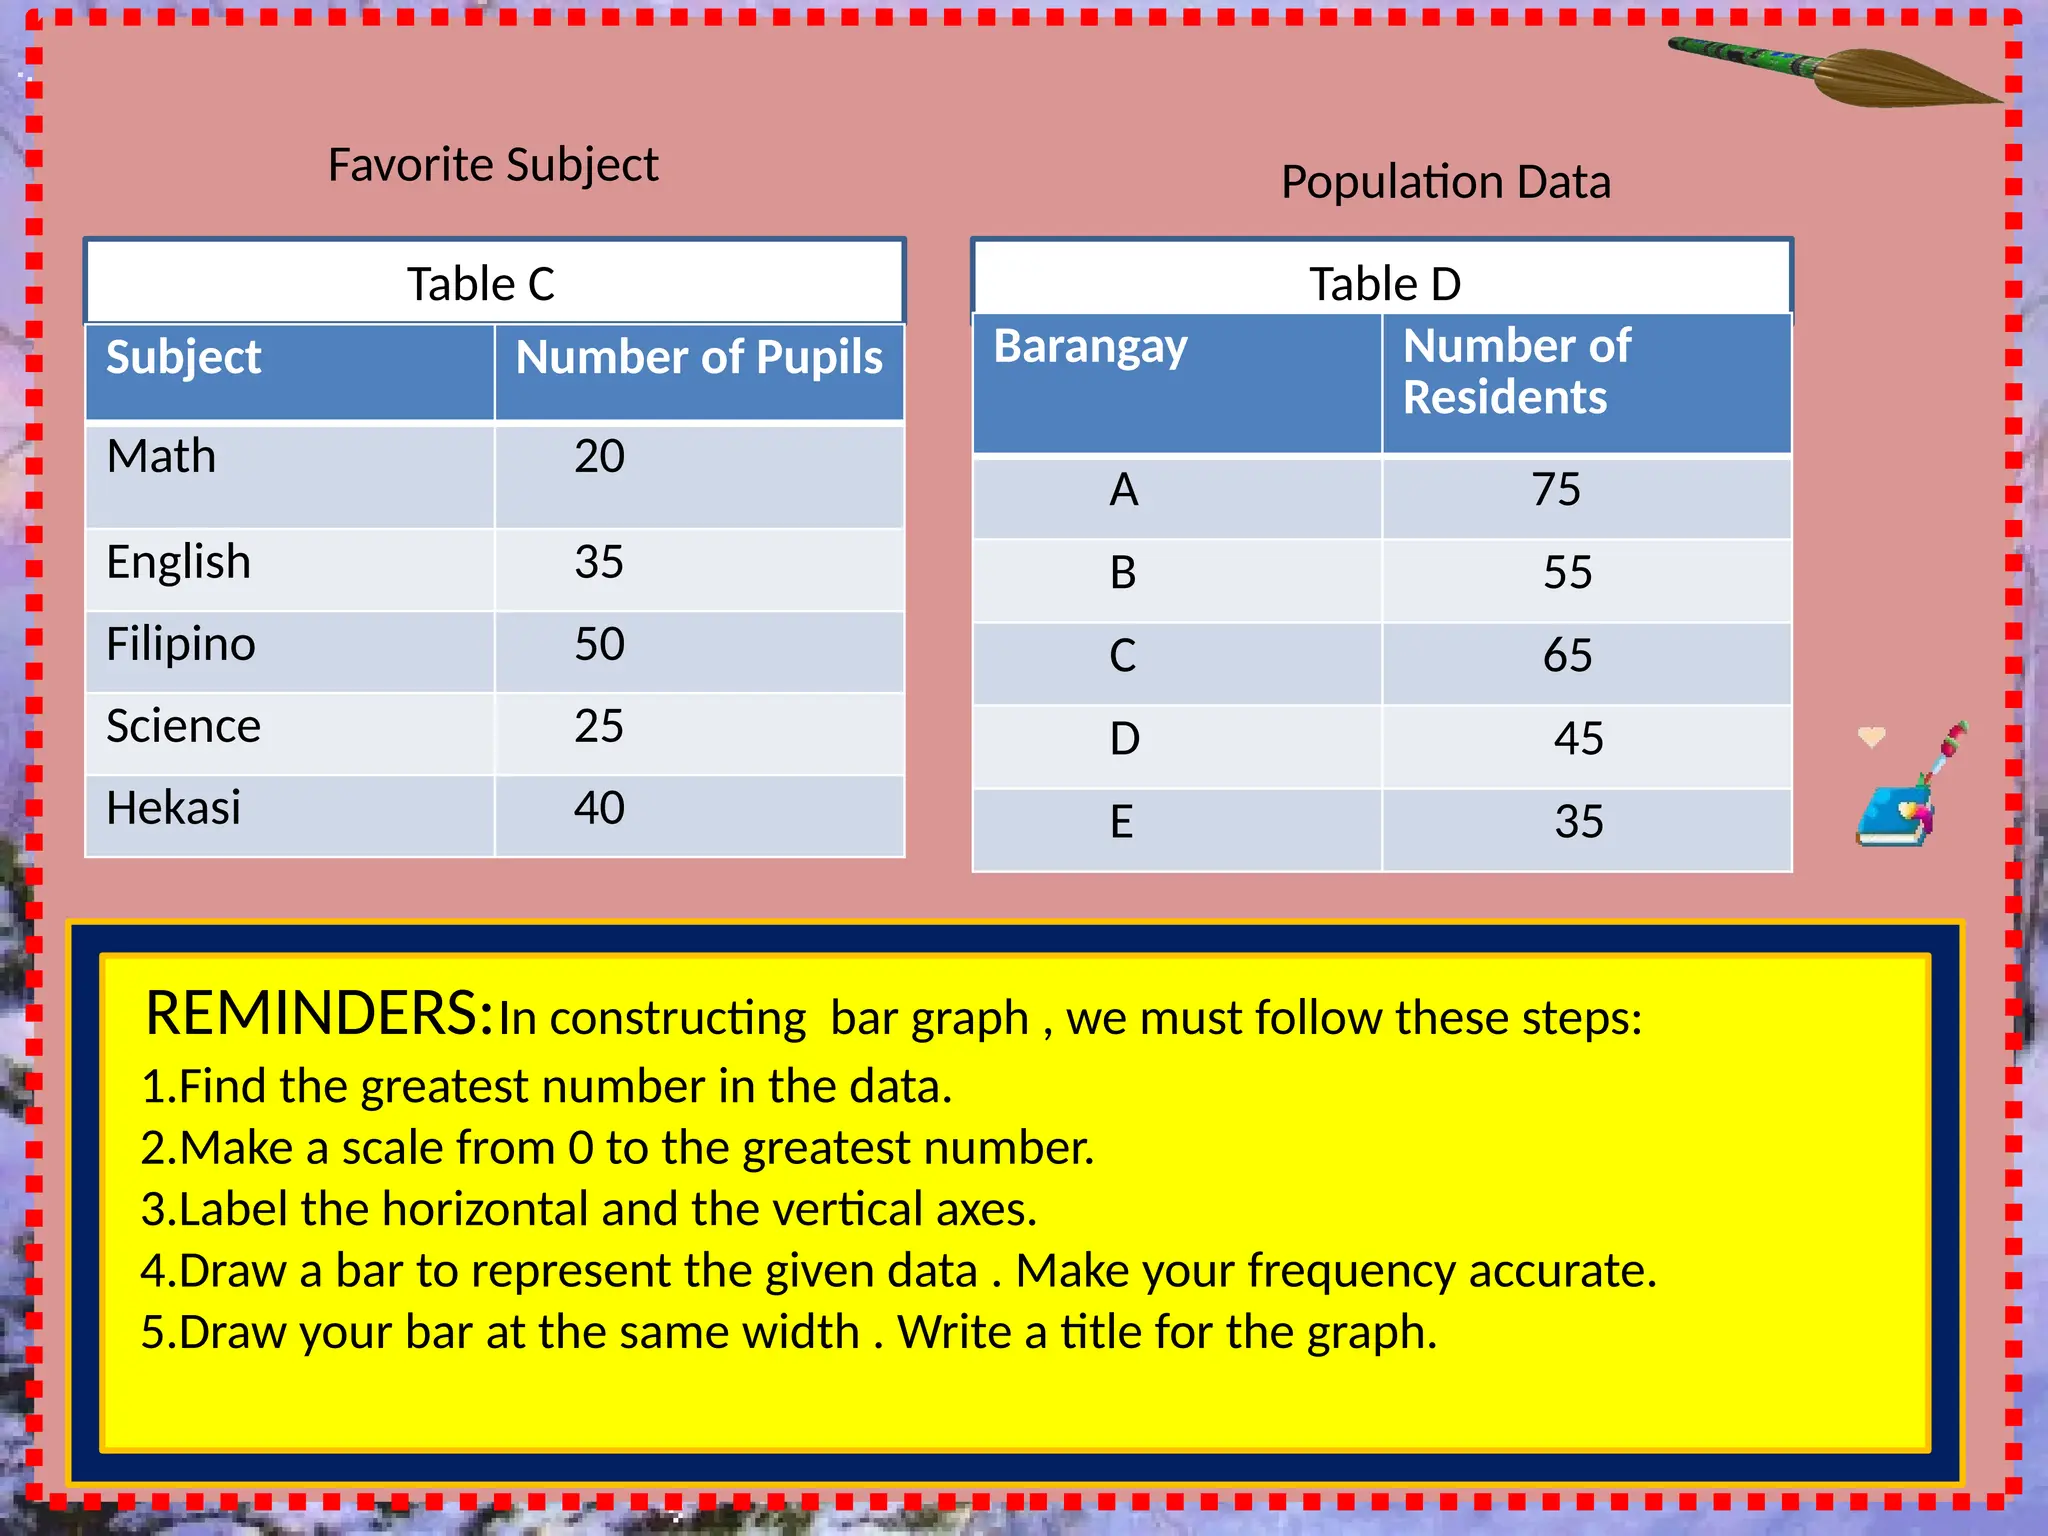
Favorite Subject PopulationData
Table C Table D
Subject Number of Pupils
Math 20
English 35
Filipino 50
Science 25
Hekasi 40
Barangay Number of
Residents
A 75
B 55
C 65
D 45
E 35
REMINDERS:In constructing bar graph , we must follow these steps:
1.Find the greatest number in the data.
2.Make a scale from 0 to the greatest number.
3.Label the horizontal and the vertical axes.
4.Draw a bar to represent the given data . Make your frequency accurate.
5.Draw your bar at the same width . Write a title for the graph.
9.
3.Processing the Activities:How did
you find the activity?
How were you able to construct a
single vertical bar graph and a
horizontal bar graph?
What are the steps in constructing a
bar graph?
10.
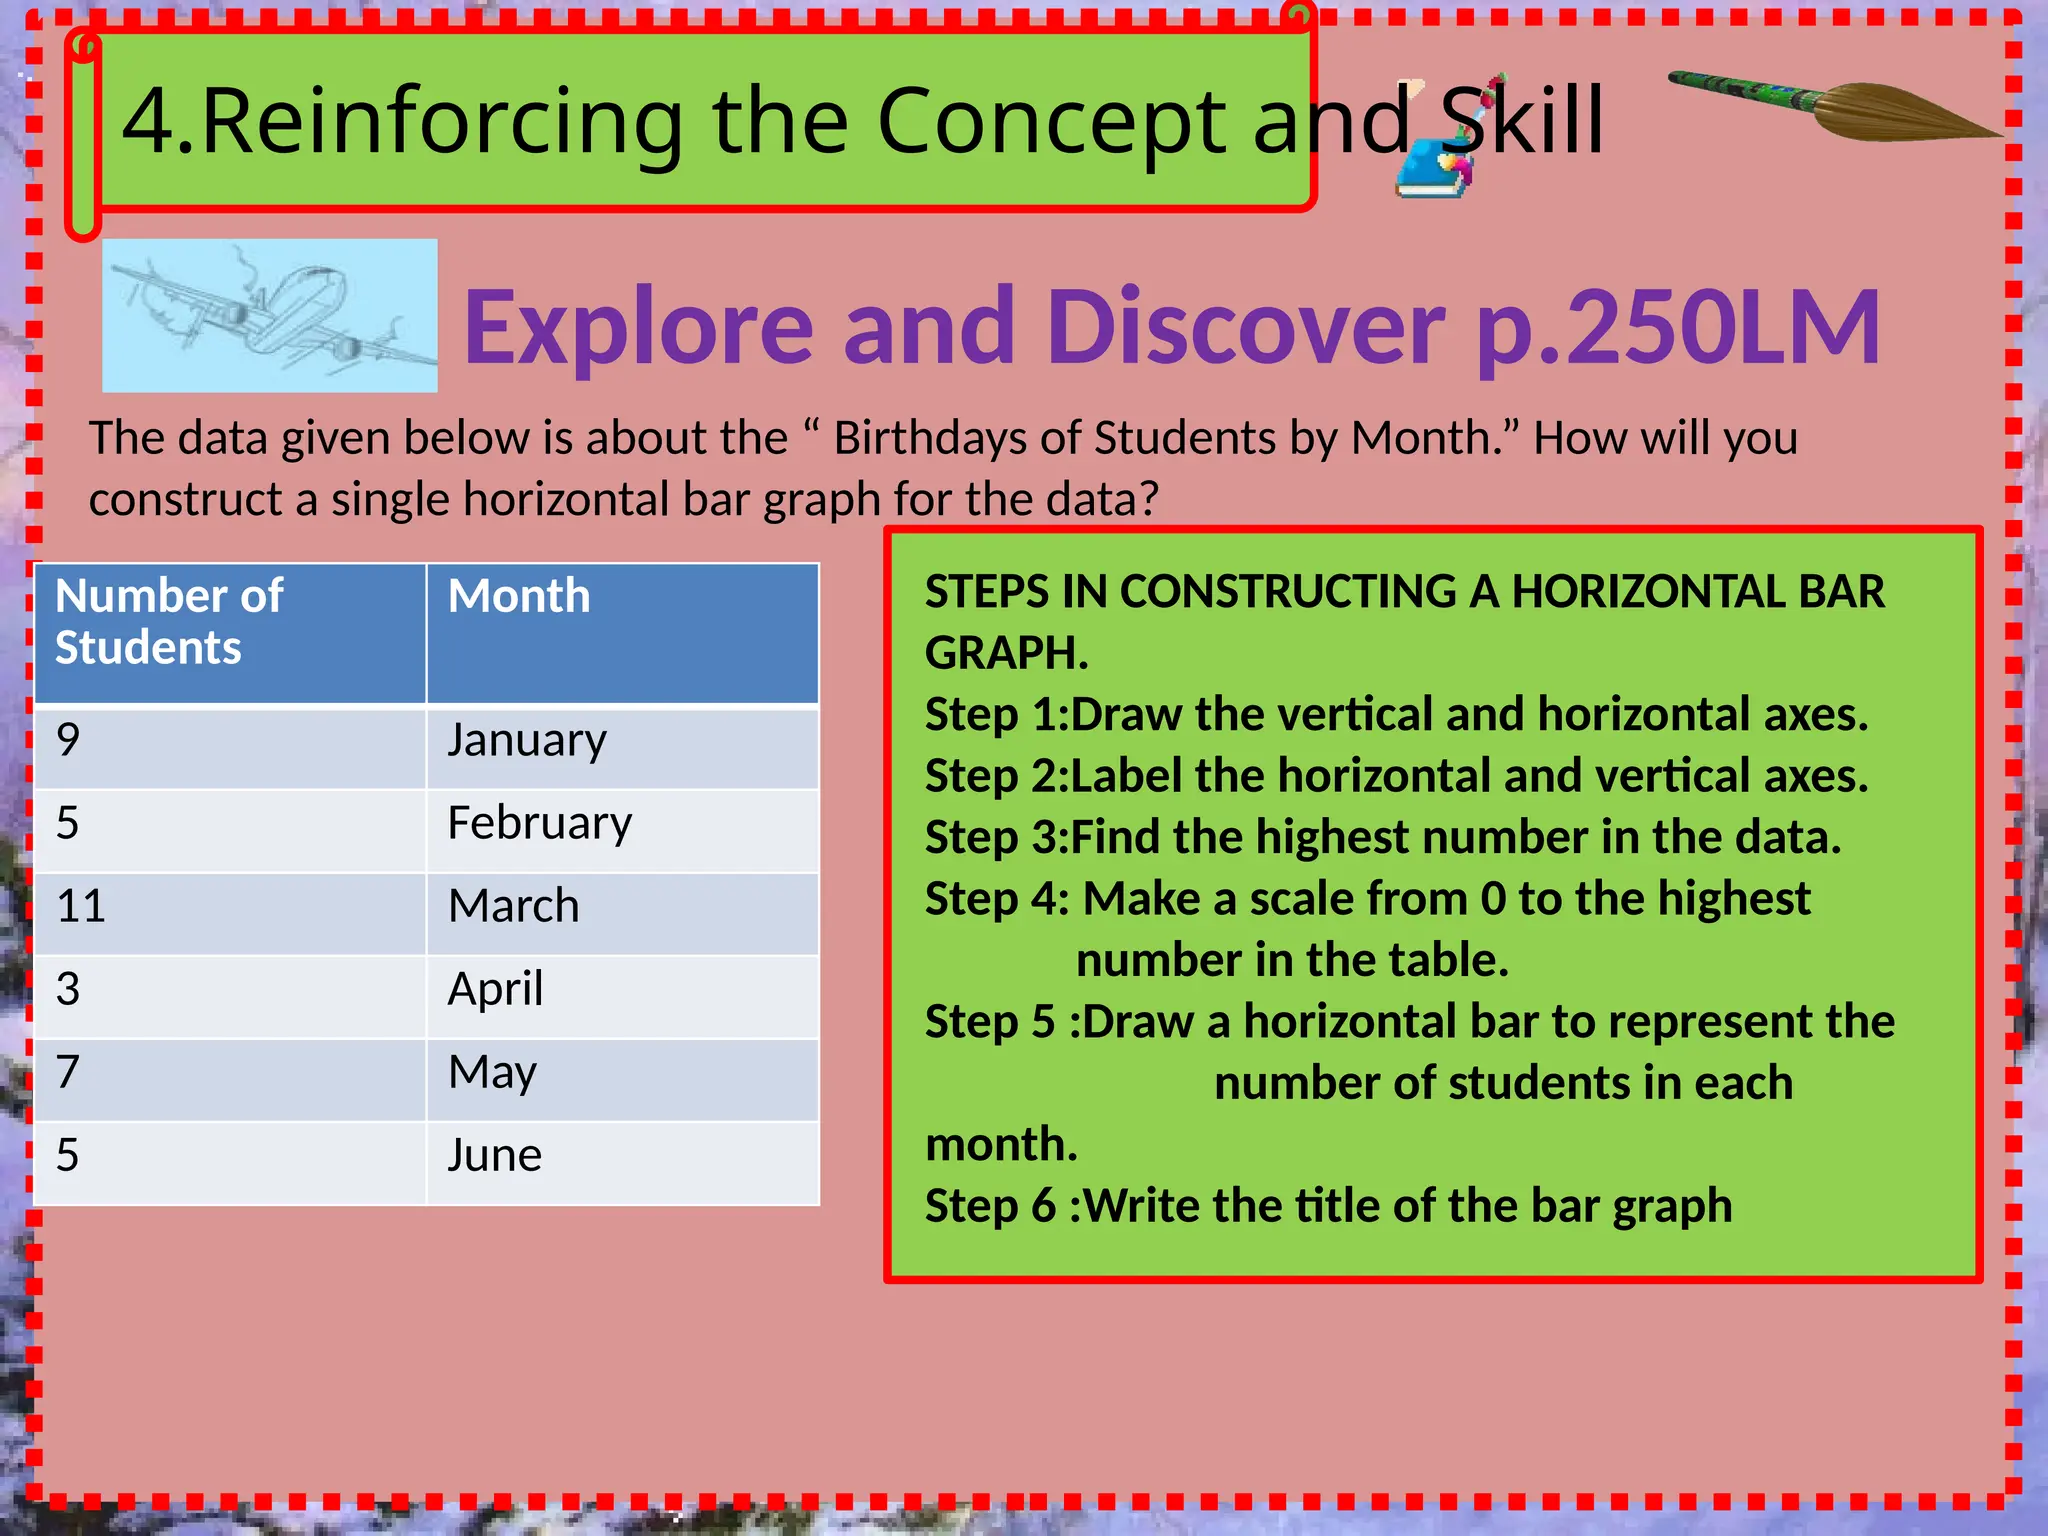
4.Reinforcing the Conceptand Skill
Explore and Discover p.250LM
The data given below is about the “ Birthdays of Students by Month.” How will you
construct a single horizontal bar graph for the data?
Number of
Students
Month
9 January
5 February
11 March
3 April
7 May
5 June
STEPS IN CONSTRUCTING A HORIZONTAL BAR
GRAPH.
Step 1:Draw the vertical and horizontal axes.
Step 2:Label the horizontal and vertical axes.
Step 3:Find the highest number in the data.
Step 4: Make a scale from 0 to the highest
number in the table.
Step 5 :Draw a horizontal bar to represent the
number of students in each
month.
Step 6 :Write the title of the bar graph
11.
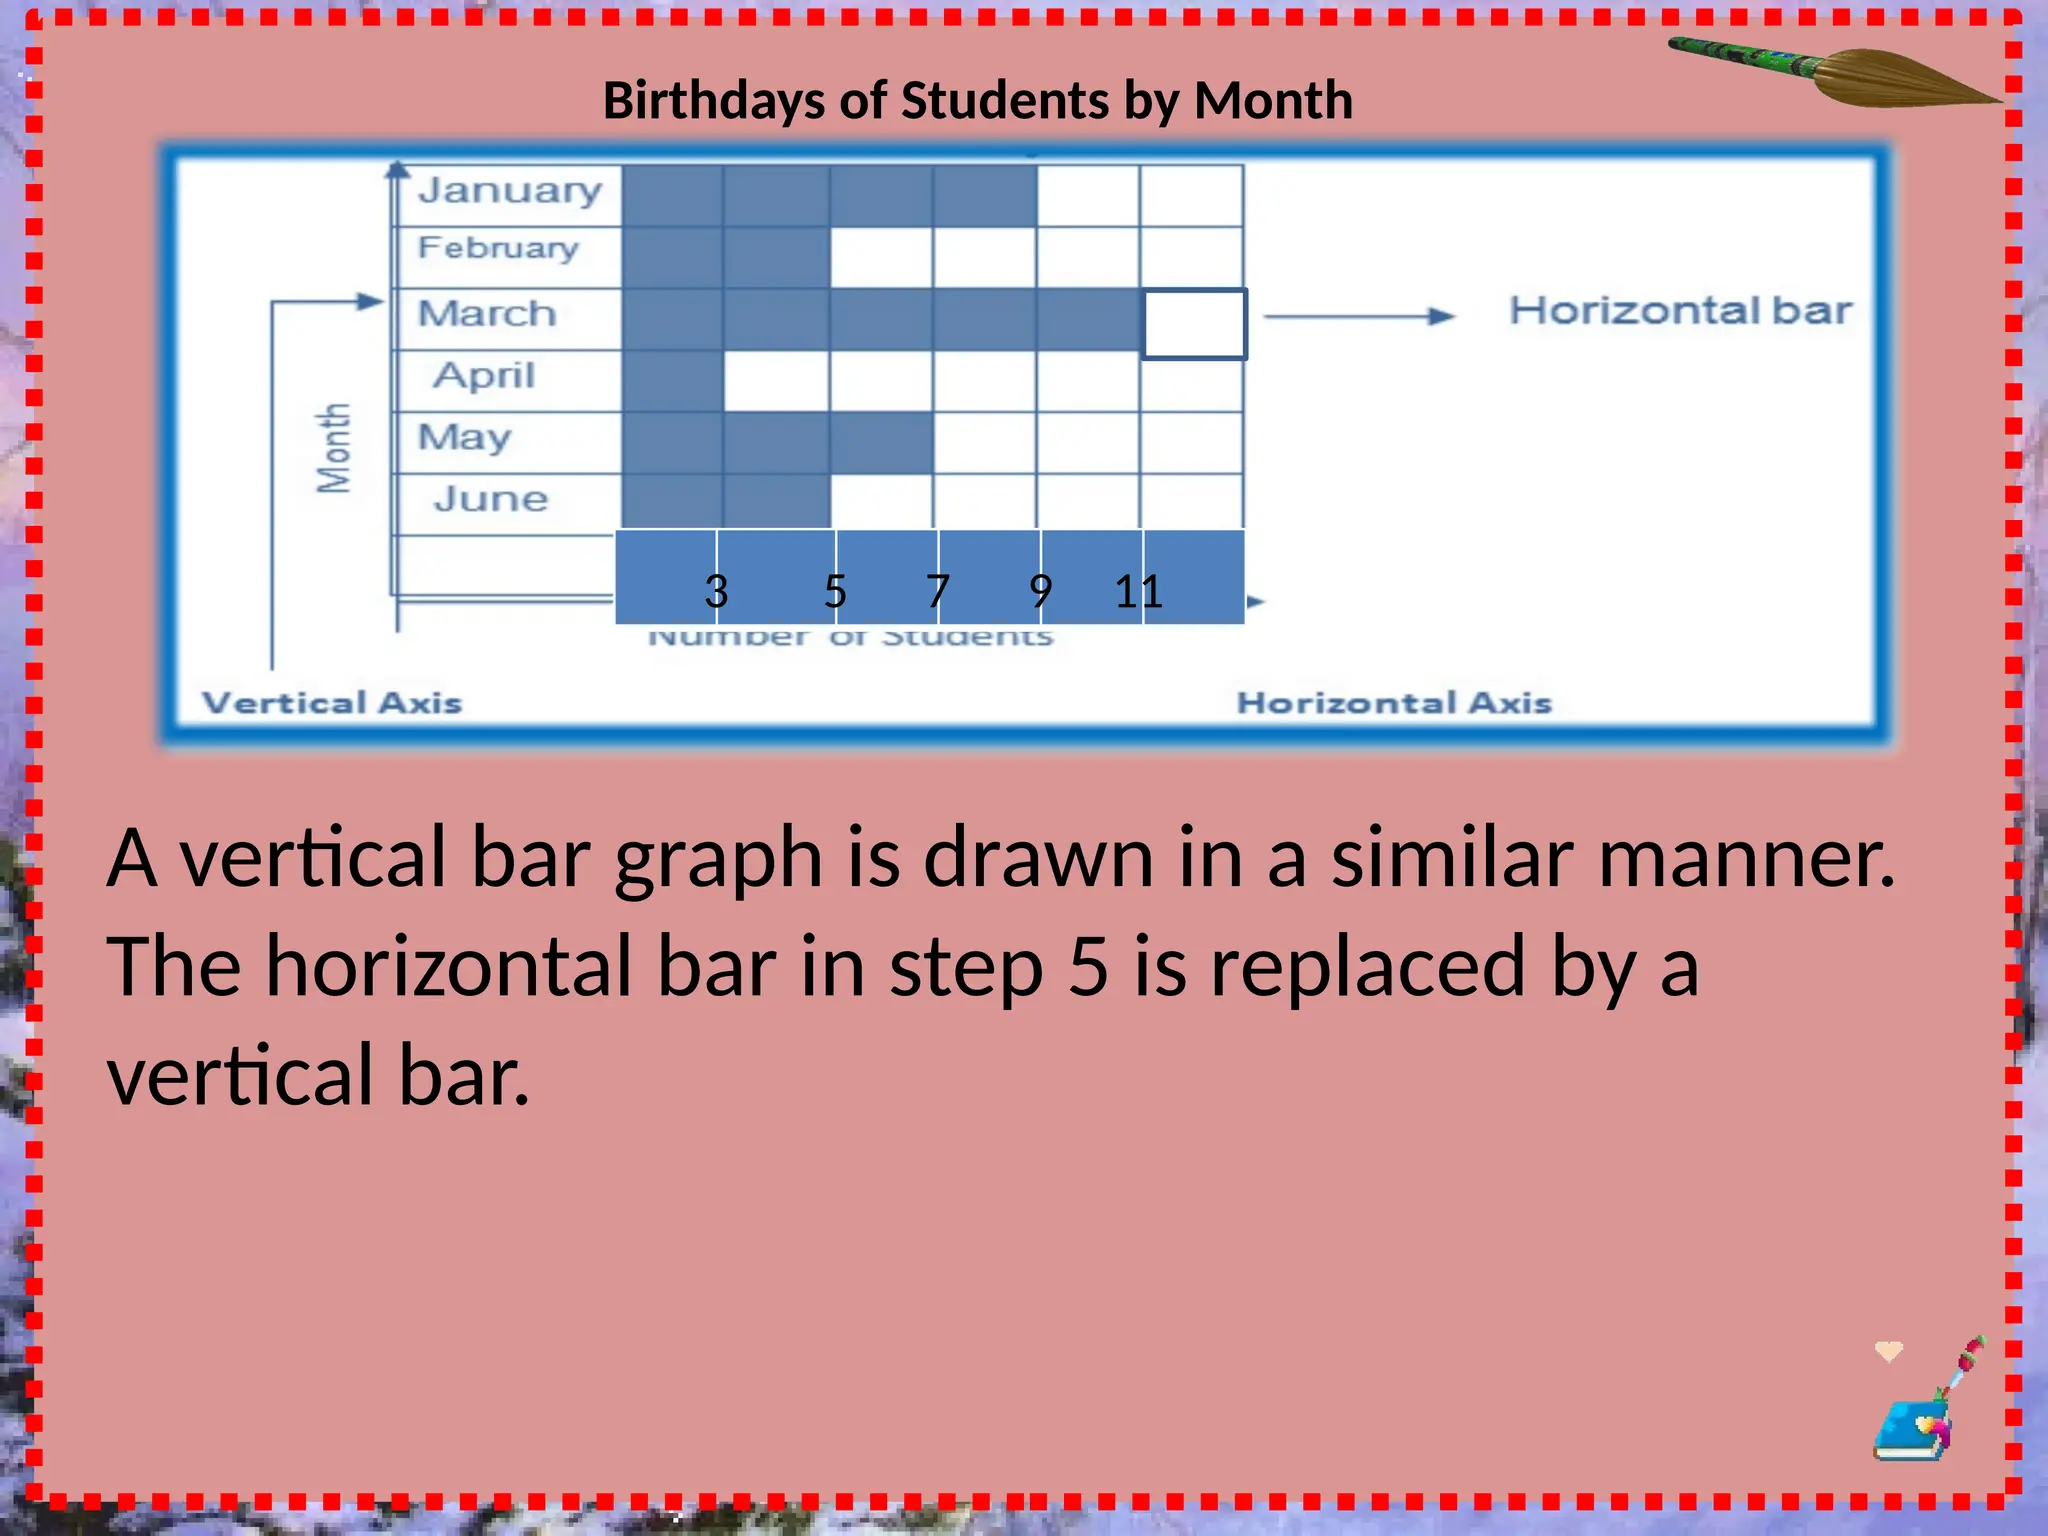
Birthdays of Studentsby Month
3 5 7 9 11
A vertical bar graph is drawn in a similar manner.
The horizontal bar in step 5 is replaced by a
vertical bar.
12.
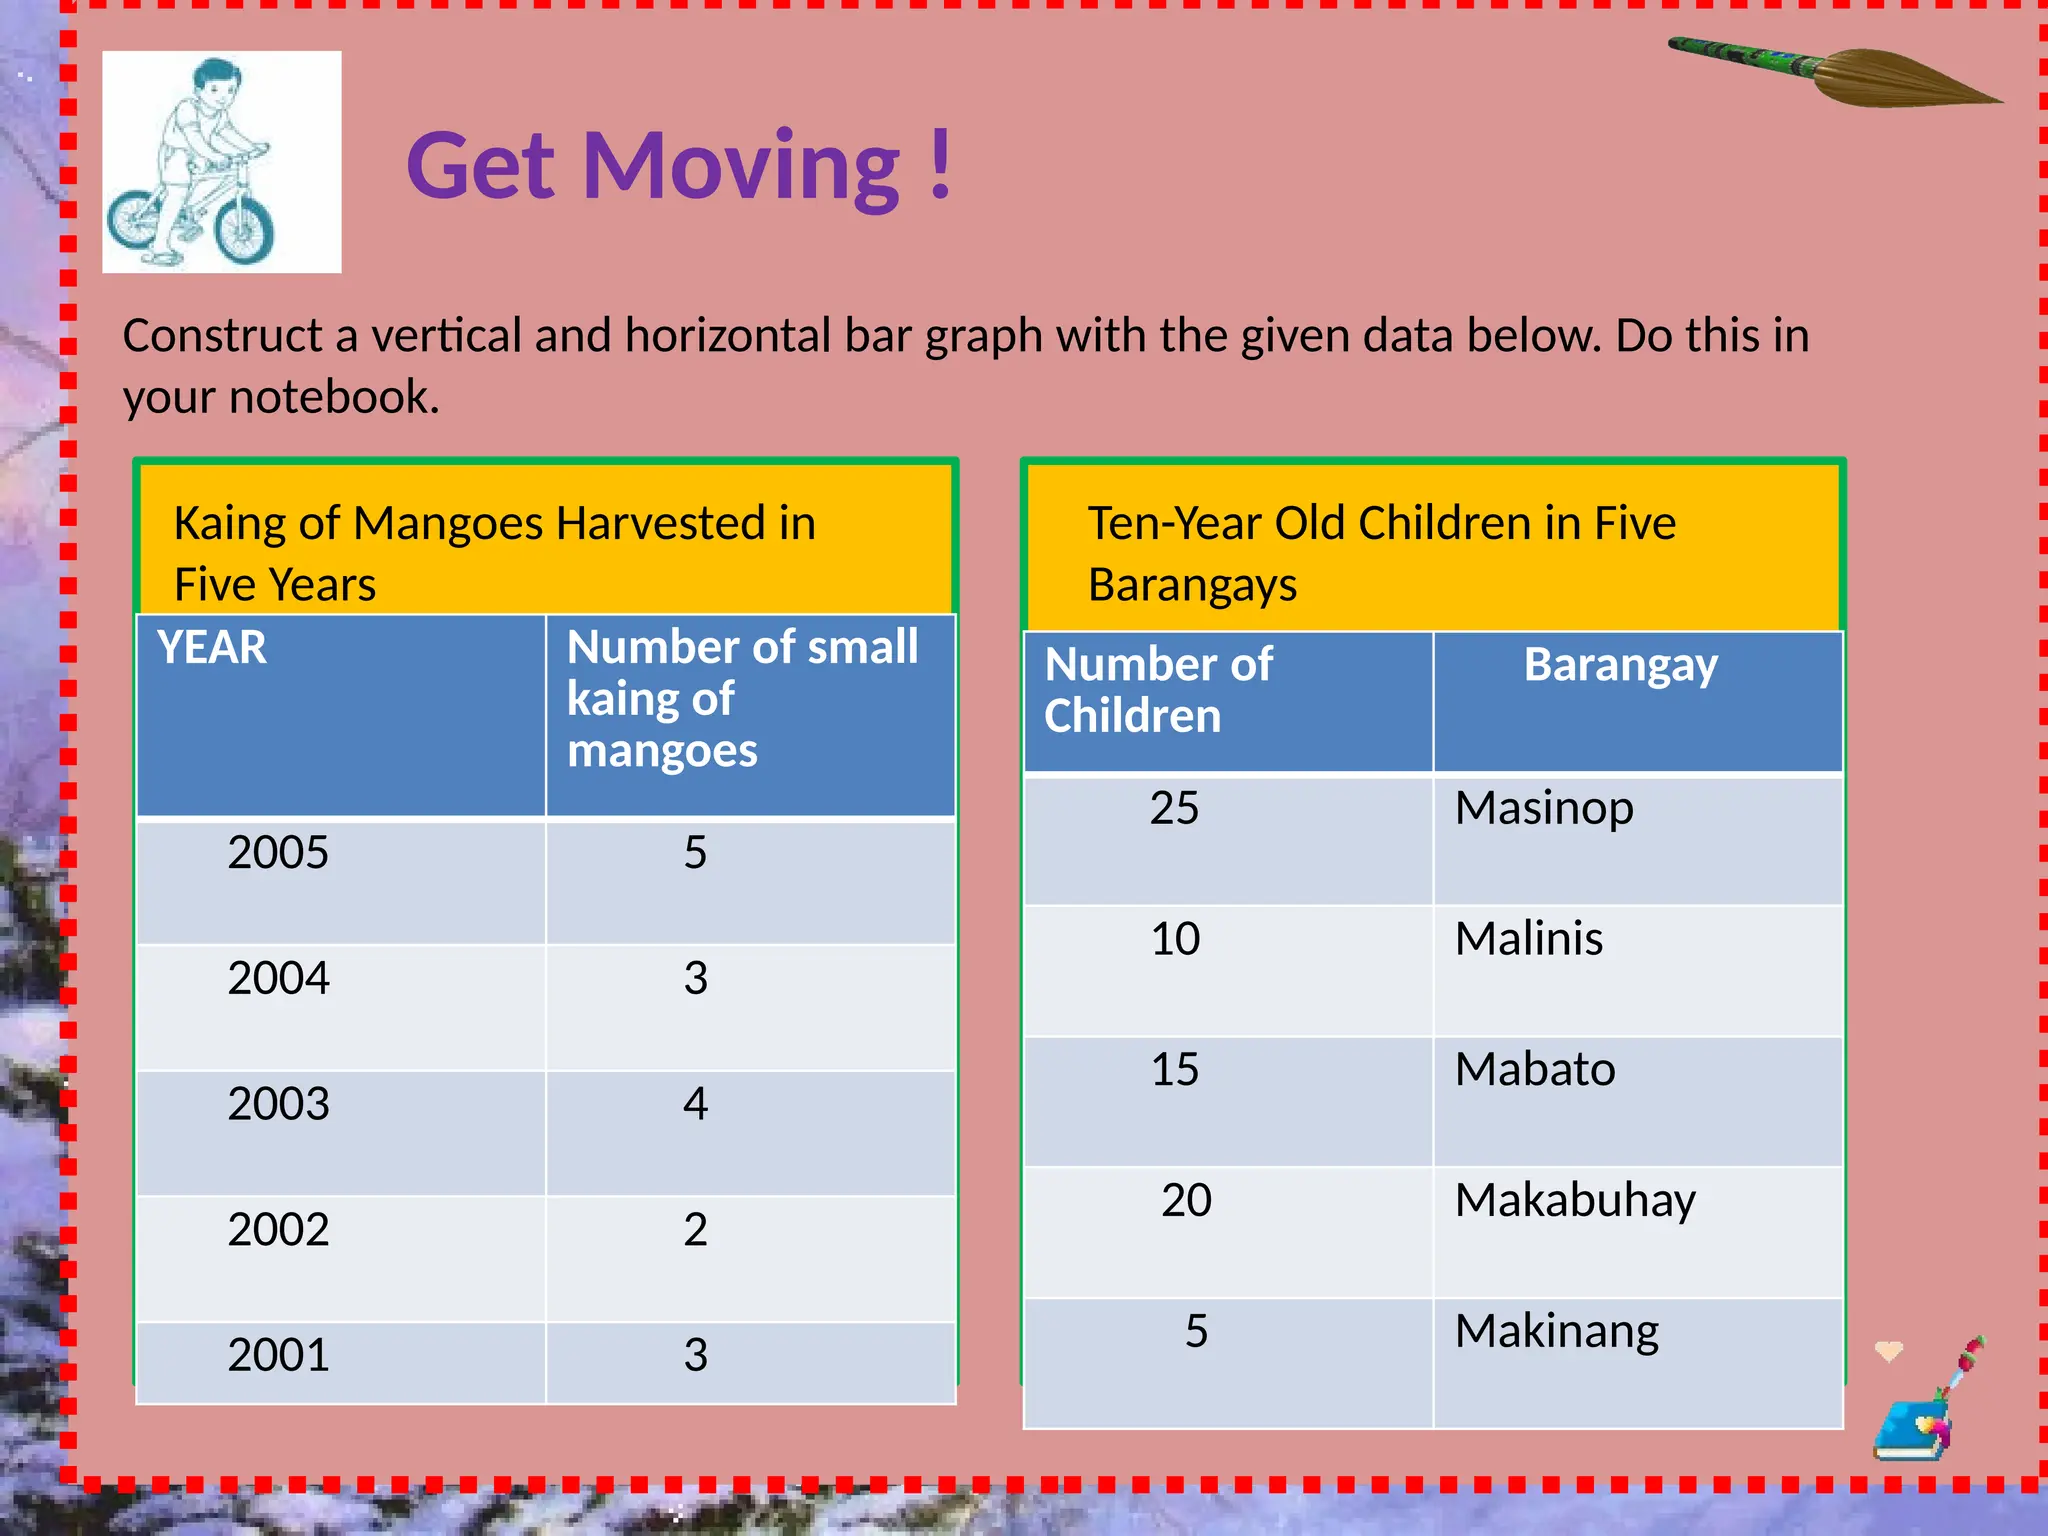
Get Moving !
Constructa vertical and horizontal bar graph with the given data below. Do this in
your notebook.
Kaing of Mangoes Harvested in
Five Years
Ten-Year Old Children in Five
Barangays
YEAR Number of small
kaing of
mangoes
2005 5
2004 3
2003 4
2002 2
2001 3
Number of
Children
Barangay
25 Masinop
10 Malinis
15 Mabato
20 Makabuhay
5 Makinang
13.
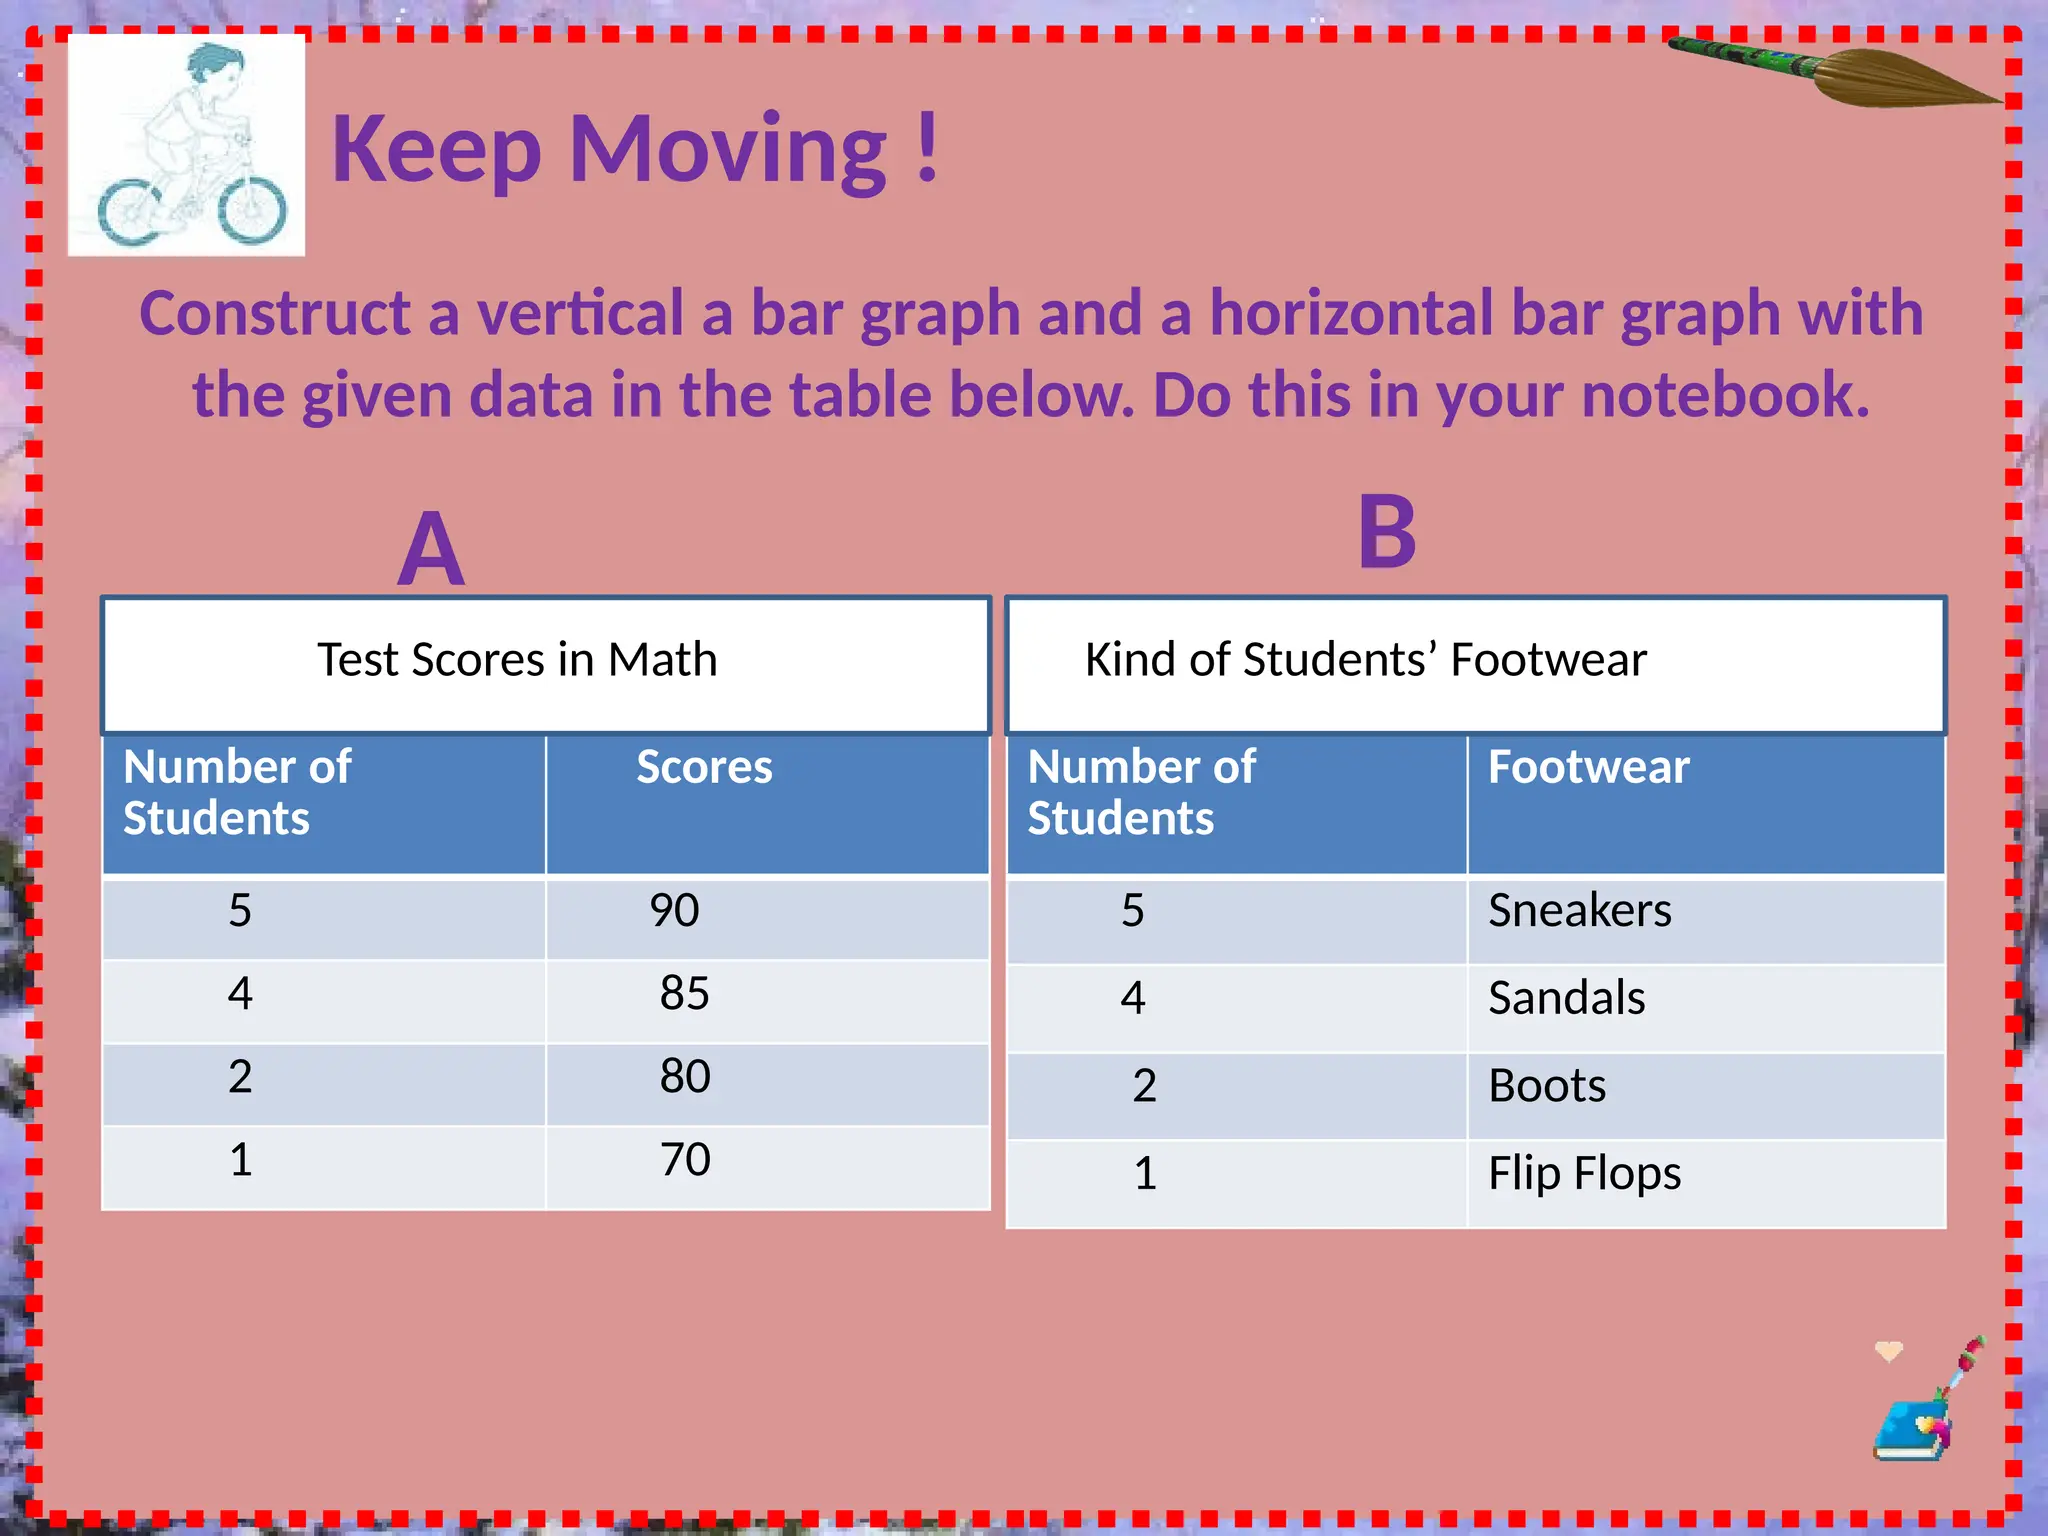
Keep Moving !
Constructa vertical a bar graph and a horizontal bar graph with
the given data in the table below. Do this in your notebook.
A
Number of
Students
Scores
5 90
4 85
2 80
1 70
Test Scores in Math
B
Number of
Students
Footwear
5 Sneakers
4 Sandals
2 Boots
1 Flip Flops
Kind of Students’ Footwear
14.
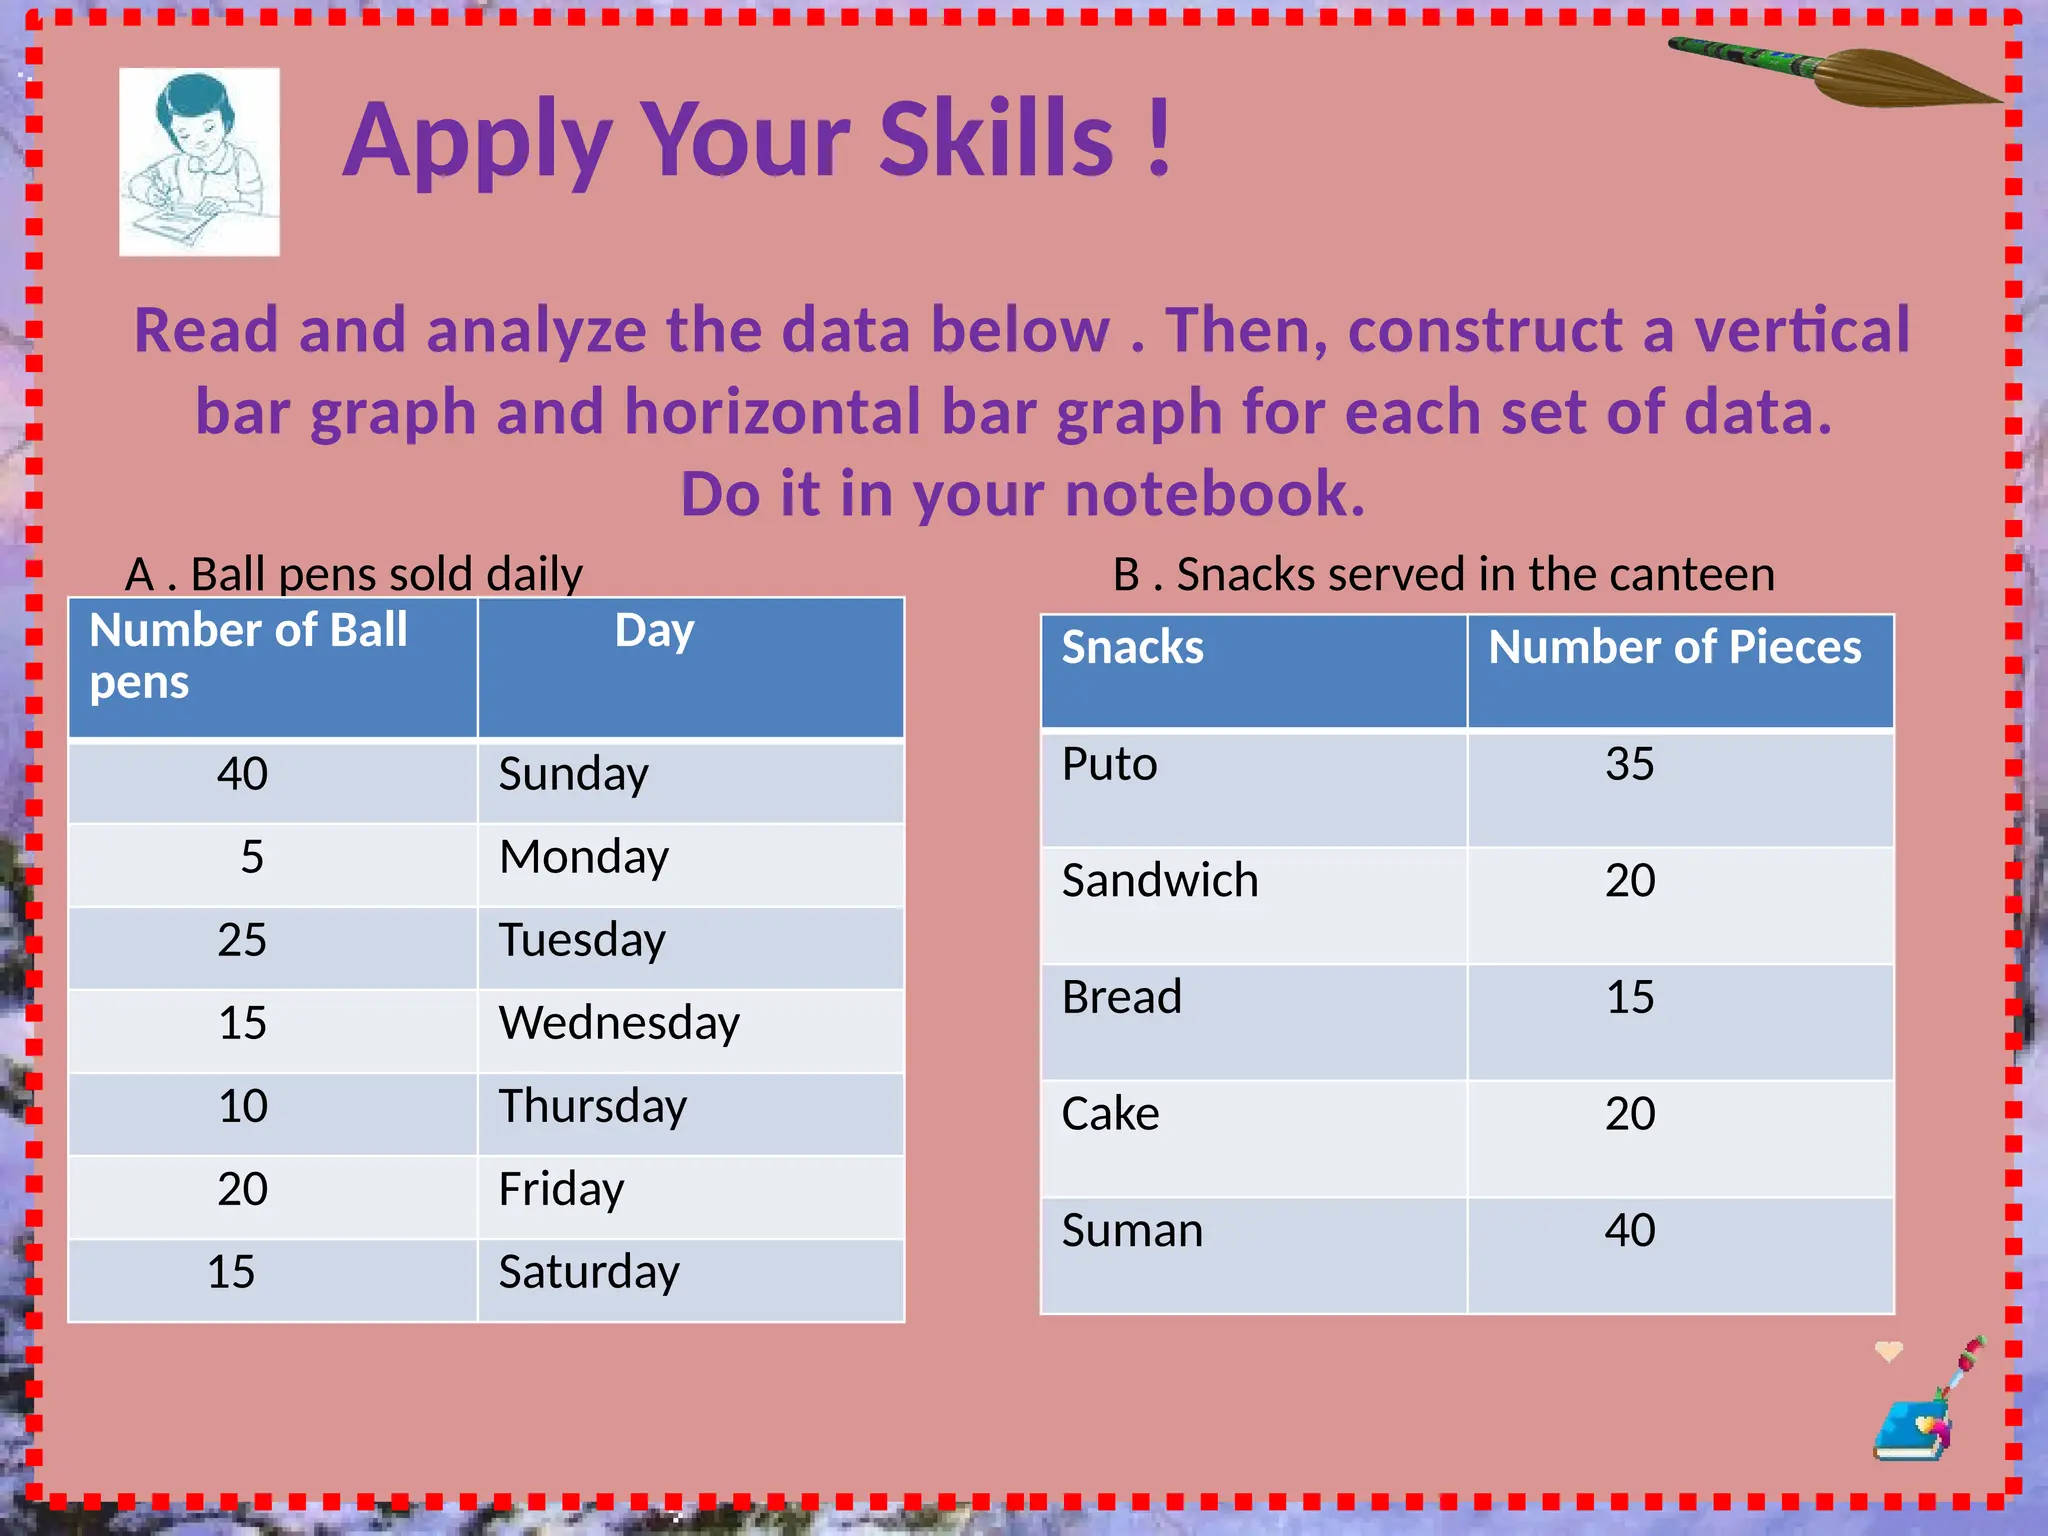
Apply Your Skills!
Read and analyze the data below . Then, construct a vertical
bar graph and horizontal bar graph for each set of data.
Do it in your notebook.
A . Ball pens sold daily
Number of Ball
pens
Day
40 Sunday
5 Monday
25 Tuesday
15 Wednesday
10 Thursday
20 Friday
15 Saturday
B . Snacks served in the canteen
Snacks Number of Pieces
Puto 35
Sandwich 20
Bread 15
Cake 20
Suman 40
15.
F
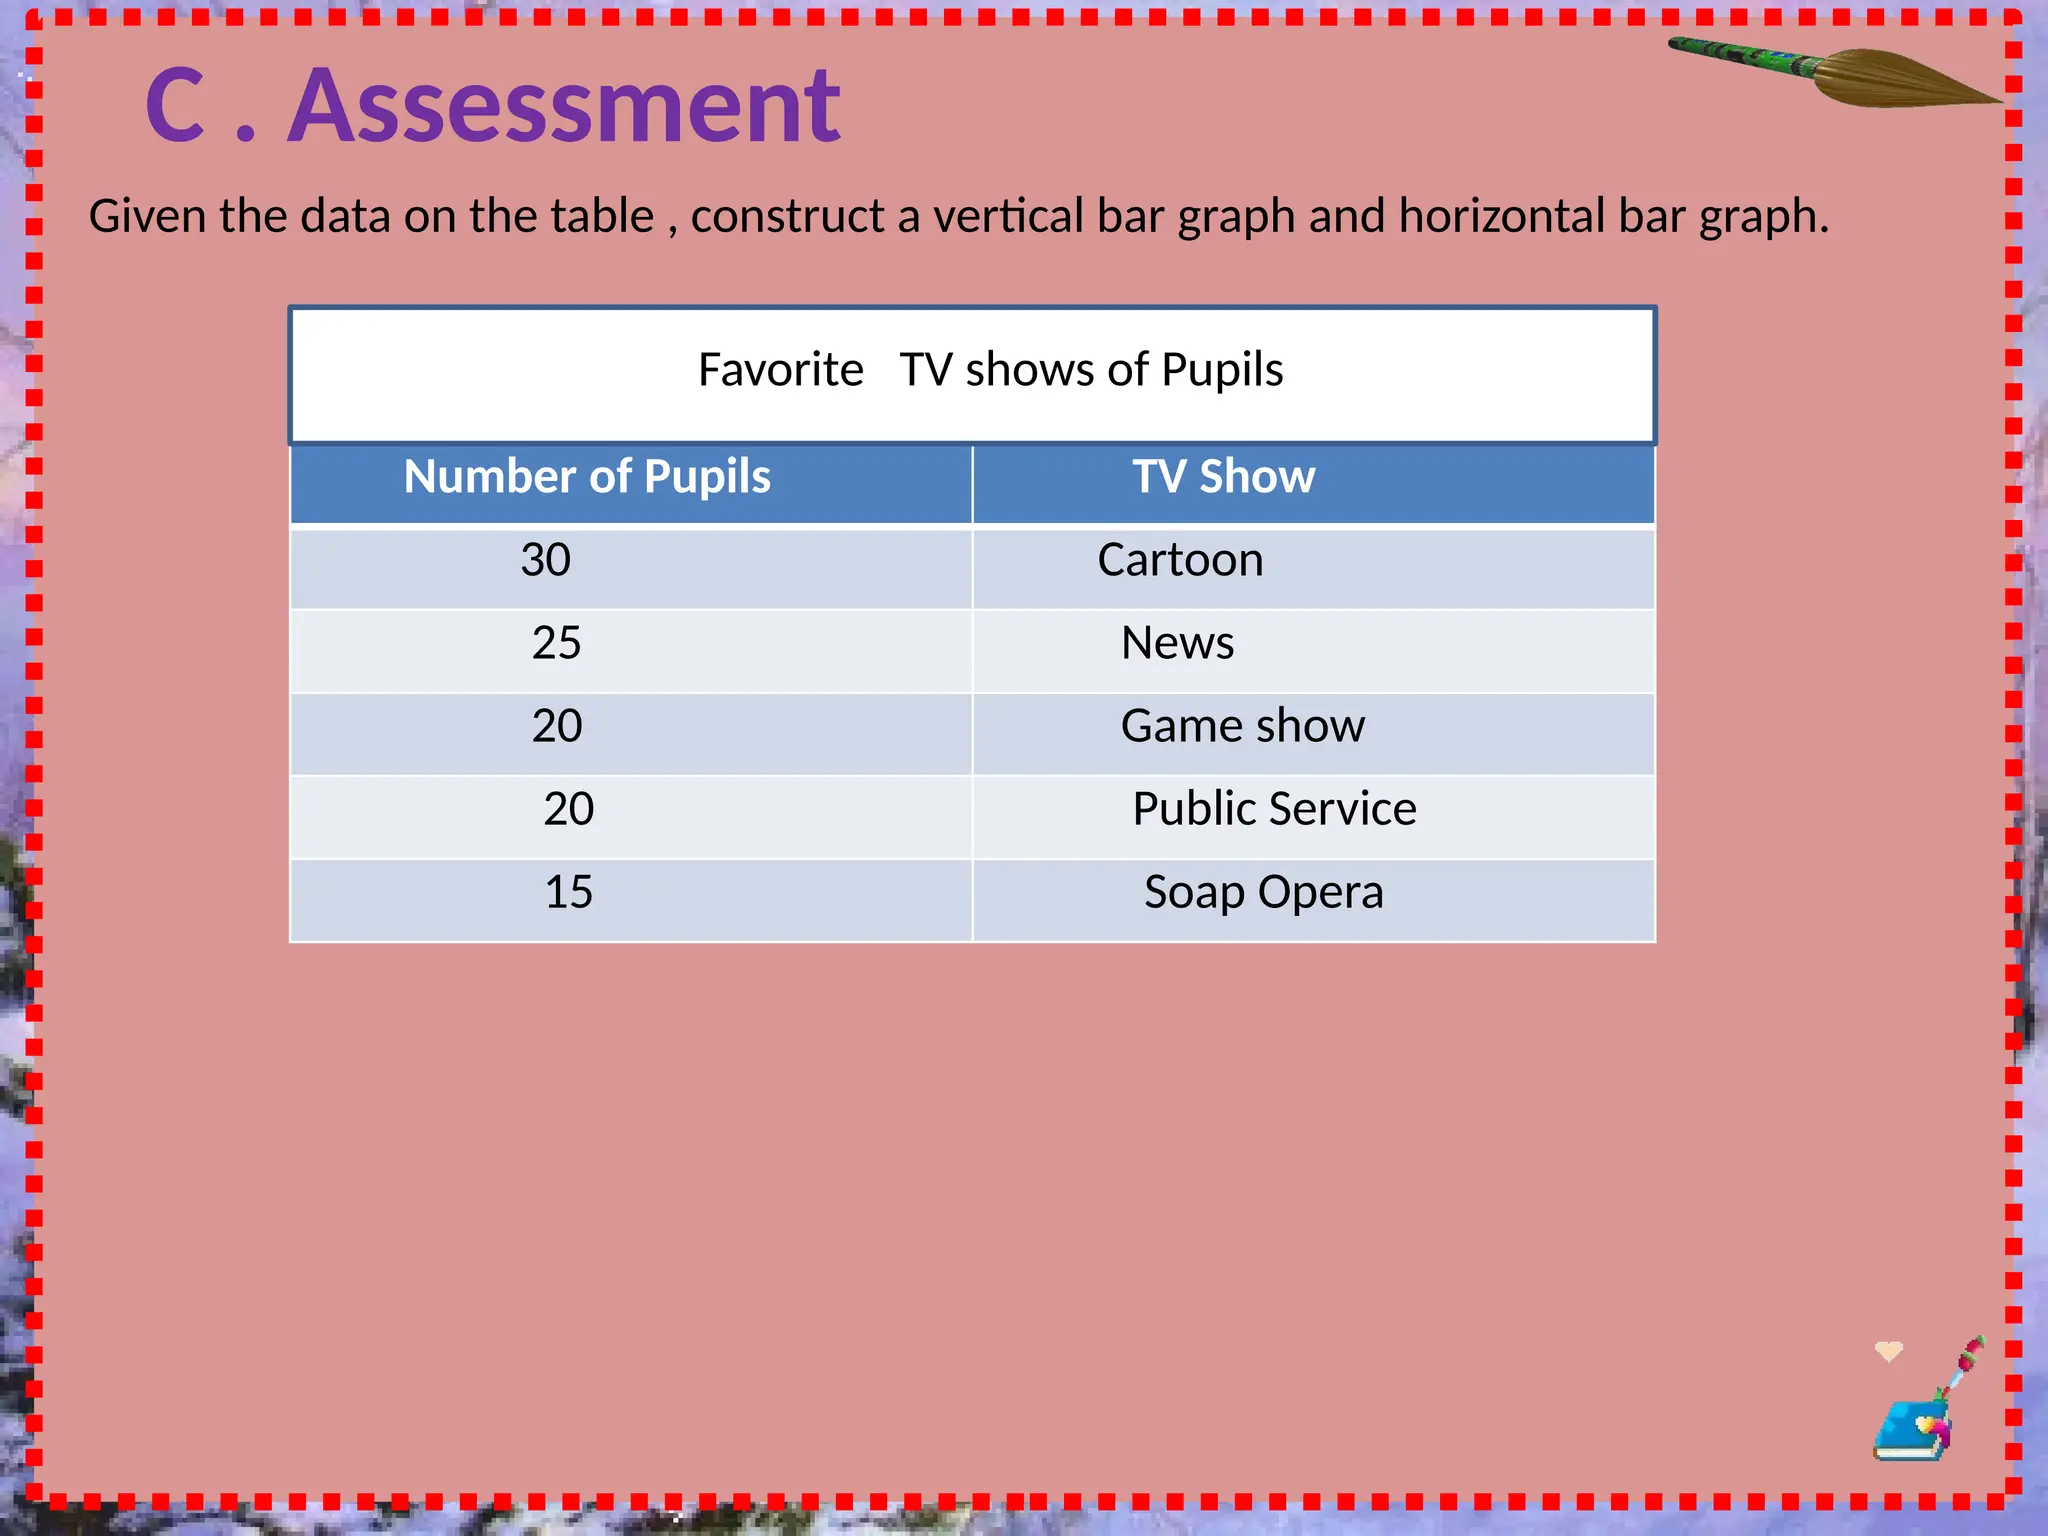
C . Assessment
Giventhe data on the table , construct a vertical bar graph and horizontal bar graph.
Number of Pupils TV Show
30 Cartoon
25 News
20 Game show
20 Public Service
15 Soap Opera
Favorite TV shows of Pupils
16.
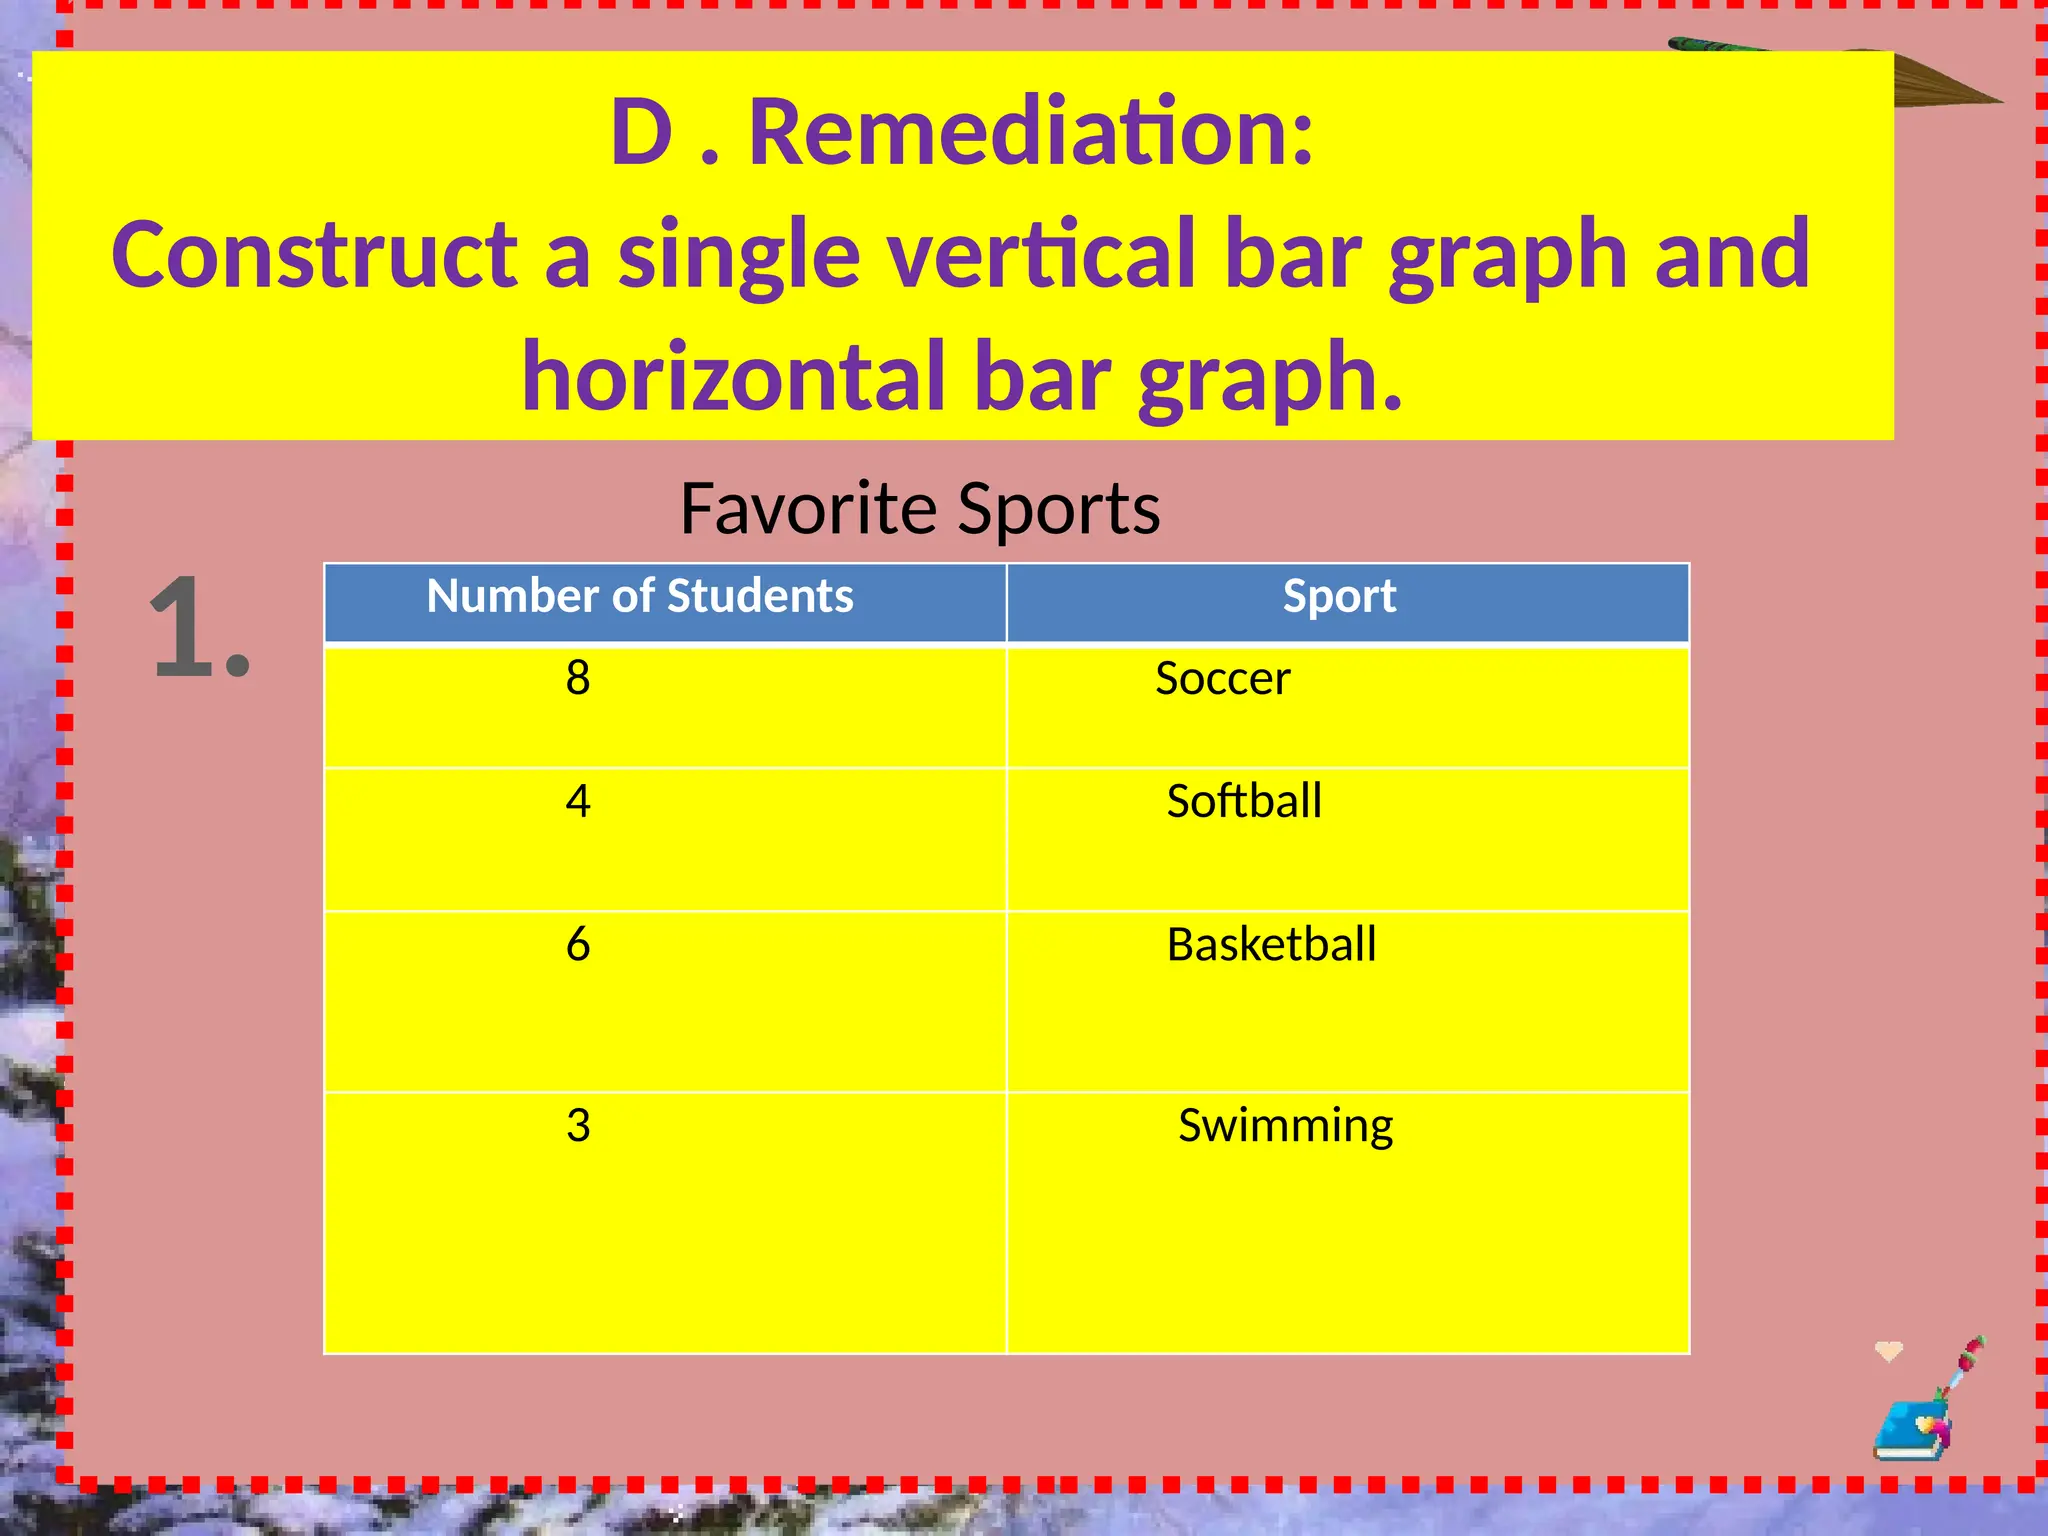
D . Remediation:
Constructa single vertical bar graph and
horizontal bar graph.
Number of Students Sport
8 Soccer
4 Softball
6 Basketball
3 Swimming
Favorite Sports
1.
17.
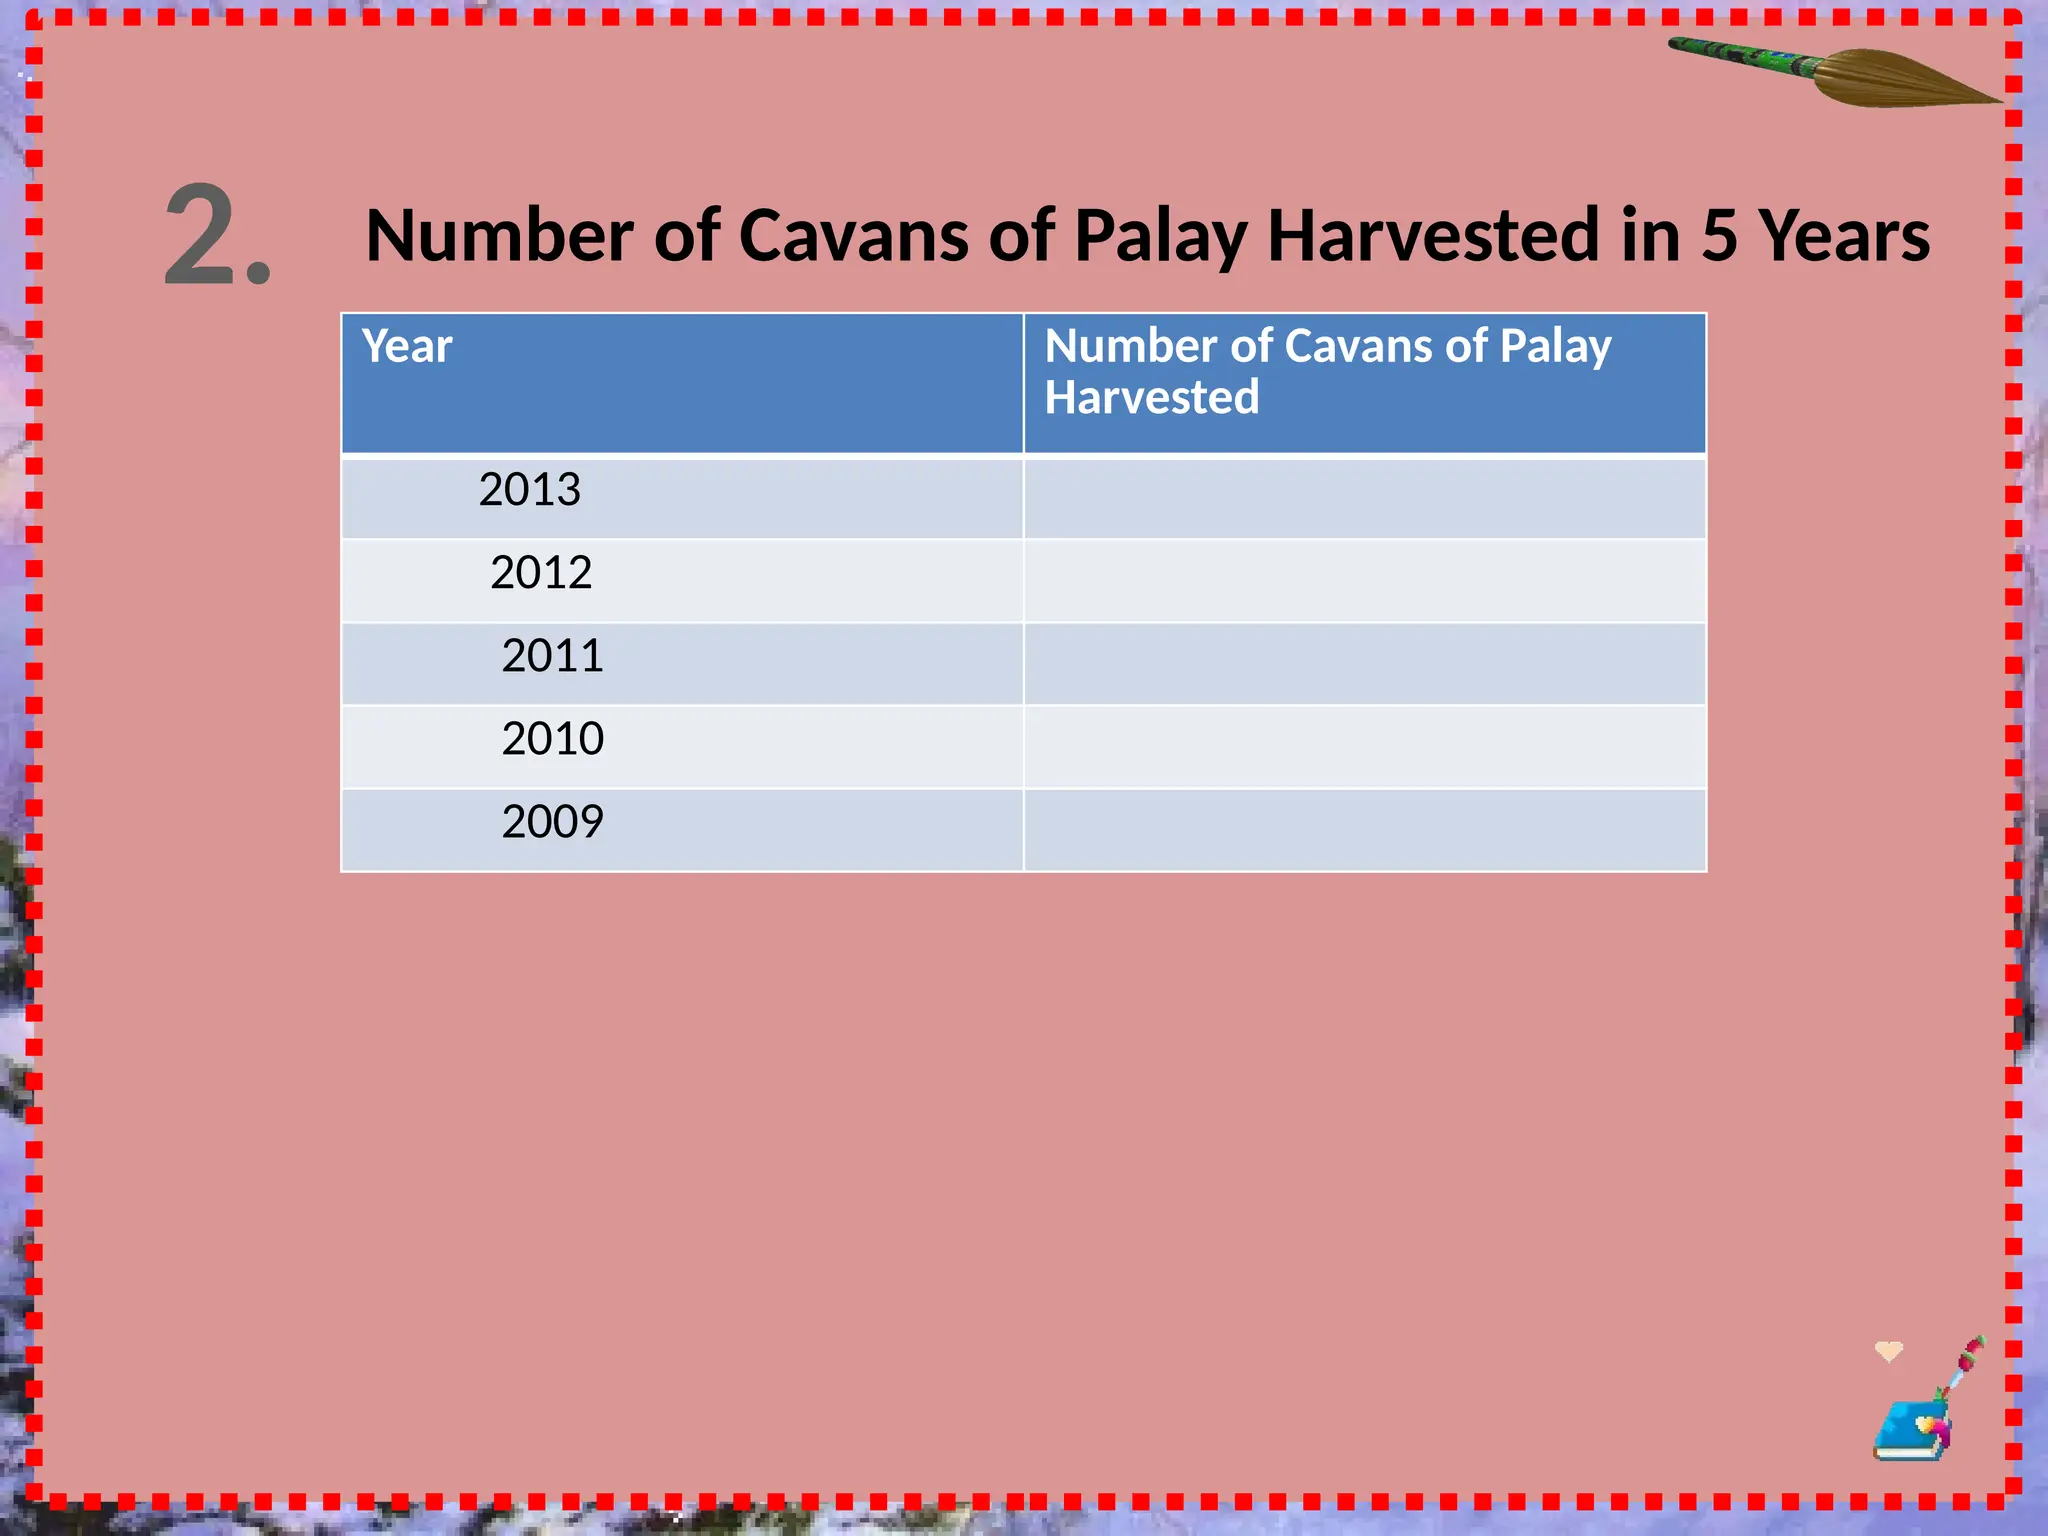
2.
Year Number ofCavans of Palay
Harvested
2013
2012
2011
2010
2009
Number of Cavans of Palay Harvested in 5 Years
18.
THANK YOU SOMUCH !!
Mrs.Marvie T. Blanco
Urdaneta I Central School
Urdaneta City,Pangasinan


![2. Performing the Activities : Team work[4 groups]
Present the given data into a graph . NOTE:Tables A and B are vertical
bar graphs . Tables C and D are horizontal bar graphs.]
Color No.of pupils who
prefer the color
Blue 25
Red 5
Orange 10
Pink 10
Yellow 20
Food Price
Chopsuey Php 35.00
Kaldereta Php 20.00
Kare-Kare Php 15.00
Adobo Php 35.00
Fried Chicken Php 25.00
Table A Table B
Favorite Color
Price of Food](https://image.slidesharecdn.com/constructingsingleverticalandhorizontalbargraphs-251209004646-7bdc2f43/75/Constructing-Single-Vertical-and-Horizontal-Bar-Graphs-pptx-7-2048.jpg)