Downloaded 15 times


![Some acceptance criteria for verification checks
Chemistry Centre, Qld, Australia
Check Acceptance Criteria
Instrument QC ICPOES
- two monthly repeatability check
- two monthly limit of quantitation
check
- fortnightly check of sensitivity
- %RSD < 5%
- <50% change from month to
month
- if >30% change in sensitivity
of any one analyte
investigate causes.
Ion chromatograph
- repeatability check
- monitoring of system pressure, total
conductivity & retention time
- %RSD < 5%
- Retention Time ± 1 min
Calibration of
Instrument
Most instruments R2 > 0.99
Old vs new
standards
Normal concentration
Ultra-trace concentrations
< 3% at mid-range (25%-70% of
calibration range)
< 10% at mid-range (25%-70% of
calibration range)
Blanks < 2 times PQL
Duplicates (of
full method)
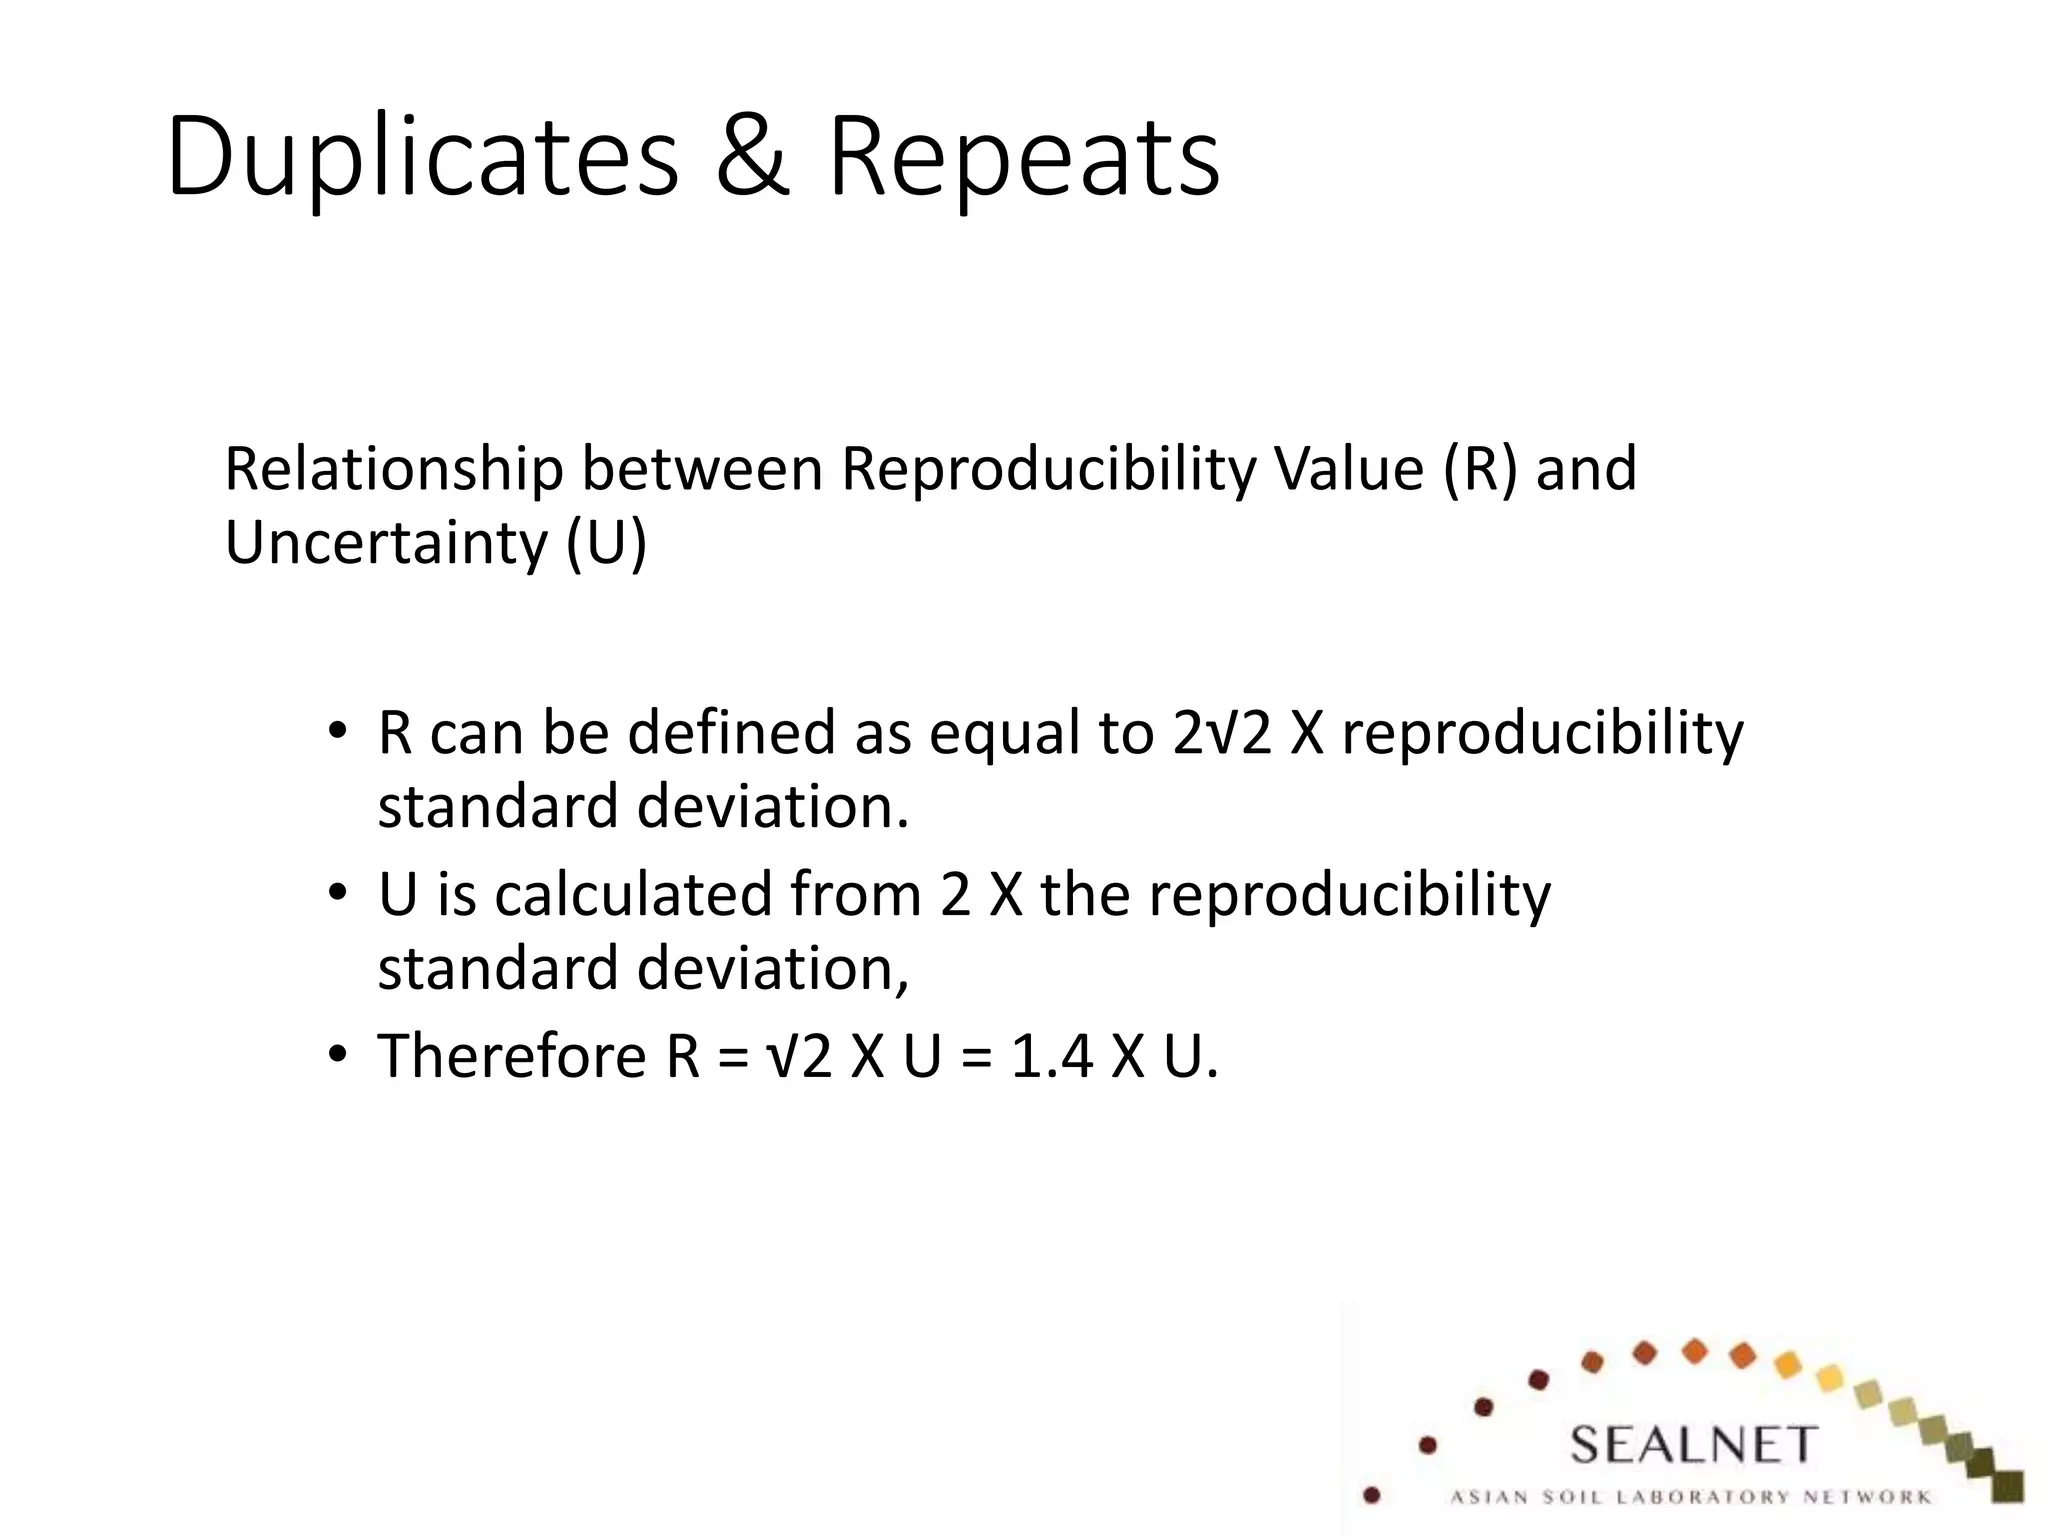
Minimum frequency = 1 in 20 - Difference < uncertainty (same run)
- Difference < 1.4 times x uncertainty
(different runs)
Recovery Spikes %Recovery at ultra-trace concentrations
= [Spiked Conc–Sample Conc] x 100
Spiked Conc
100% ± 20%](https://image.slidesharecdn.com/laboratoryqaqcday2presentation1-200703114327/75/4th-SEALNET-meeting-item-8-Training-on-internal-quality-control-Overview-of-internal-quality-control-measures-18-2048.jpg)

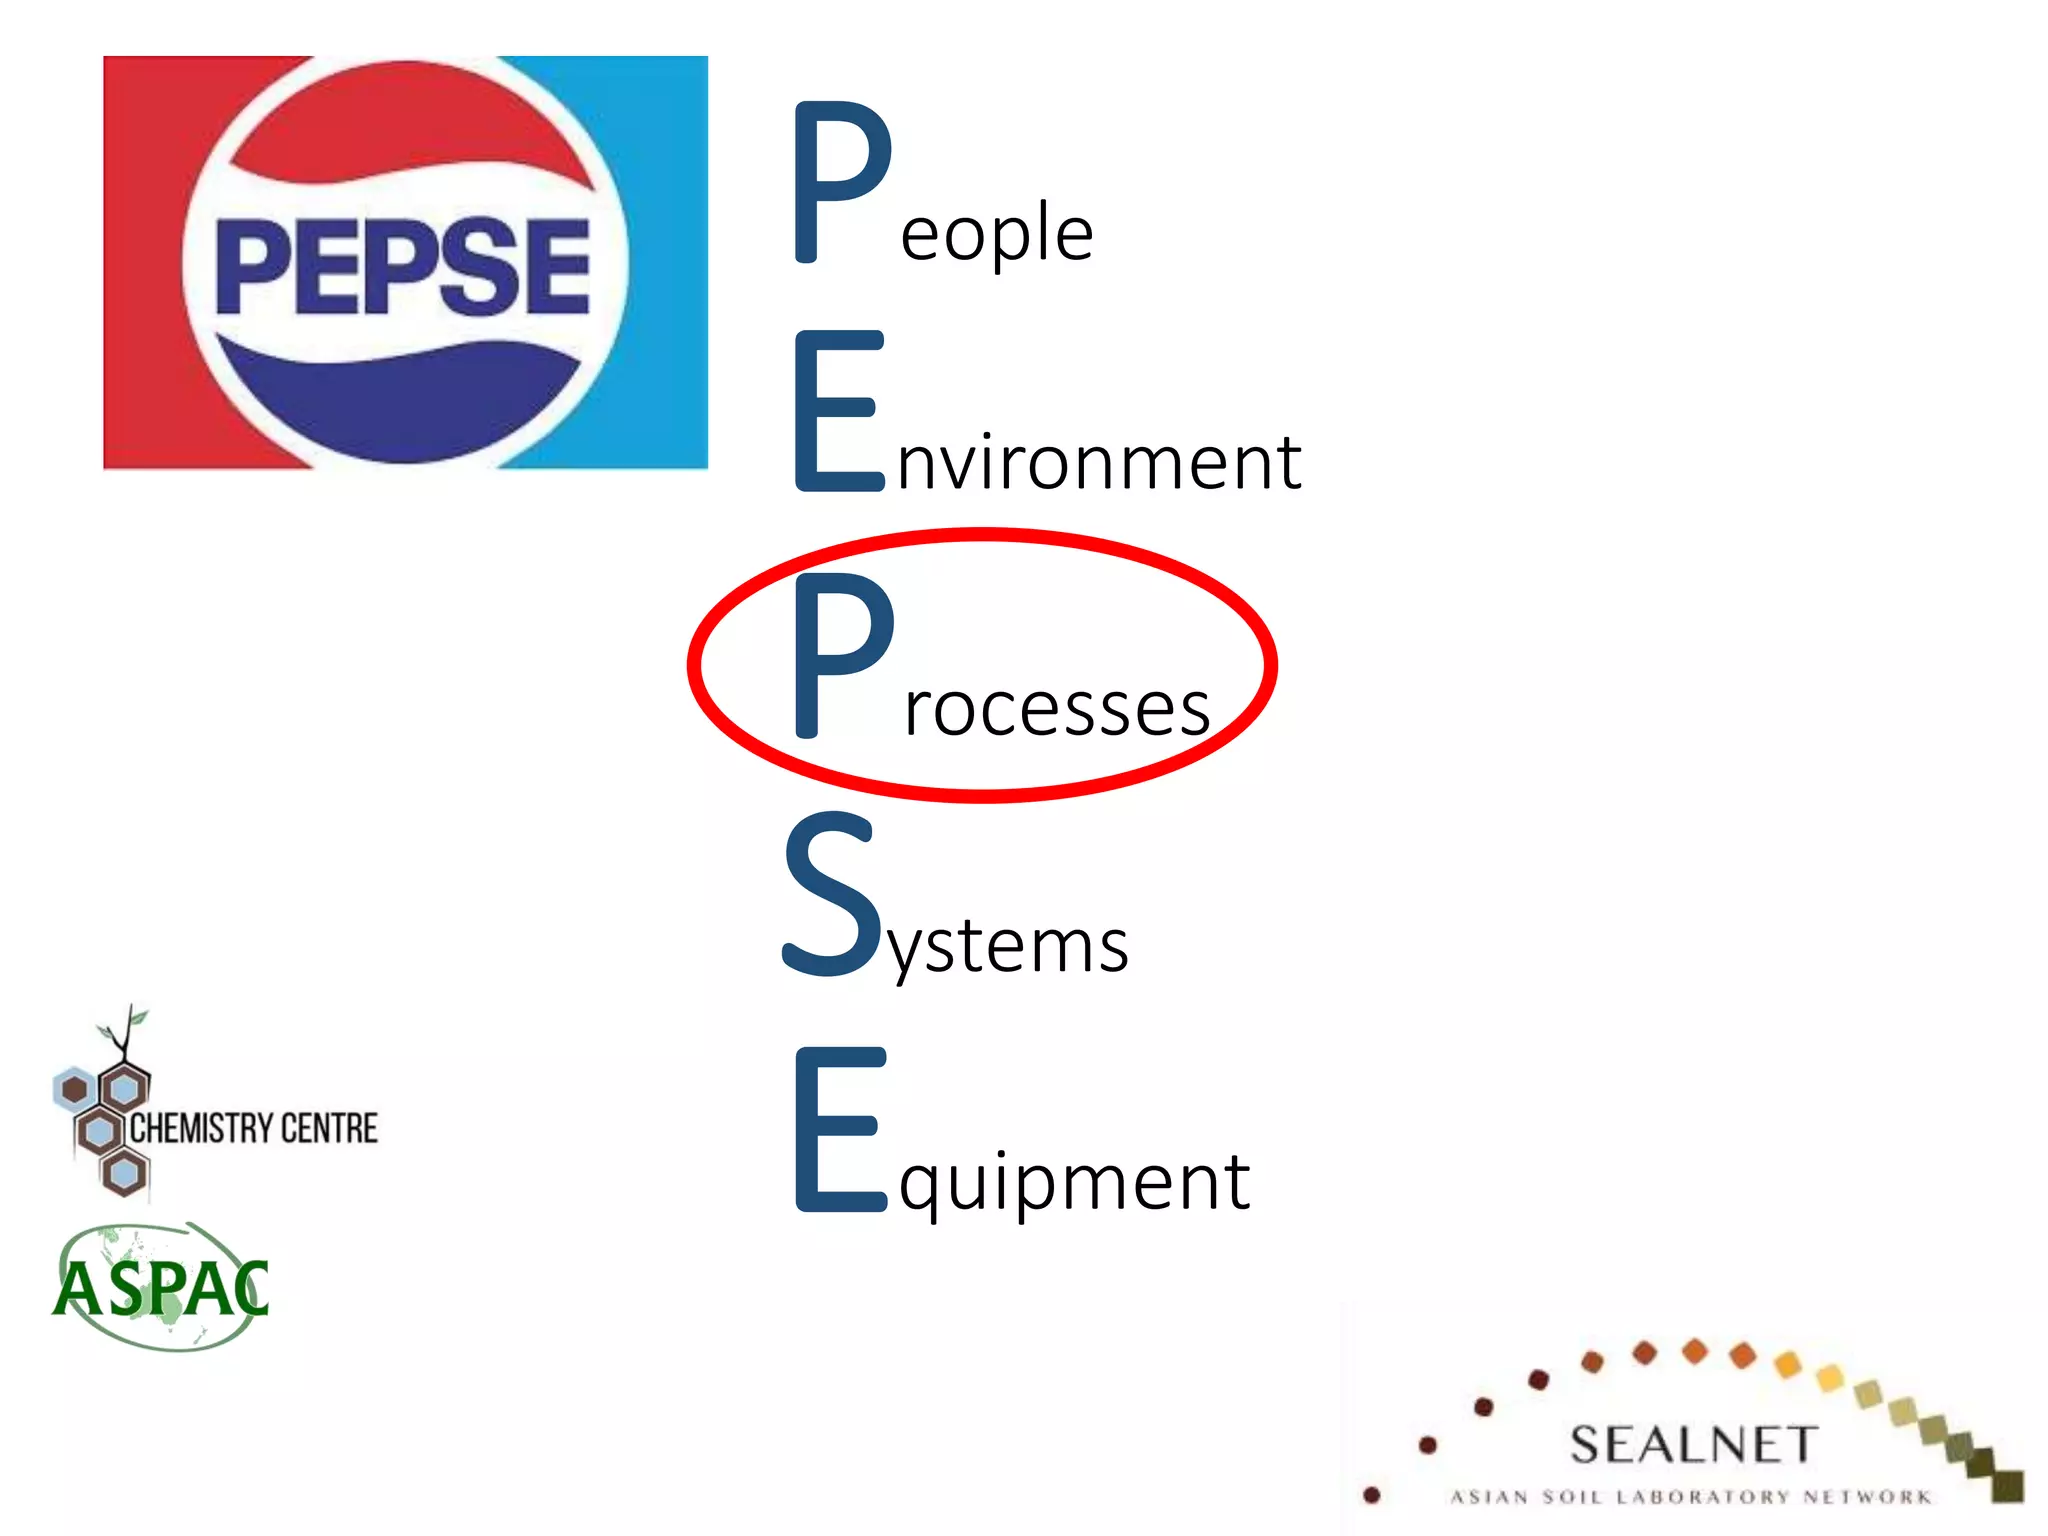
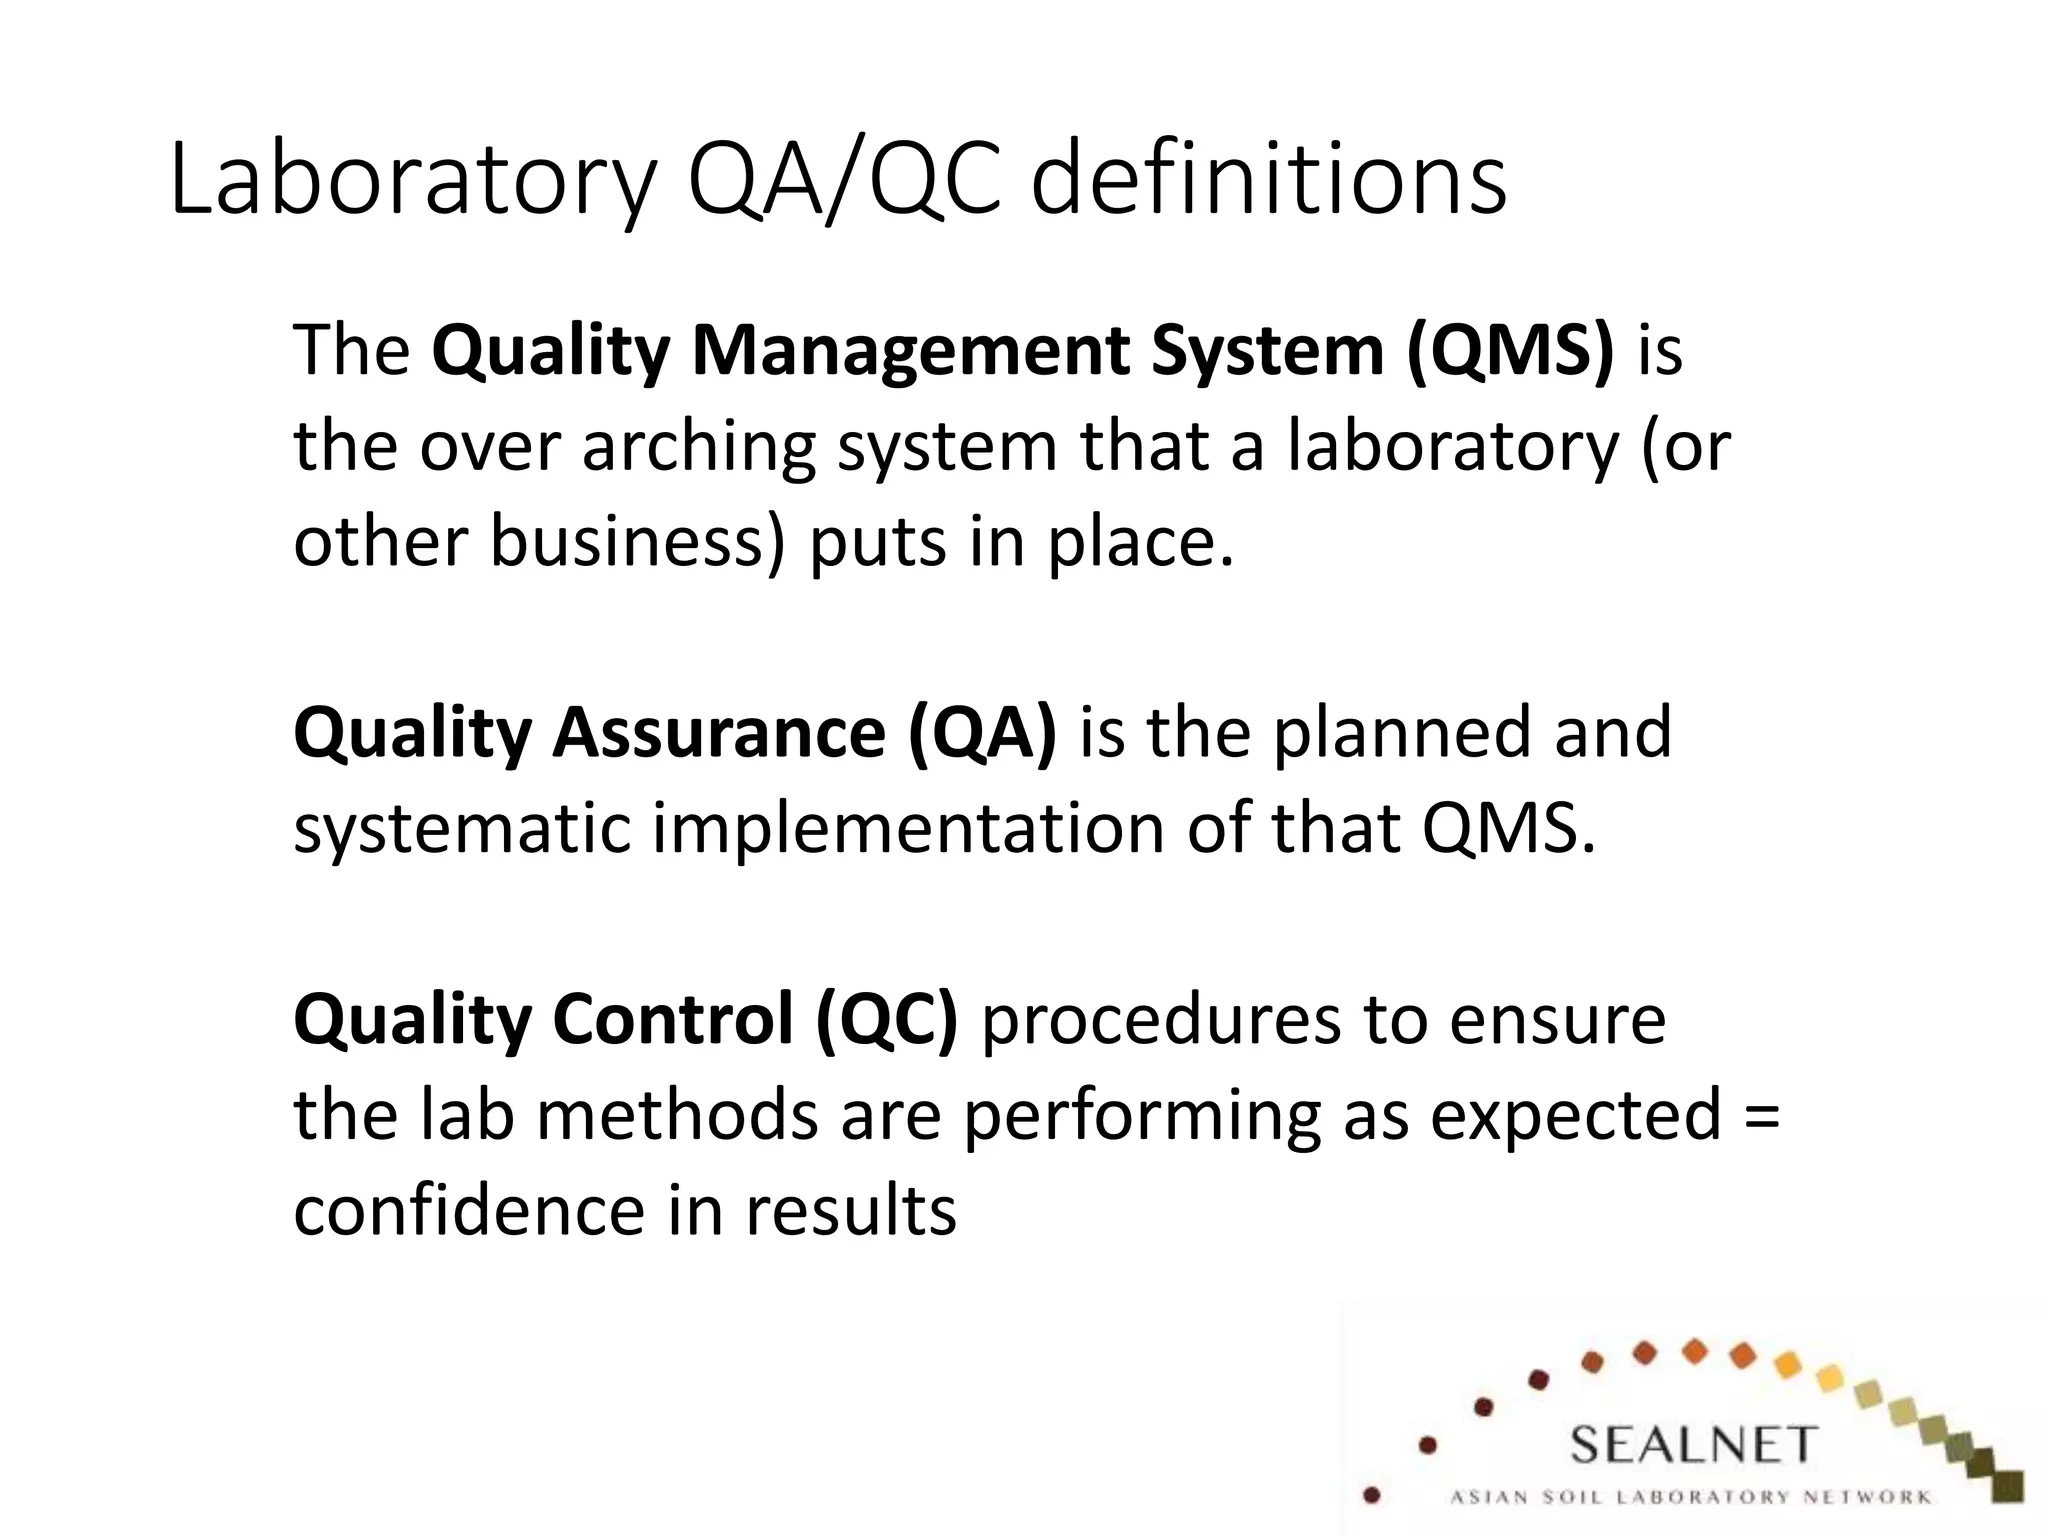
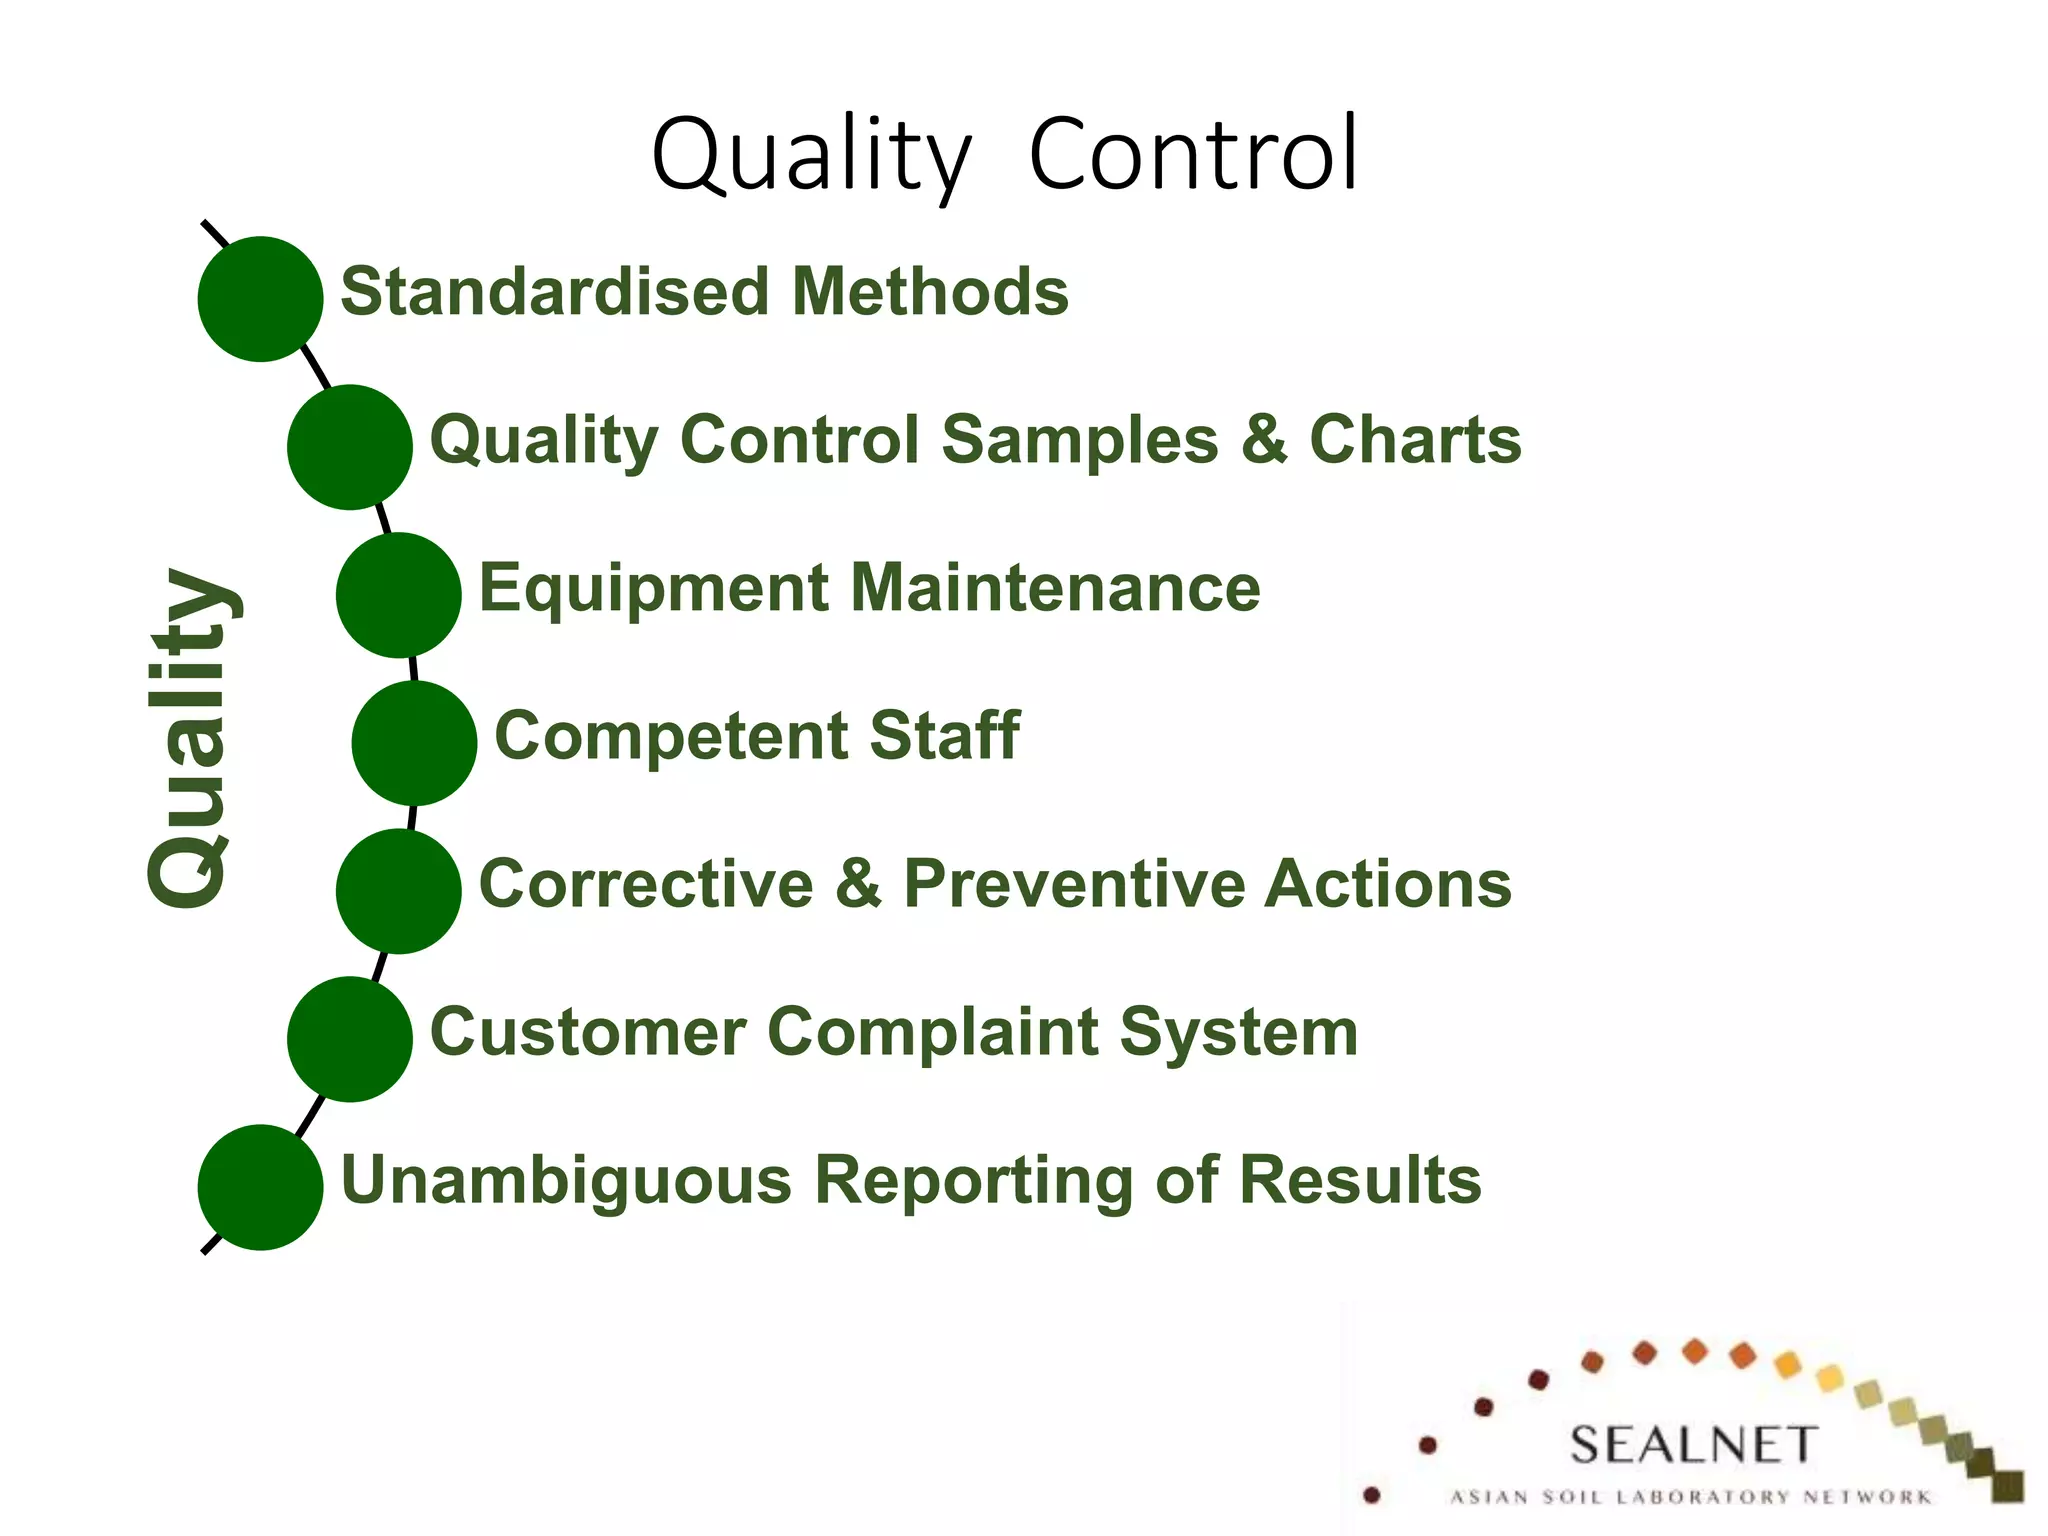
The document outlines the Quality Management System (QMS) and Quality Assurance/Quality Control (QA/QC) procedures in laboratories, specifically focusing on agricultural testing. It details various QC tools and methodologies, including the use of standards, duplicates, and recovery spikes to ensure the accuracy and reliability of test results. Additionally, it emphasizes the importance of ongoing calibration, reference materials, and adherence to acceptance criteria for effective laboratory performance.


