Download to read offline


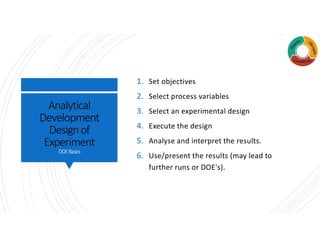


The document outlines analytical development and design of experiments (DOE) focusing on optimization in pharmaceutical processes. It covers DOE basics, selection of experimental designs, and provides examples of applying these methods including ANOVA analysis. The content emphasizes systematic approaches for understanding product interactions and outcomes in analytical laboratories.