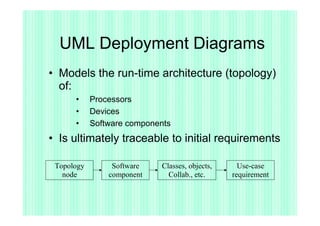
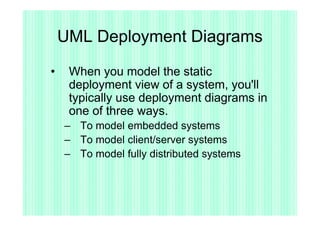
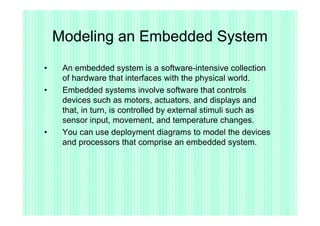
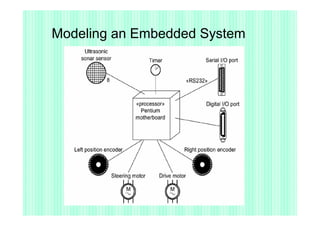
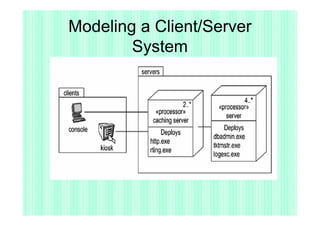
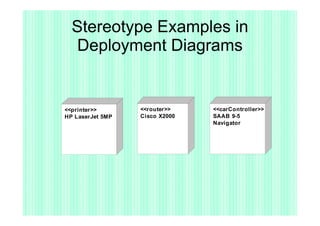
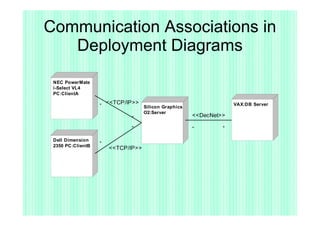
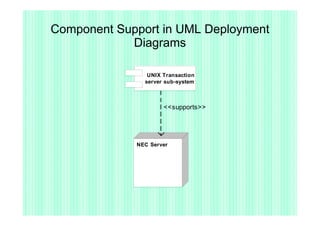
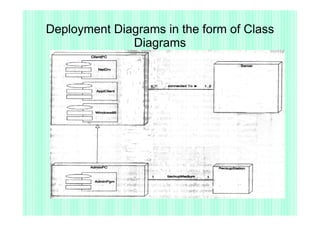
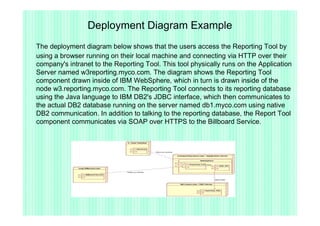
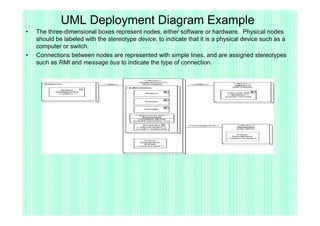
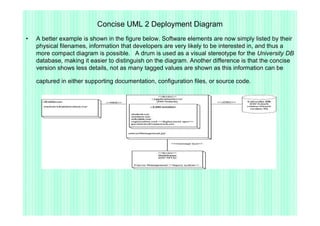
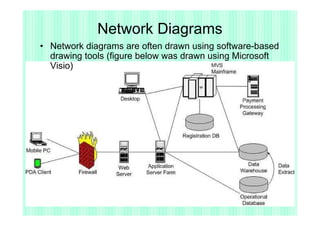
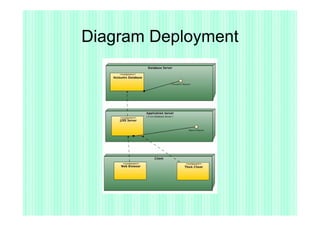
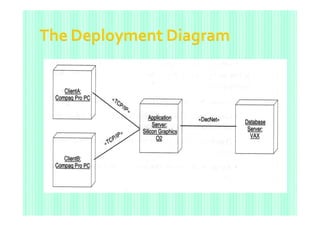
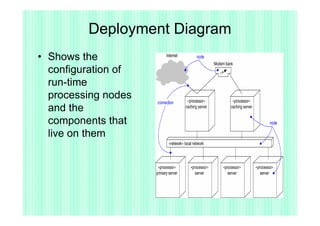
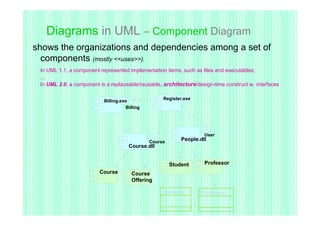
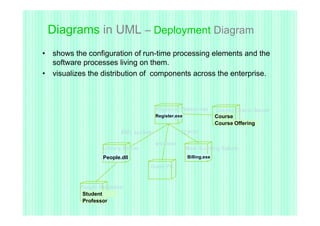
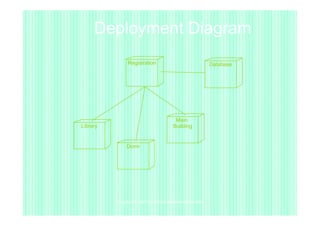
BAB XII
Deployment Diagram
Deployment/physical diagram
menggambarkan detail bagaimana komponen
di-deploy dalam infrastruktur sistem, dimana
komponen akan terletak (pada mesin, server
atau piranti keras apa), bagaimana kemampuan
jaringan pada lokasi tersebut, spesifikasi server,
dan hal-hal lain yang bersifat fisikal.
Sebuah node adalah server, workstation atau
piranti keras lain yang digunakan untuk men-
deploy komponen dalam lingkungan
sebenarnya.
- Bersifat statis
- Memperlihatkan konfigurasi saat aplikasi
  dijalankan (saat runtime).
- Memuat node beserta komponen-
  komponen yang ada didalamnya
- Berhubungan dengan diagram komponen
  dimana deployment diagram memuat satu
  atau lebih komponen-komponen
UML Deployment Diagrams
• Models the run-time architecture (topology)
  of:
      •     Processors
      •     Devices
      •     Software components
• Is ultimately traceable to initial requirements

 Topology        Software   Classes, objects,     Use-case
   node         component     Collab., etc.     requirement
UML Deployment Diagrams

•    When you model the static
     deployment view of a system, you'll
     typically use deployment diagrams in
     one of three ways.
    – To model embedded systems
    – To model client/server systems
    – To model fully distributed systems
Modeling an Embedded System
•    An embedded system is a software-intensive collection
     of hardware that interfaces with the physical world.
•    Embedded systems involve software that controls
     devices such as motors, actuators, and displays and
     that, in turn, is controlled by external stimuli such as
     sensor input, movement, and temperature changes.
•    You can use deployment diagrams to model the devices
     and processors that comprise an embedded system.
Modeling an Embedded System
•   To model an embedded system
    –   Identify the devices and nodes that are unique to
        your system
    –   Provide visual cues, especially for unusual devices,
        by using the UML's extensibility mechanisms to
        define system-specific stereotypes with appropriate
        icons
    –   Model the relationships among these processors
        and devices in a deployment diagram.
Modeling an Embedded System
Modeling a Client/Server System

•   A client/server system is a common
    architecture focused on making a clear
    separation of concerns between the
    system's user interface (which lives on
    the client) and the system's persistent
    data (which lives on the server).
Modeling a Client/Server System
•   To model a client/server system,
    –   Identify the nodes that represent your
        system's client and server processors
    –   Highlight those devices that are germane to
        the behavior of your system
    –   Provide visual cues for these processors and
        devices via stereotyping.
    –   Model the topology of these nodes in a
        deployment diagram
Modeling a Client/Server
        System
Modeling a Fully Distributed
                 System
•   To model a fully distributed system
    –   Identify the system's devices and processors as
        for simpler client/server systems
    –   Pay close attention to logical groupings of
        nodes, which you can specify by using
        packages
    –   Model these devices and processors using
        deployment diagrams
Modeling a Fully Distributed System
Stereotype Examples in
  Deployment Diagrams


<<printer>>       <<router>>    <<carController>>
HP LaserJet 5MP   Cisco X2000   SAAB 9-5
                                Navigator
Communication Associations in
   Deployment Diagrams
 NEC PowerMate
 i-Select VL4
 PC:ClientA

                   *
                       <<TCP/IP>>                                   VAX:DB Server
                                    Silicon Graphics
                                    O2:Server
                              *                        <<DecNet>>

                              *                        *        *

 Dell Dimension
                   *
 2350 PC:ClientB
                       <<TCP/IP>>
Component Support in UML Deployment
            Diagrams

                UNIX Transaction
               server sub-system


                     <<supports>>


             NEC Server
Deployment Diagrams in the form of Class
              Diagrams
Deployment Diagram Example
The deployment diagram below shows that the users access the Reporting Tool by
using a browser running on their local machine and connecting via HTTP over their
company's intranet to the Reporting Tool. This tool physically runs on the Application
Server named w3reporting.myco.com. The diagram shows the Reporting Tool
component drawn inside of IBM WebSphere, which in turn is drawn inside of the
node w3.reporting.myco.com. The Reporting Tool connects to its reporting database
using the Java language to IBM DB2's JDBC interface, which then communicates to
the actual DB2 database running on the server named db1.myco.com using native
DB2 communication. In addition to talking to the reporting database, the Report Tool
component communicates via SOAP over HTTPS to the Billboard Service.
UML Deployment Diagram Example
•   The three-dimensional boxes represent nodes, either software or hardware. Physical nodes
    should be labeled with the stereotype device, to indicate that it is a physical device such as a
    computer or switch.
•   Connections between nodes are represented with simple lines, and are assigned stereotypes
    such as RMI and message bus to indicate the type of connection.
Concise UML 2 Deployment Diagram
•   A better example is shown in the figure below. Software elements are now simply listed by their
    physical filenames, information that developers are very likely to be interested in, and thus a
    more compact diagram is possible. A drum is used as a visual stereotype for the University DB
    database, making it easier to distinguish on the diagram. Another difference is that the concise
    version shows less details, not as many tagged values are shown as this information can be

    captured in either supporting documentation, configuration files, or source code.
Network Diagrams
• Network diagrams are often drawn using software-based
  drawing tools (figure below was drawn using Microsoft
  Visio)
Diagram Deployment
Deployment Diagram
• Shows the
  configuration of
  run-time
  processing nodes
  and the
  components that
  live on them
Diagrams in UML – Component Diagram
shows the organizations and dependencies among a set of
  components (mostly <<uses>>).
 In UML 1.1, a component represented implementation items, such as files and executables;
 …
 In UML 2.0, a component is a replaceable/reusable, architecture/design-time construct w. interfaces


                           Billing.exe              Register.exe
                                     Billing


                                                                     User
                                               Course
                                                            People.dll
                                      Course.dll


                                                        Student      Professor
                         Course         Course
                                        Offering

                                                    Student         Professor
Diagrams in UML – Deployment Diagram
• shows the configuration of run-time processing elements and the
  software processes living on them.
• visualizes the distribution of components across the enterprise.


                                        Registrar Webserver          Course Oracle Server
                                        Register.exe                 Course
                                                                     Course Offering
                         RMI, sockets              TCP/IP

                                        wireless
                  Library Server                       Main Building Solaris
                  People.dll                           Billing.exe

                                   Dorm PC


          People Database
           Student
           Professor
Deployment Diagram
                Registration                                  Database


                                           Main
Library                                   Building


               Dorm


          Copyright © 1997 by Rational Software Corporation
Bab 12 deployment diagram 2010

Bab 12 deployment diagram 2010

  • 1.
  • 2.
    Deployment/physical diagram menggambarkan detailbagaimana komponen di-deploy dalam infrastruktur sistem, dimana komponen akan terletak (pada mesin, server atau piranti keras apa), bagaimana kemampuan jaringan pada lokasi tersebut, spesifikasi server, dan hal-hal lain yang bersifat fisikal. Sebuah node adalah server, workstation atau piranti keras lain yang digunakan untuk men- deploy komponen dalam lingkungan sebenarnya.
  • 3.
    - Bersifat statis -Memperlihatkan konfigurasi saat aplikasi dijalankan (saat runtime). - Memuat node beserta komponen- komponen yang ada didalamnya - Berhubungan dengan diagram komponen dimana deployment diagram memuat satu atau lebih komponen-komponen
  • 4.
    UML Deployment Diagrams •Models the run-time architecture (topology) of: • Processors • Devices • Software components • Is ultimately traceable to initial requirements Topology Software Classes, objects, Use-case node component Collab., etc. requirement
  • 5.
    UML Deployment Diagrams • When you model the static deployment view of a system, you'll typically use deployment diagrams in one of three ways. – To model embedded systems – To model client/server systems – To model fully distributed systems
  • 6.
    Modeling an EmbeddedSystem • An embedded system is a software-intensive collection of hardware that interfaces with the physical world. • Embedded systems involve software that controls devices such as motors, actuators, and displays and that, in turn, is controlled by external stimuli such as sensor input, movement, and temperature changes. • You can use deployment diagrams to model the devices and processors that comprise an embedded system.
  • 7.
    Modeling an EmbeddedSystem • To model an embedded system – Identify the devices and nodes that are unique to your system – Provide visual cues, especially for unusual devices, by using the UML's extensibility mechanisms to define system-specific stereotypes with appropriate icons – Model the relationships among these processors and devices in a deployment diagram.
  • 8.
  • 9.
    Modeling a Client/ServerSystem • A client/server system is a common architecture focused on making a clear separation of concerns between the system's user interface (which lives on the client) and the system's persistent data (which lives on the server).
  • 10.
    Modeling a Client/ServerSystem • To model a client/server system, – Identify the nodes that represent your system's client and server processors – Highlight those devices that are germane to the behavior of your system – Provide visual cues for these processors and devices via stereotyping. – Model the topology of these nodes in a deployment diagram
  • 11.
  • 12.
    Modeling a FullyDistributed System • To model a fully distributed system – Identify the system's devices and processors as for simpler client/server systems – Pay close attention to logical groupings of nodes, which you can specify by using packages – Model these devices and processors using deployment diagrams
  • 13.
    Modeling a FullyDistributed System
  • 14.
    Stereotype Examples in Deployment Diagrams <<printer>> <<router>> <<carController>> HP LaserJet 5MP Cisco X2000 SAAB 9-5 Navigator
  • 15.
    Communication Associations in Deployment Diagrams NEC PowerMate i-Select VL4 PC:ClientA * <<TCP/IP>> VAX:DB Server Silicon Graphics O2:Server * <<DecNet>> * * * Dell Dimension * 2350 PC:ClientB <<TCP/IP>>
  • 16.
    Component Support inUML Deployment Diagrams UNIX Transaction server sub-system <<supports>> NEC Server
  • 17.
    Deployment Diagrams inthe form of Class Diagrams
  • 18.
    Deployment Diagram Example Thedeployment diagram below shows that the users access the Reporting Tool by using a browser running on their local machine and connecting via HTTP over their company's intranet to the Reporting Tool. This tool physically runs on the Application Server named w3reporting.myco.com. The diagram shows the Reporting Tool component drawn inside of IBM WebSphere, which in turn is drawn inside of the node w3.reporting.myco.com. The Reporting Tool connects to its reporting database using the Java language to IBM DB2's JDBC interface, which then communicates to the actual DB2 database running on the server named db1.myco.com using native DB2 communication. In addition to talking to the reporting database, the Report Tool component communicates via SOAP over HTTPS to the Billboard Service.
  • 19.
    UML Deployment DiagramExample • The three-dimensional boxes represent nodes, either software or hardware. Physical nodes should be labeled with the stereotype device, to indicate that it is a physical device such as a computer or switch. • Connections between nodes are represented with simple lines, and are assigned stereotypes such as RMI and message bus to indicate the type of connection.
  • 20.
    Concise UML 2Deployment Diagram • A better example is shown in the figure below. Software elements are now simply listed by their physical filenames, information that developers are very likely to be interested in, and thus a more compact diagram is possible. A drum is used as a visual stereotype for the University DB database, making it easier to distinguish on the diagram. Another difference is that the concise version shows less details, not as many tagged values are shown as this information can be captured in either supporting documentation, configuration files, or source code.
  • 21.
    Network Diagrams • Networkdiagrams are often drawn using software-based drawing tools (figure below was drawn using Microsoft Visio)
  • 22.
  • 24.
    Deployment Diagram • Showsthe configuration of run-time processing nodes and the components that live on them
  • 25.
    Diagrams in UML– Component Diagram shows the organizations and dependencies among a set of components (mostly <<uses>>). In UML 1.1, a component represented implementation items, such as files and executables; … In UML 2.0, a component is a replaceable/reusable, architecture/design-time construct w. interfaces Billing.exe Register.exe Billing User Course People.dll Course.dll Student Professor Course Course Offering Student Professor
  • 26.
    Diagrams in UML– Deployment Diagram • shows the configuration of run-time processing elements and the software processes living on them. • visualizes the distribution of components across the enterprise. Registrar Webserver Course Oracle Server Register.exe Course Course Offering RMI, sockets TCP/IP wireless Library Server Main Building Solaris People.dll Billing.exe Dorm PC People Database Student Professor
  • 27.
    Deployment Diagram Registration Database Main Library Building Dorm Copyright © 1997 by Rational Software Corporation