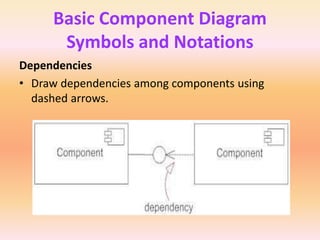
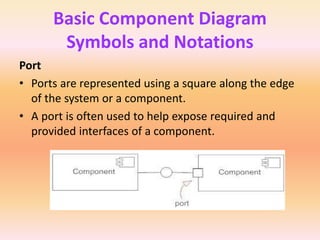
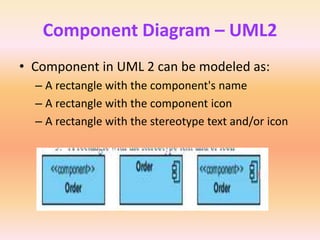
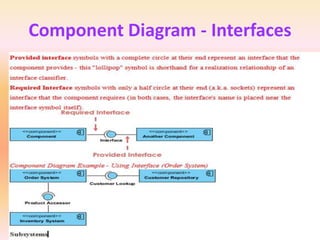
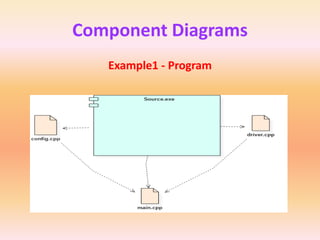
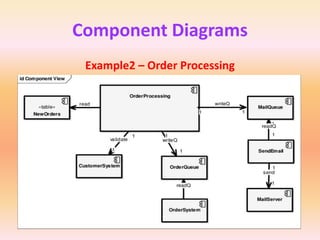
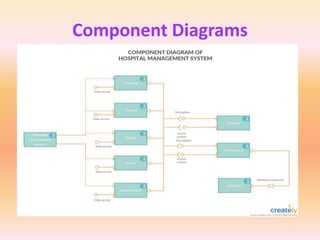
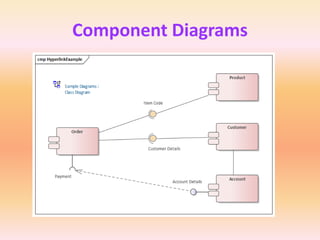
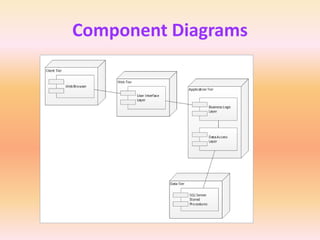
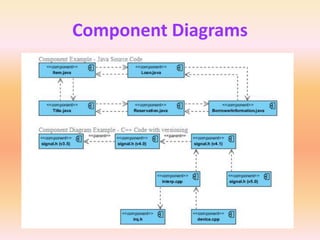
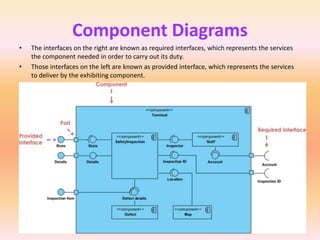
Component Diagram
• A component diagram, also known as a UML
component diagram
• It describes the organization and wiring of the
physical components in a system.
• Component diagrams are often drawn to help
model implementation details and double-
check that every aspect of the system's
required functions is covered by planned
development.
Component Diagram
• In the first version of UML, components included in these
diagrams were physical:
– documents, database table, files, and executables, all physical elements with a
location.
• In the world of UML 2, these components are less physical
and more conceptual stand-alone design elements such as
– a business process that provides or requires interfaces to interact with other
constructs in the system.
• The physical elements described in UML 1, like files and
documents, are now referred in UML2 as artifacts.
• UML 2 component may contain multiple physical artifacts if
they naturally belong together.
Basic Component Diagram Symbols
and Notations
Component
• A component is a logical unit block of the system, a
slightly higher abstraction than classes.
• It is represented as a rectangle with a smaller
rectangle in the upper right corner with tabs or the
word written above the name of the component to
help distinguish it from a class.
Basic Component Diagram
Symbols and Notations
Interface
• An interface (small circle or semi-circle on a stick) describes a
group of operations used (required) or created (provided) by
components.
• A full circle represents an interface created or provided by the
component.
• A semi-circle represents a required interface, like a person's
input.
Basic Component Diagram
Symbols and Notations
Dependencies
• Draw dependencies among components using
dashed arrows.
Basic Component Diagram
Symbols and Notations
Port
• Ports are represented using a square along the edge
of the system or a component.
• A port is often used to help expose required and
provided interfaces of a component.
Component Diagram – UML2
• Component in UML 2 can be modeled as:
– A rectangle with the component's name
– A rectangle with the component icon
– A rectangle with the stereotype text and/or icon
Component Diagram - Interfaces
Purpose of Component Diagrams
• Component diagram does not describe the functionality of
the system but it describes the components used to make
those functionalities.
• Component diagrams are used to visualize the physical
components in a system. These components are libraries,
packages, files, etc.
• Component diagrams can also be described as a static
implementation view of a system. Static implementation
represents the organization of the components at a particular
moment.
• A single component diagram cannot represent the entire
system but a collection of diagrams is used to represent the
whole.
Purpose of Component Diagrams
• The purpose of the component diagram can be
summarized as −
– Visualize the components of a system.
– Construct executables by using forward and reverse
engineering.
– Describe the organization and relationships of the
components.
Component Diagrams
Example1 - Program
Component Diagrams
Example2 – Order Processing
Component Diagrams
Component Diagrams
Component Diagrams
Component Diagrams
Component Diagrams
• The interfaces on the right are known as required interfaces, which represents the services
the component needed in order to carry out its duty.
• Those interfaces on the left are known as provided interface, which represents the services
to deliver by the exhibiting component.
Deployment Diagram
• A UML deployment diagram is a diagram that shows
the configuration of run time processing nodes and
the components that live on them.
• Deployment diagrams is a kind of structure diagram
used in modeling the physical aspects of an object-
oriented system.
• They are often be used to model the static
deployment view of a system (topology of the
hardware).
Deployment Diagram
Purpose of a Deployment diagram
• It describes how software is deployed into the hardware
system.
• It visualizes how software interacts with the hardware to
execute the complete functionality.
• It is used to describe software to hardware interaction and
vice versa.
• They show the structure of the run-time system
• They model physical hardware elements and the
communication paths between them
• They can be used to plan the architecture of a system.
Deployment Diagram
Deployment Diagram
Other Notations
• Dependency
• Association relationships.
• May also contain notes and constraints.
Deployment Diagram
Example of a Deployment diagram
• Following deployment diagram represents the working of HTML5 video
player in the browser:
Modeling an embedded system
Client/ server architecture
Distributed system
Deployment Diagram
Use of Deployment diagram
• Deployment diagrams are mostly used by system
administrators, network engineers, etc.
• These diagrams are used with the sole purpose of describing
how software is deployed into the hardware system.
• To make the software work efficiently and at a faster rate, the
hardware also must be of good quality.
• It must be designed efficiently to make software work
properly and produce accurate results in quick time.
• Deployment diagrams can be used for,
– Modeling the network topology of a system.
– Modeling distributed systems and networks.
– Forward and reverse engineering processes

OOAD Anna University Notes Unit - III.ppt

  • 1.
    Component Diagram • Acomponent diagram, also known as a UML component diagram • It describes the organization and wiring of the physical components in a system. • Component diagrams are often drawn to help model implementation details and double- check that every aspect of the system's required functions is covered by planned development.
  • 2.
    Component Diagram • Inthe first version of UML, components included in these diagrams were physical: – documents, database table, files, and executables, all physical elements with a location. • In the world of UML 2, these components are less physical and more conceptual stand-alone design elements such as – a business process that provides or requires interfaces to interact with other constructs in the system. • The physical elements described in UML 1, like files and documents, are now referred in UML2 as artifacts. • UML 2 component may contain multiple physical artifacts if they naturally belong together.
  • 3.
    Basic Component DiagramSymbols and Notations Component • A component is a logical unit block of the system, a slightly higher abstraction than classes. • It is represented as a rectangle with a smaller rectangle in the upper right corner with tabs or the word written above the name of the component to help distinguish it from a class.
  • 4.
    Basic Component Diagram Symbolsand Notations Interface • An interface (small circle or semi-circle on a stick) describes a group of operations used (required) or created (provided) by components. • A full circle represents an interface created or provided by the component. • A semi-circle represents a required interface, like a person's input.
  • 5.
    Basic Component Diagram Symbolsand Notations Dependencies • Draw dependencies among components using dashed arrows.
  • 6.
    Basic Component Diagram Symbolsand Notations Port • Ports are represented using a square along the edge of the system or a component. • A port is often used to help expose required and provided interfaces of a component.
  • 7.
    Component Diagram –UML2 • Component in UML 2 can be modeled as: – A rectangle with the component's name – A rectangle with the component icon – A rectangle with the stereotype text and/or icon
  • 8.
  • 9.
    Purpose of ComponentDiagrams • Component diagram does not describe the functionality of the system but it describes the components used to make those functionalities. • Component diagrams are used to visualize the physical components in a system. These components are libraries, packages, files, etc. • Component diagrams can also be described as a static implementation view of a system. Static implementation represents the organization of the components at a particular moment. • A single component diagram cannot represent the entire system but a collection of diagrams is used to represent the whole.
  • 10.
    Purpose of ComponentDiagrams • The purpose of the component diagram can be summarized as − – Visualize the components of a system. – Construct executables by using forward and reverse engineering. – Describe the organization and relationships of the components.
  • 11.
  • 12.
  • 13.
  • 14.
  • 15.
  • 16.
  • 17.
    Component Diagrams • Theinterfaces on the right are known as required interfaces, which represents the services the component needed in order to carry out its duty. • Those interfaces on the left are known as provided interface, which represents the services to deliver by the exhibiting component.
  • 18.
    Deployment Diagram • AUML deployment diagram is a diagram that shows the configuration of run time processing nodes and the components that live on them. • Deployment diagrams is a kind of structure diagram used in modeling the physical aspects of an object- oriented system. • They are often be used to model the static deployment view of a system (topology of the hardware).
  • 19.
    Deployment Diagram Purpose ofa Deployment diagram • It describes how software is deployed into the hardware system. • It visualizes how software interacts with the hardware to execute the complete functionality. • It is used to describe software to hardware interaction and vice versa. • They show the structure of the run-time system • They model physical hardware elements and the communication paths between them • They can be used to plan the architecture of a system.
  • 20.
  • 21.
    Deployment Diagram Other Notations •Dependency • Association relationships. • May also contain notes and constraints.
  • 22.
    Deployment Diagram Example ofa Deployment diagram • Following deployment diagram represents the working of HTML5 video player in the browser:
  • 23.
  • 24.
  • 25.
  • 26.
    Deployment Diagram Use ofDeployment diagram • Deployment diagrams are mostly used by system administrators, network engineers, etc. • These diagrams are used with the sole purpose of describing how software is deployed into the hardware system. • To make the software work efficiently and at a faster rate, the hardware also must be of good quality. • It must be designed efficiently to make software work properly and produce accurate results in quick time. • Deployment diagrams can be used for, – Modeling the network topology of a system. – Modeling distributed systems and networks. – Forward and reverse engineering processes