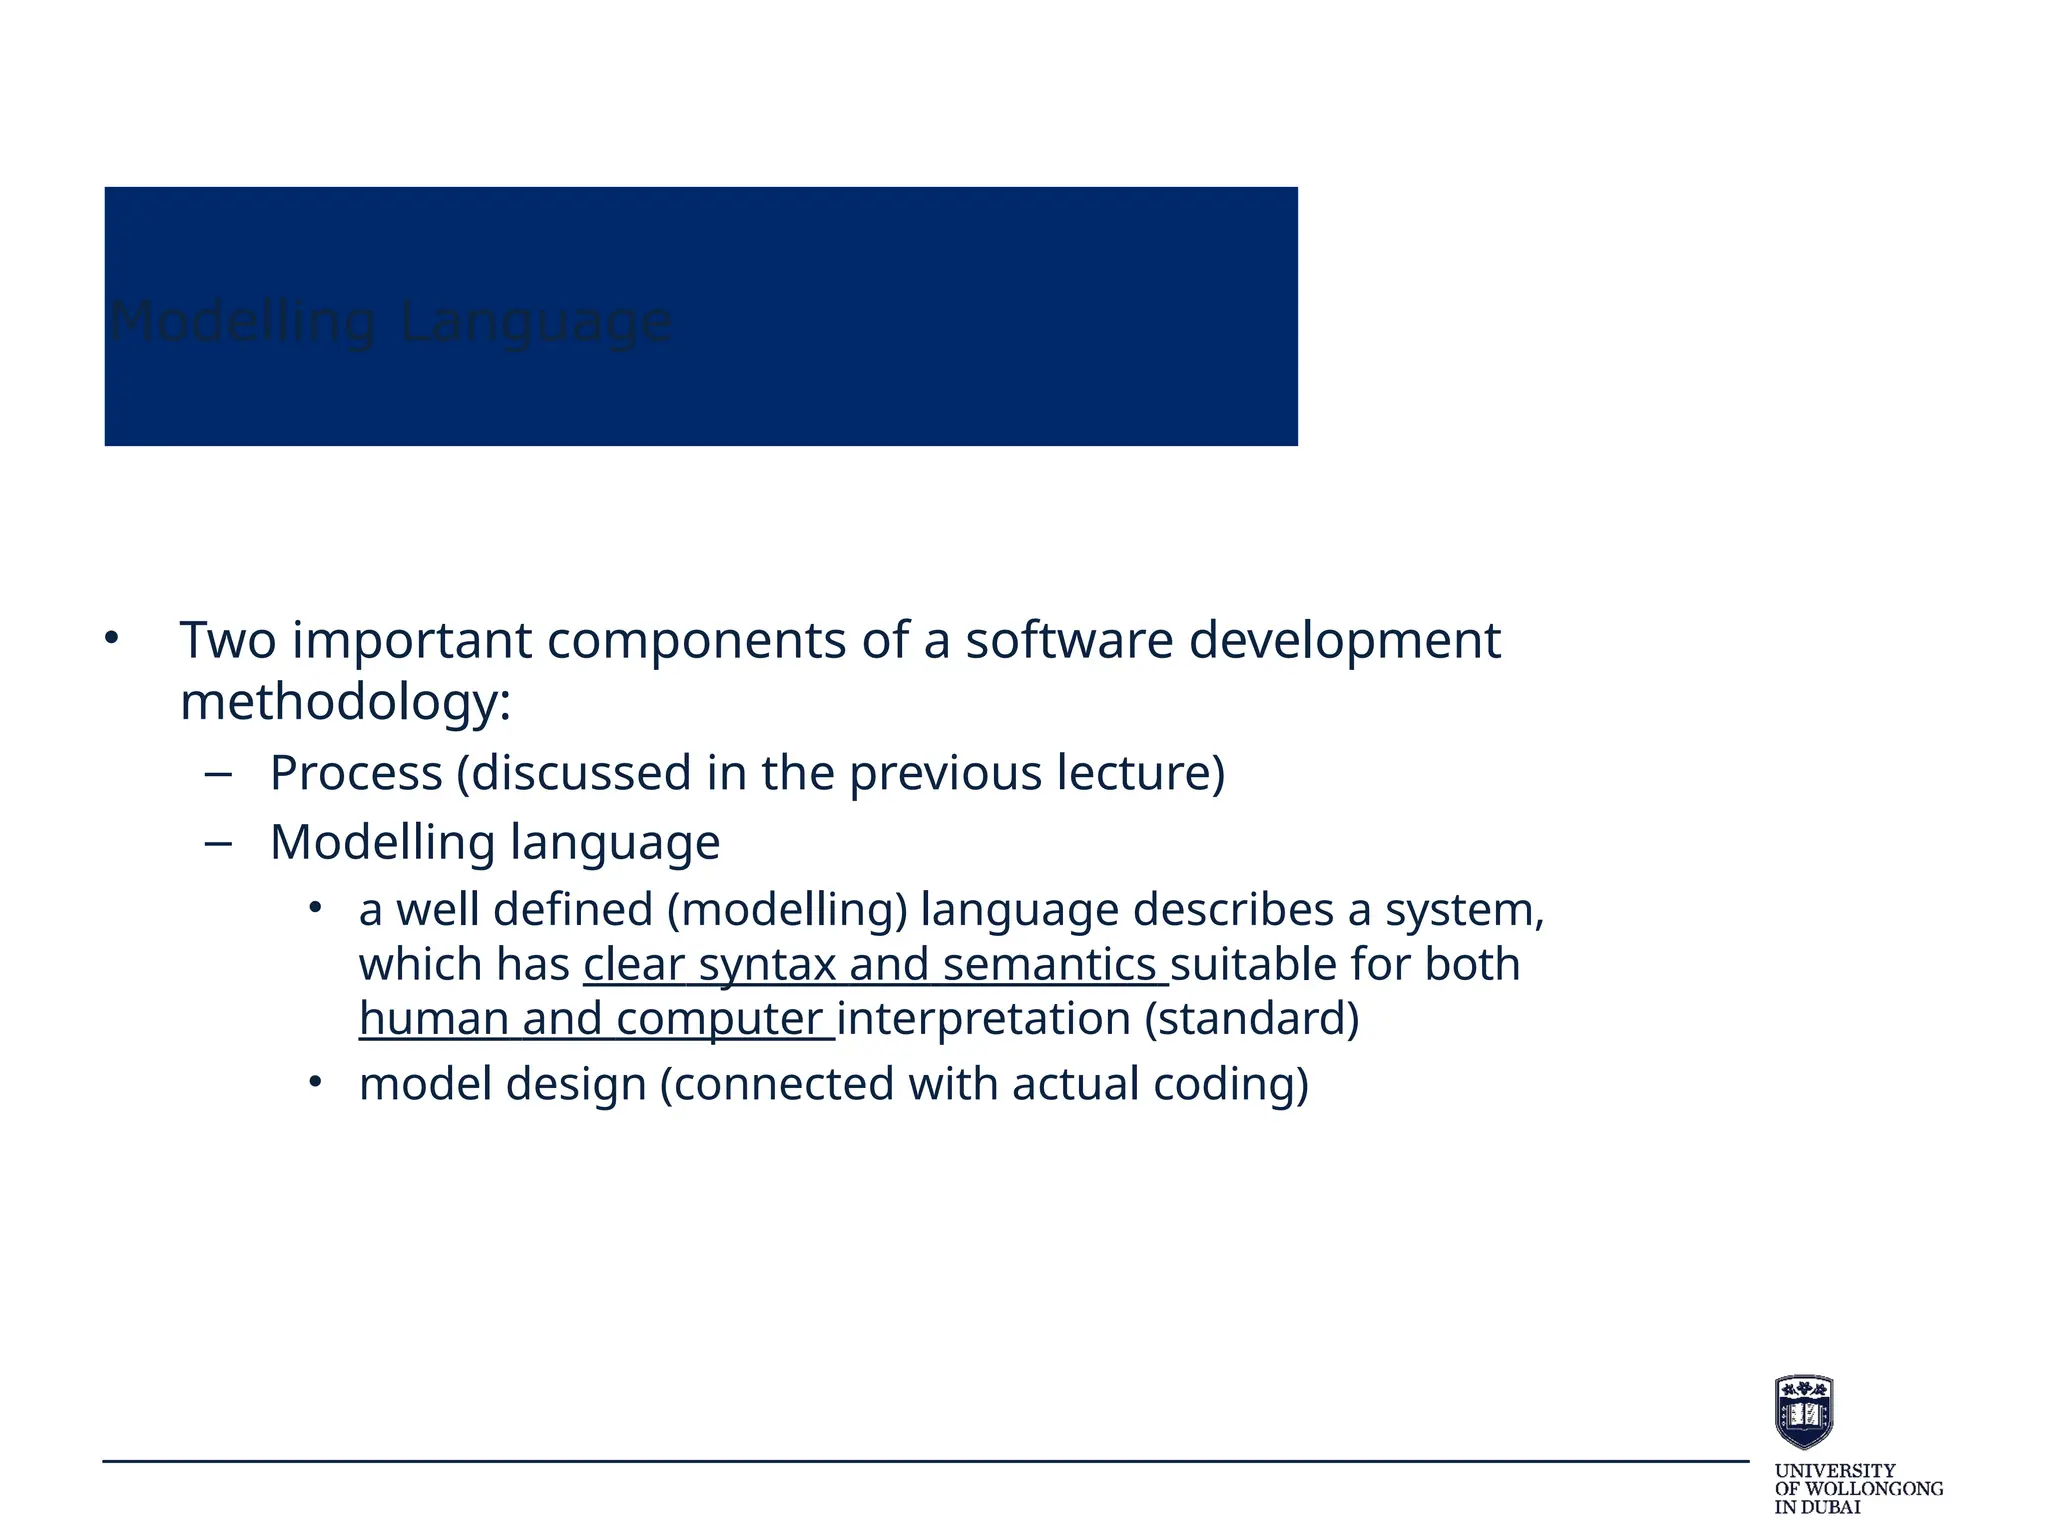
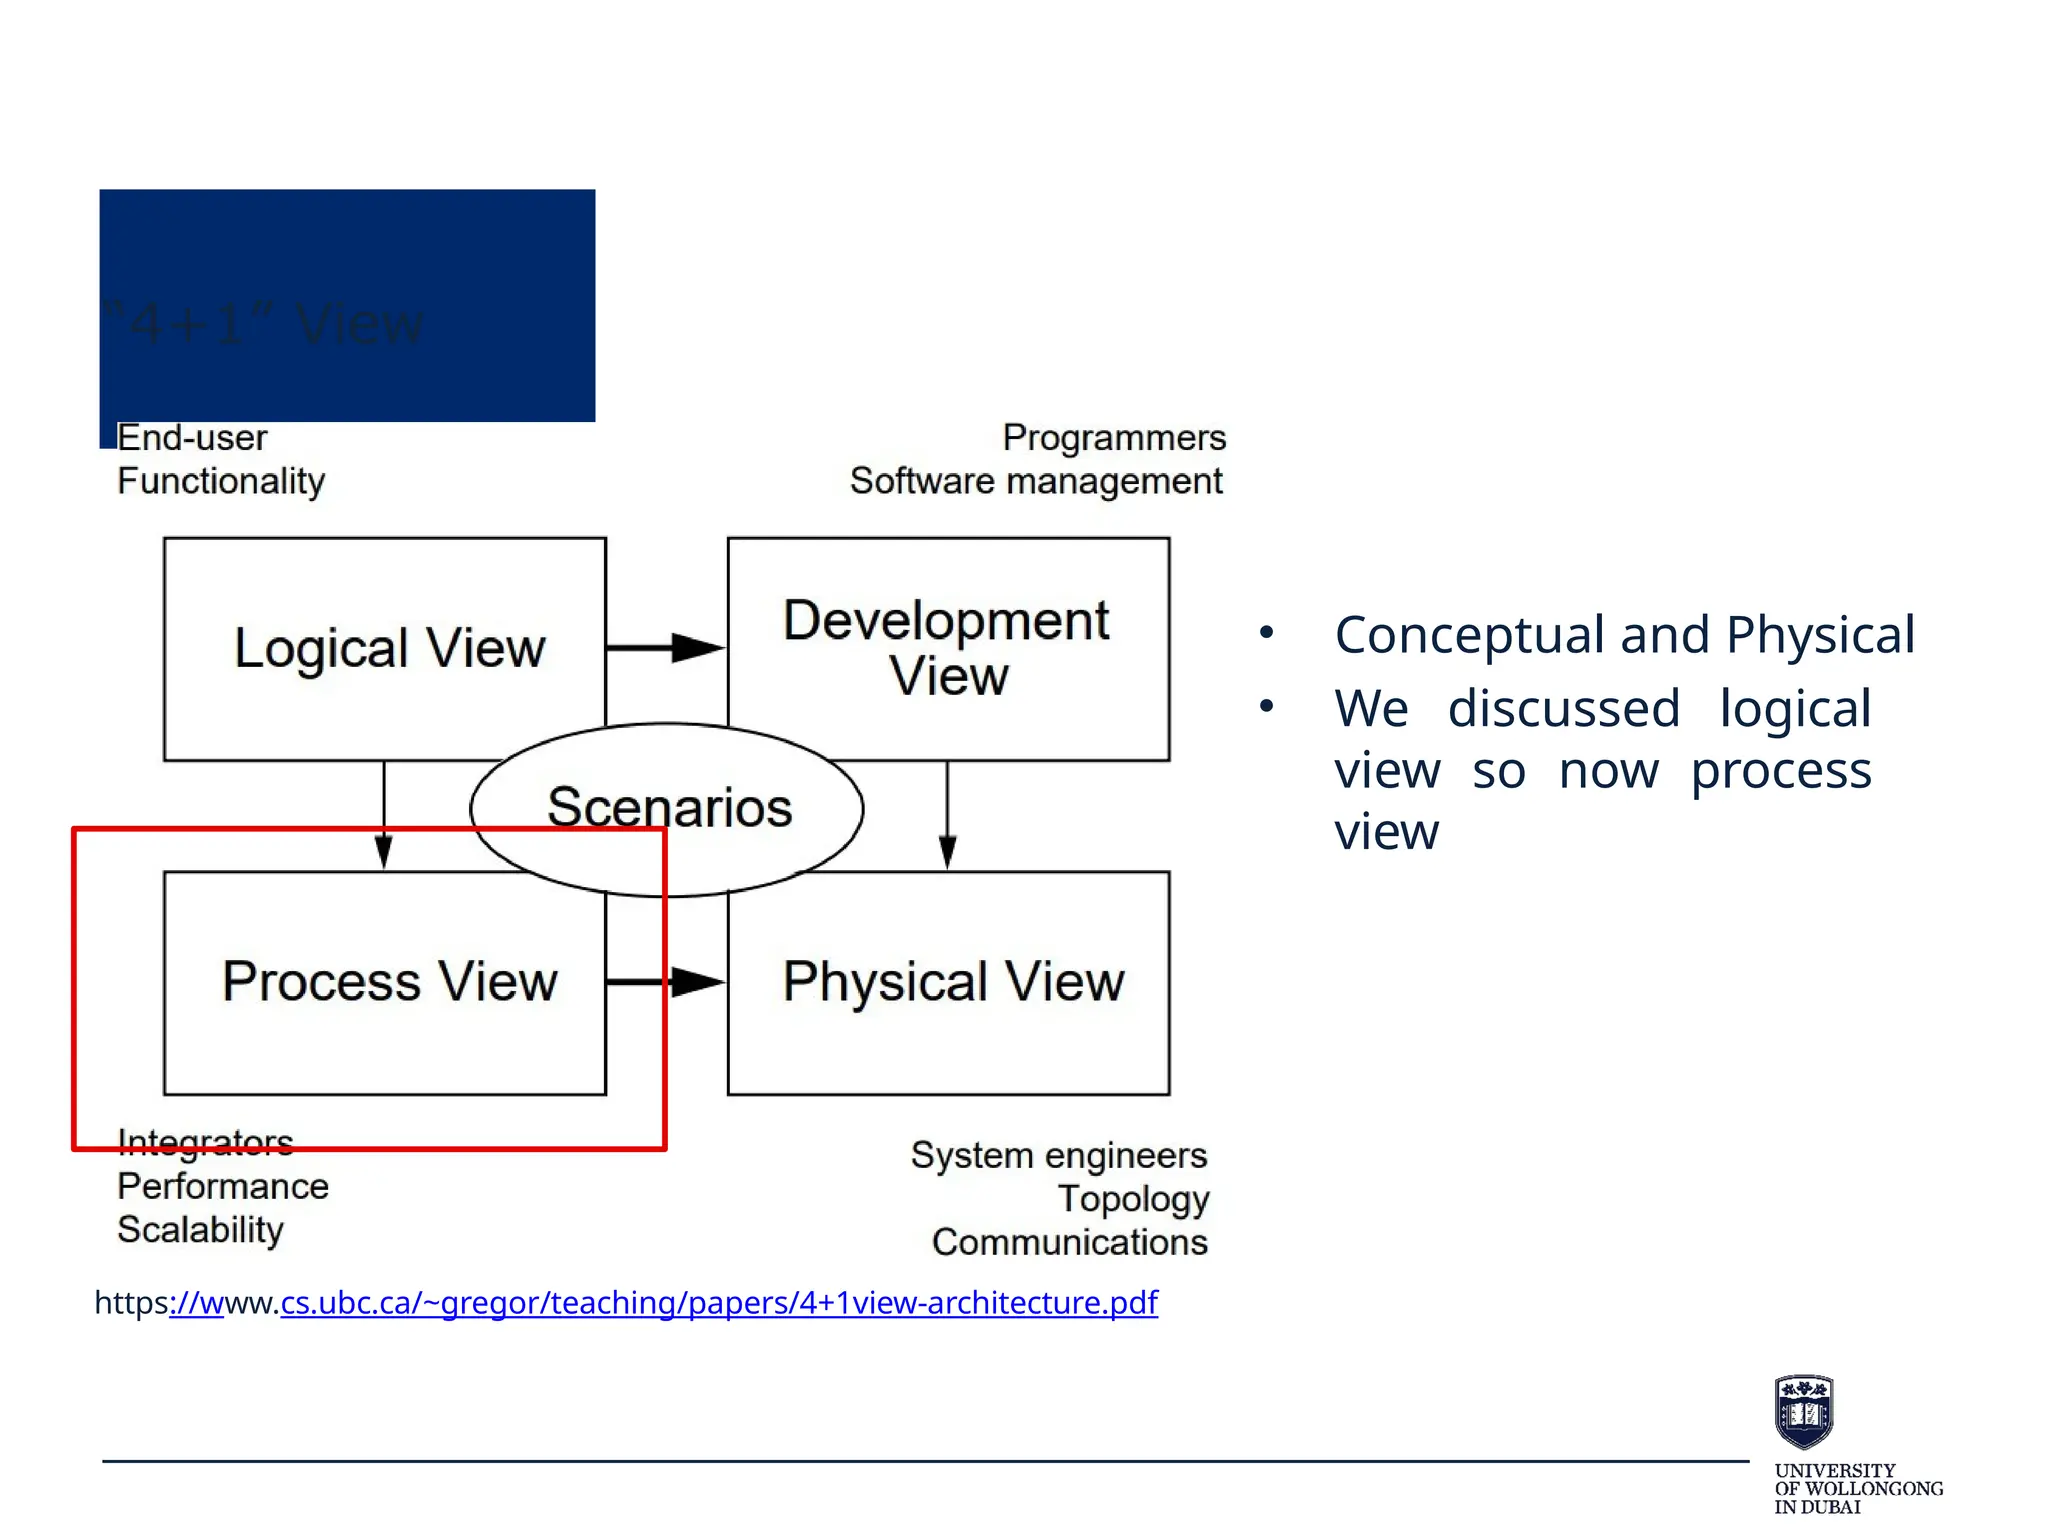
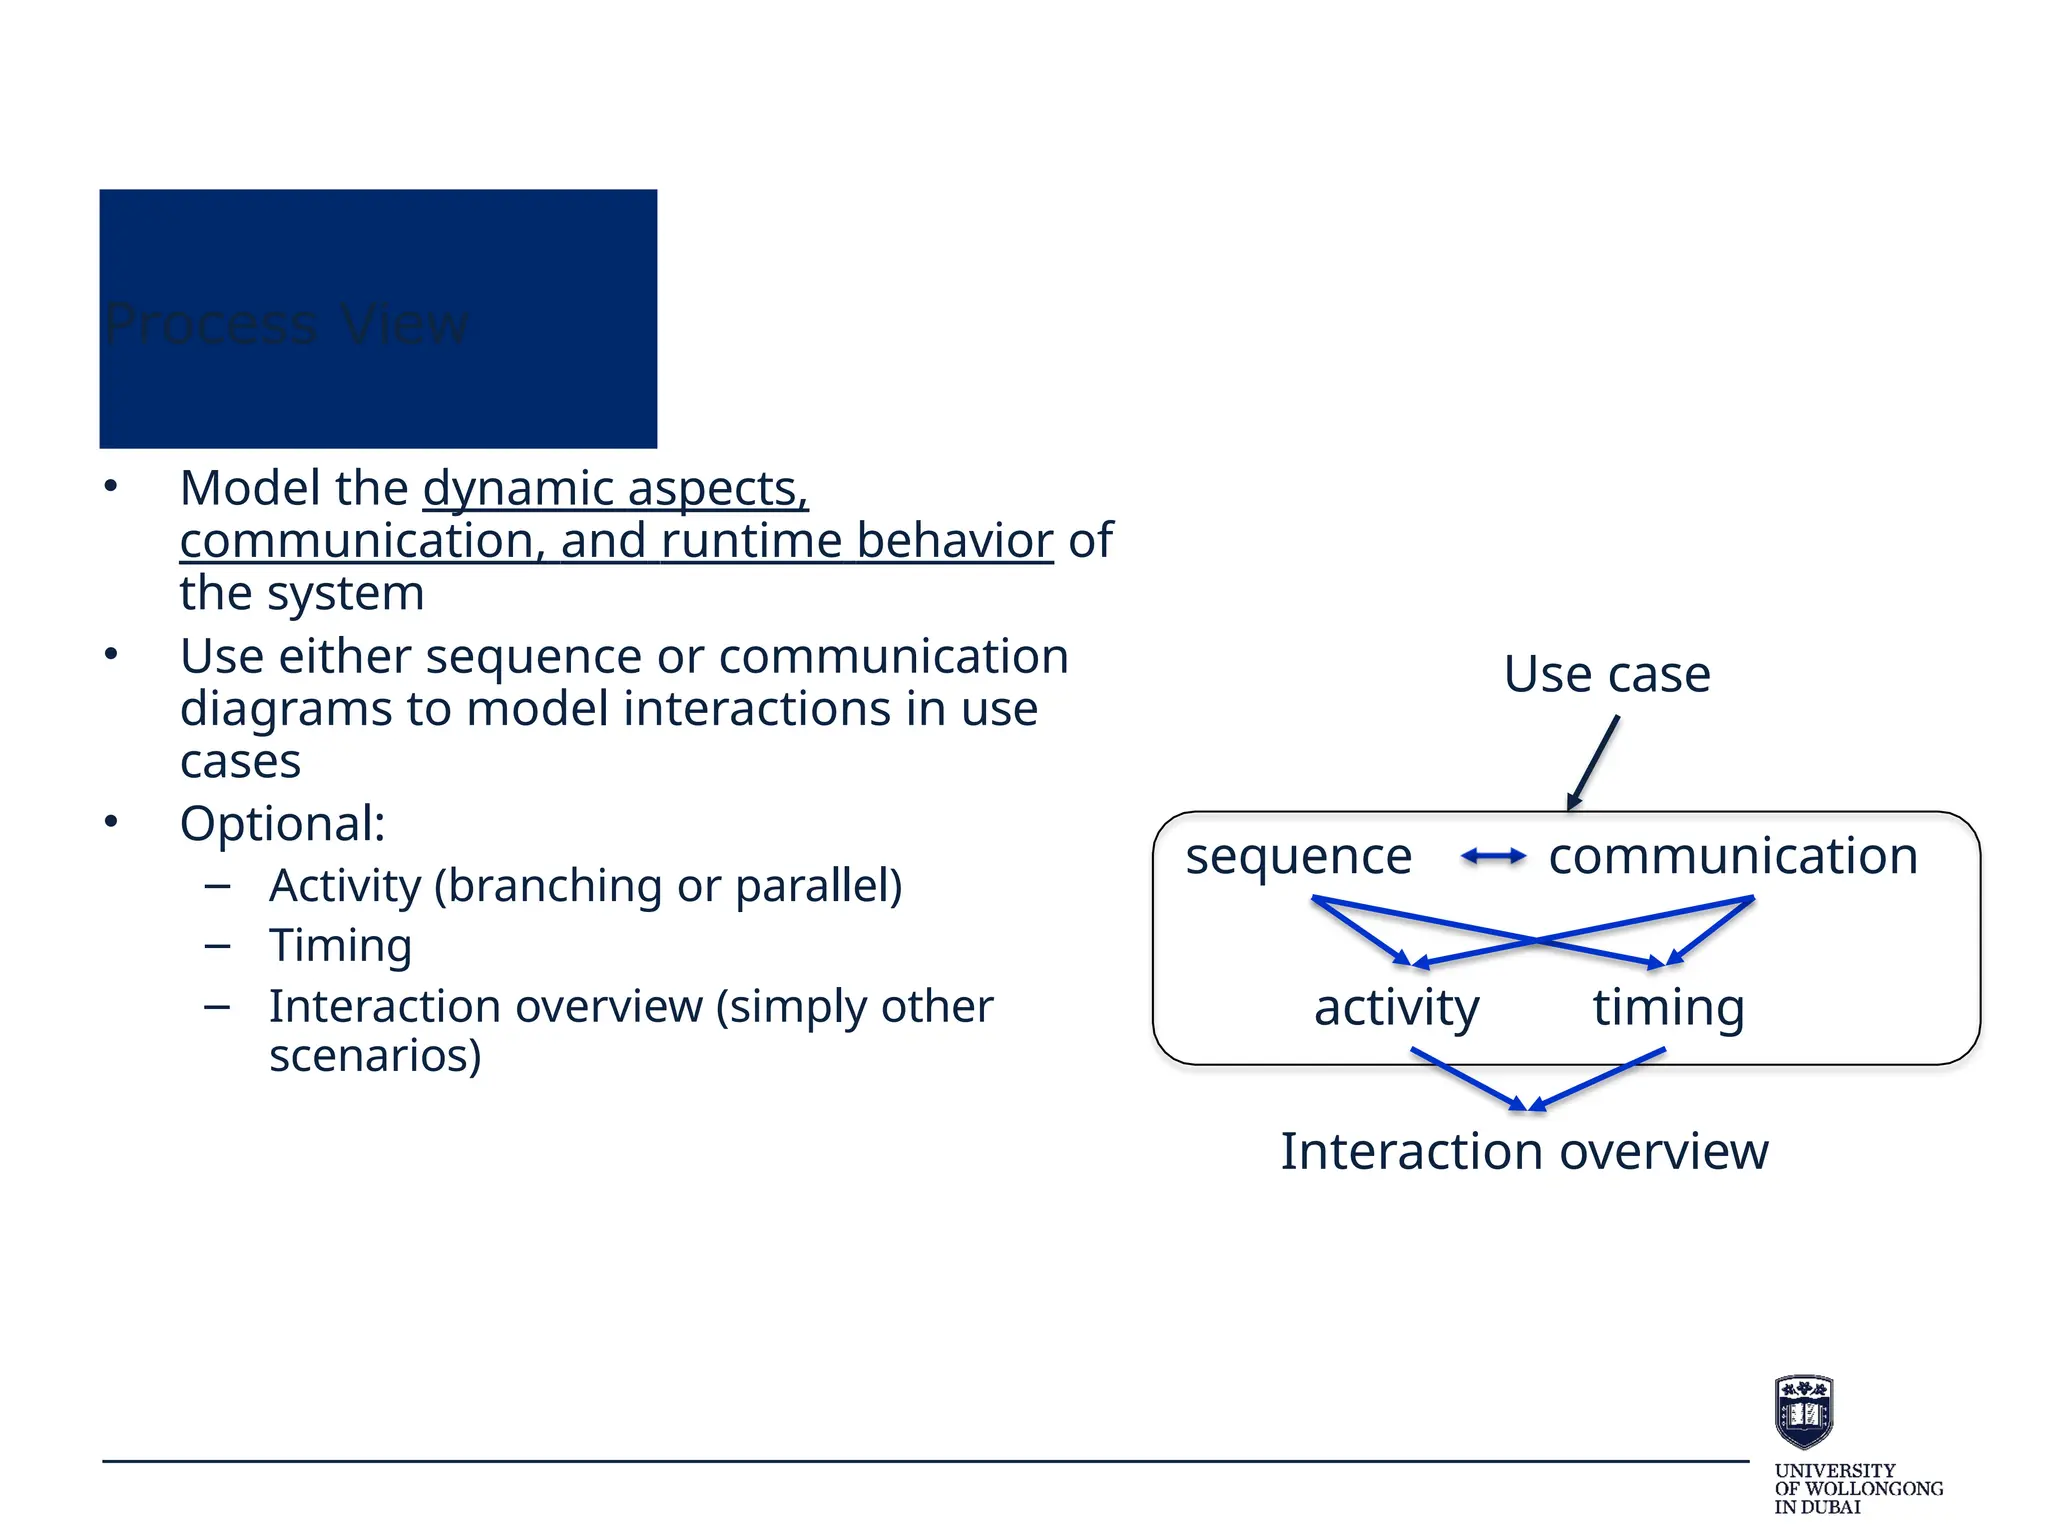
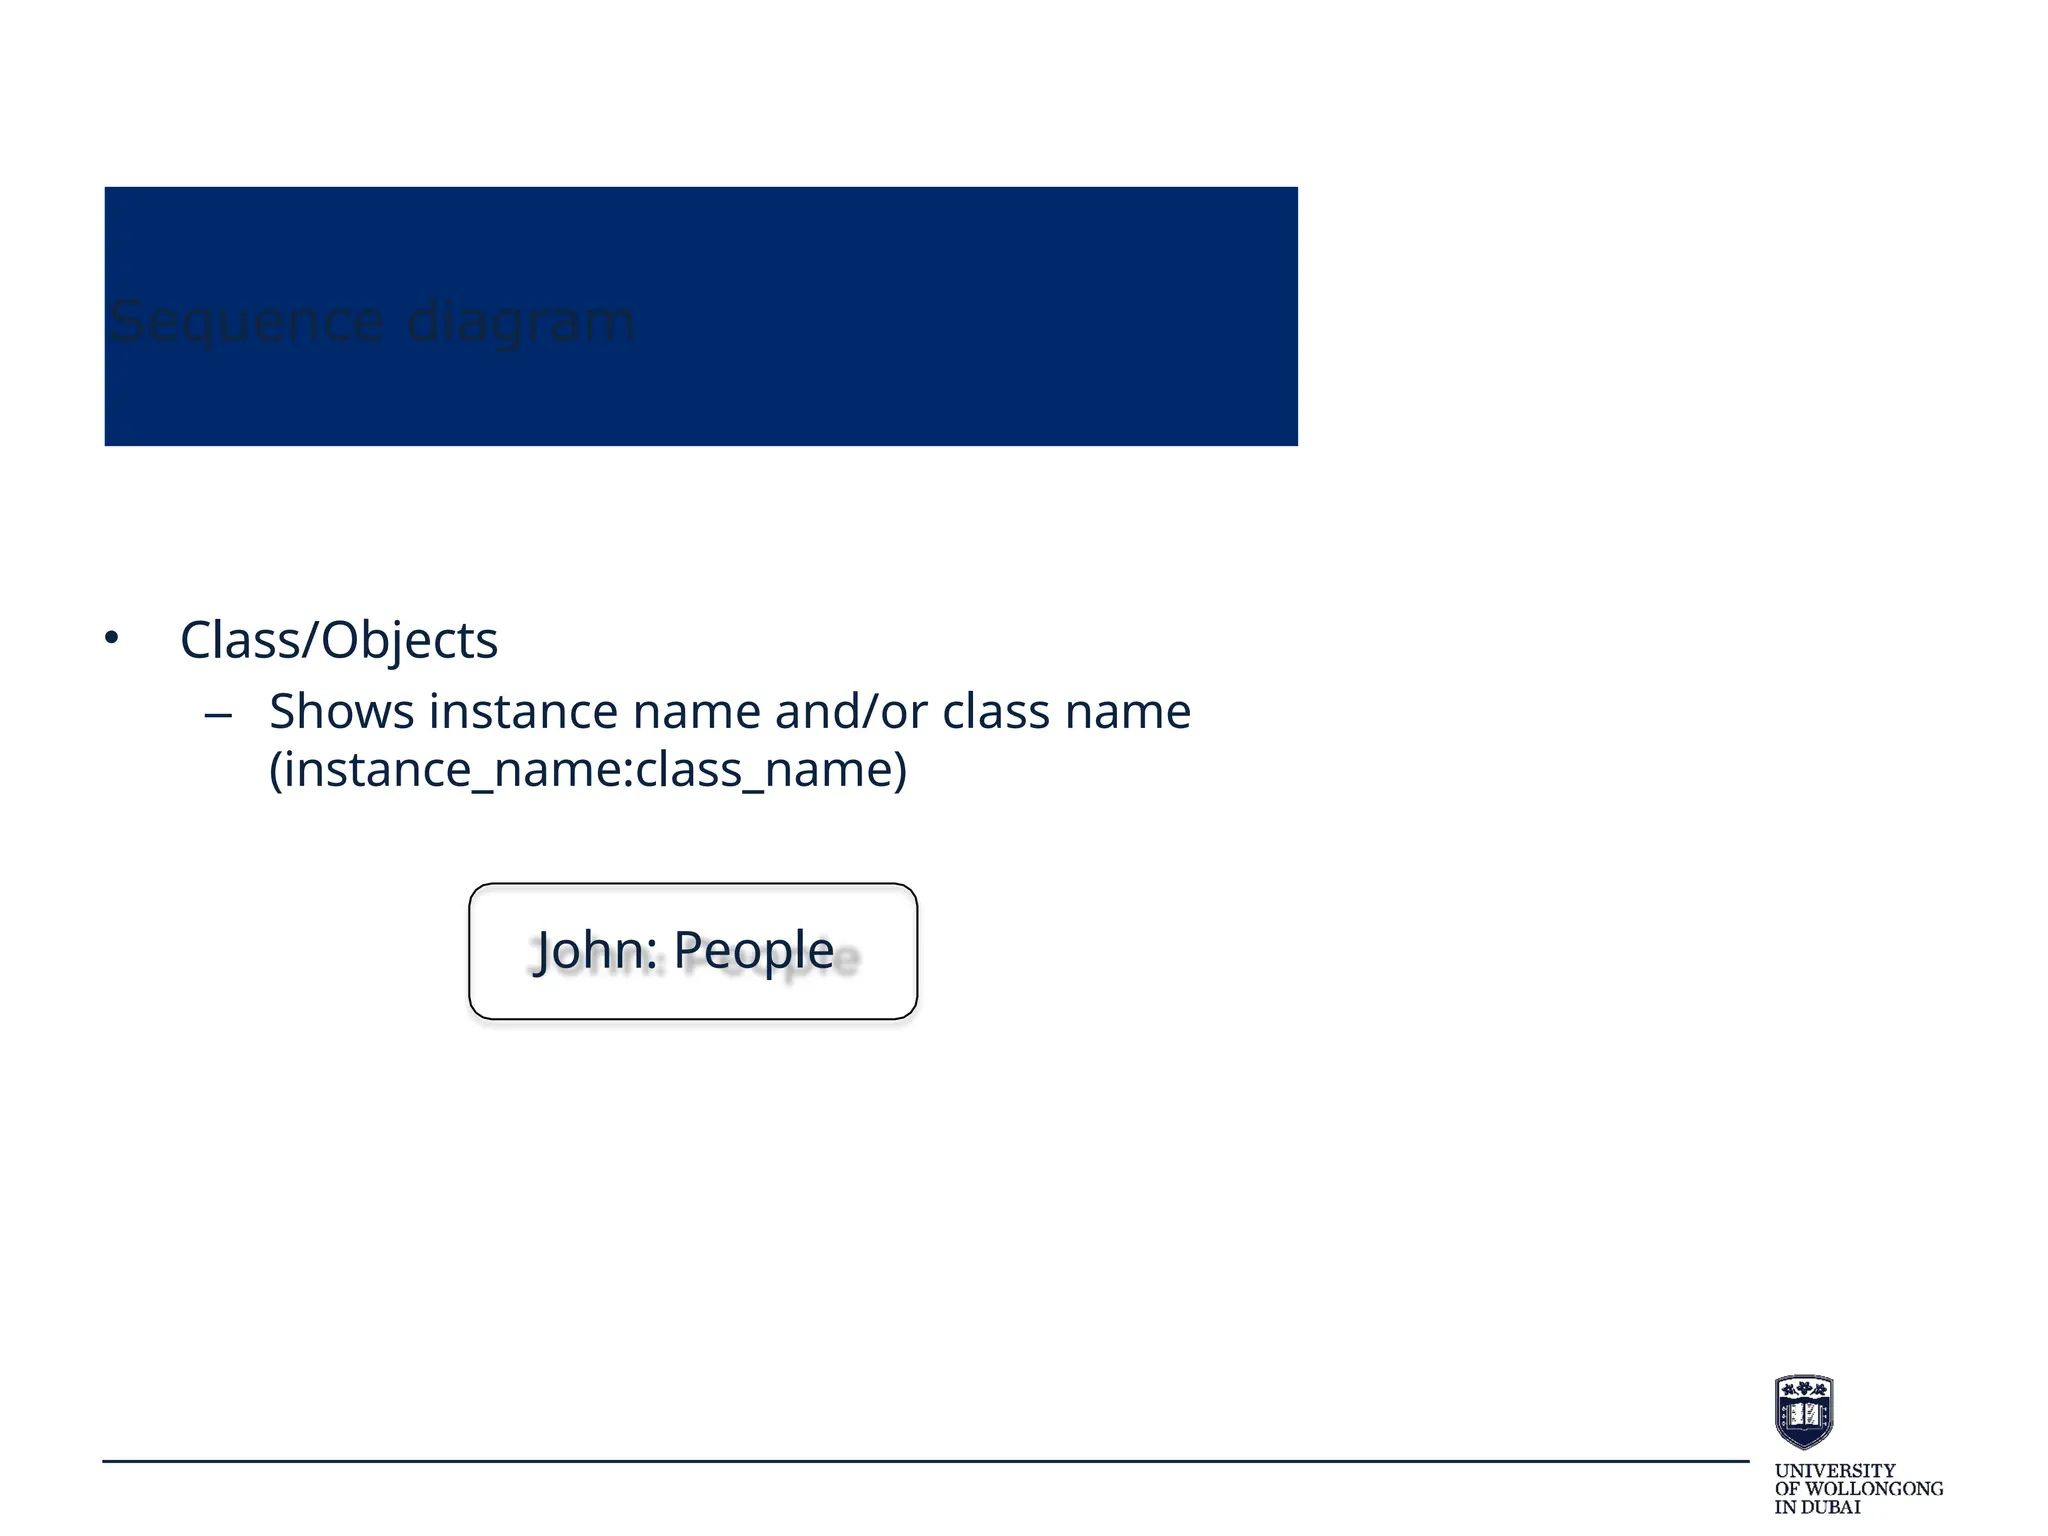
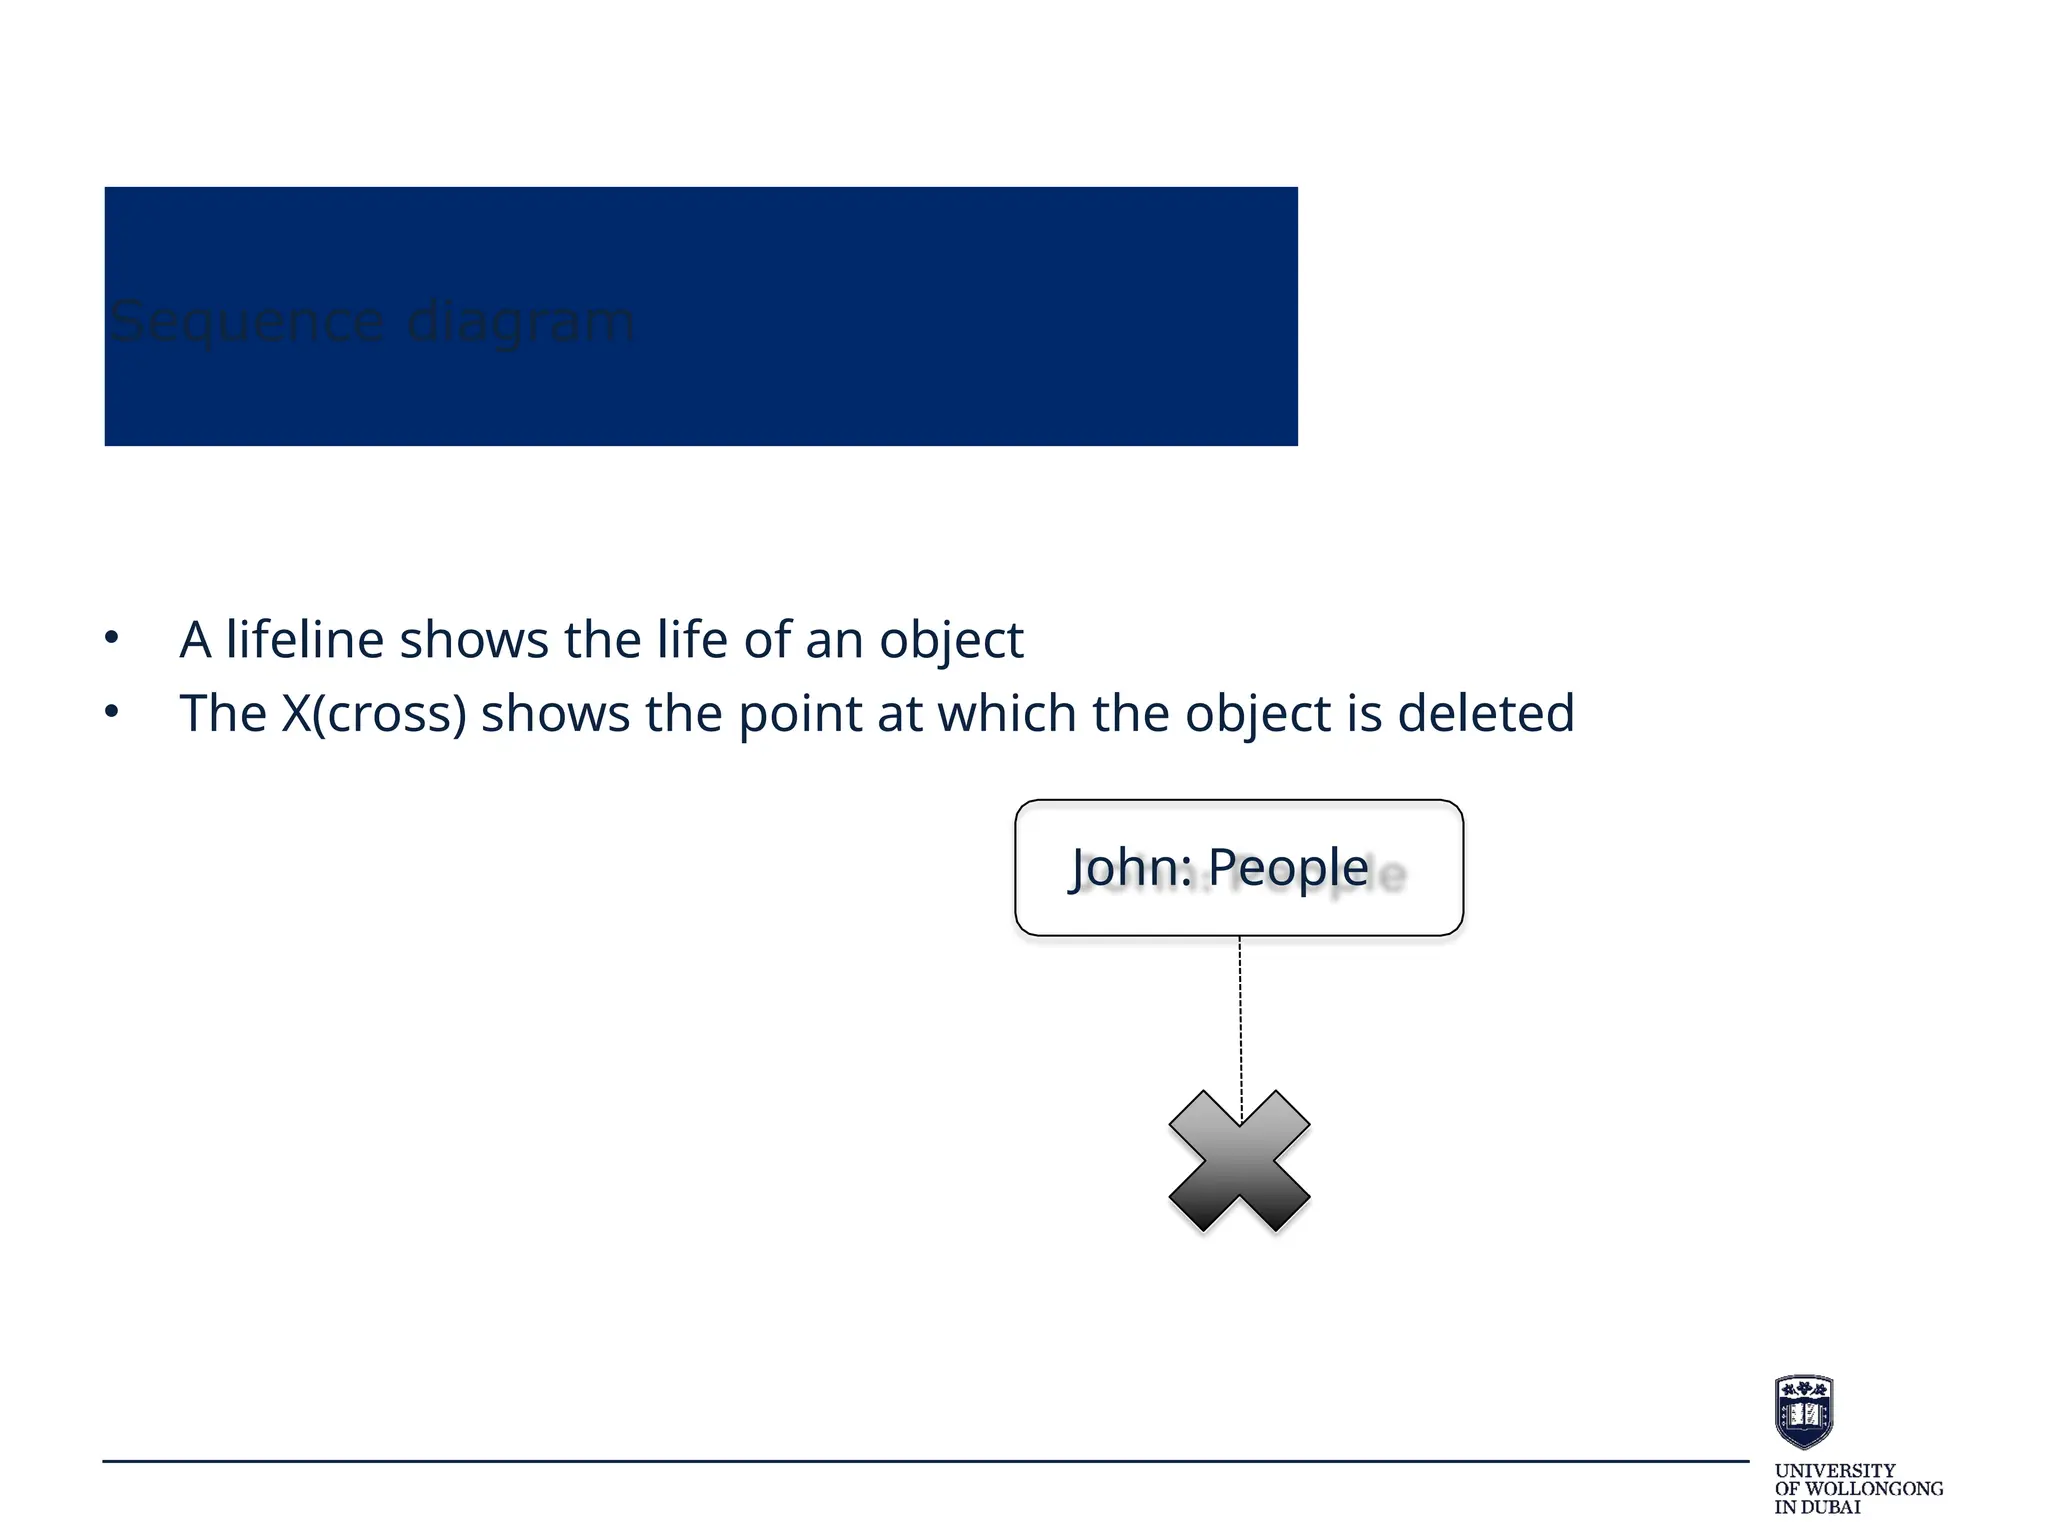
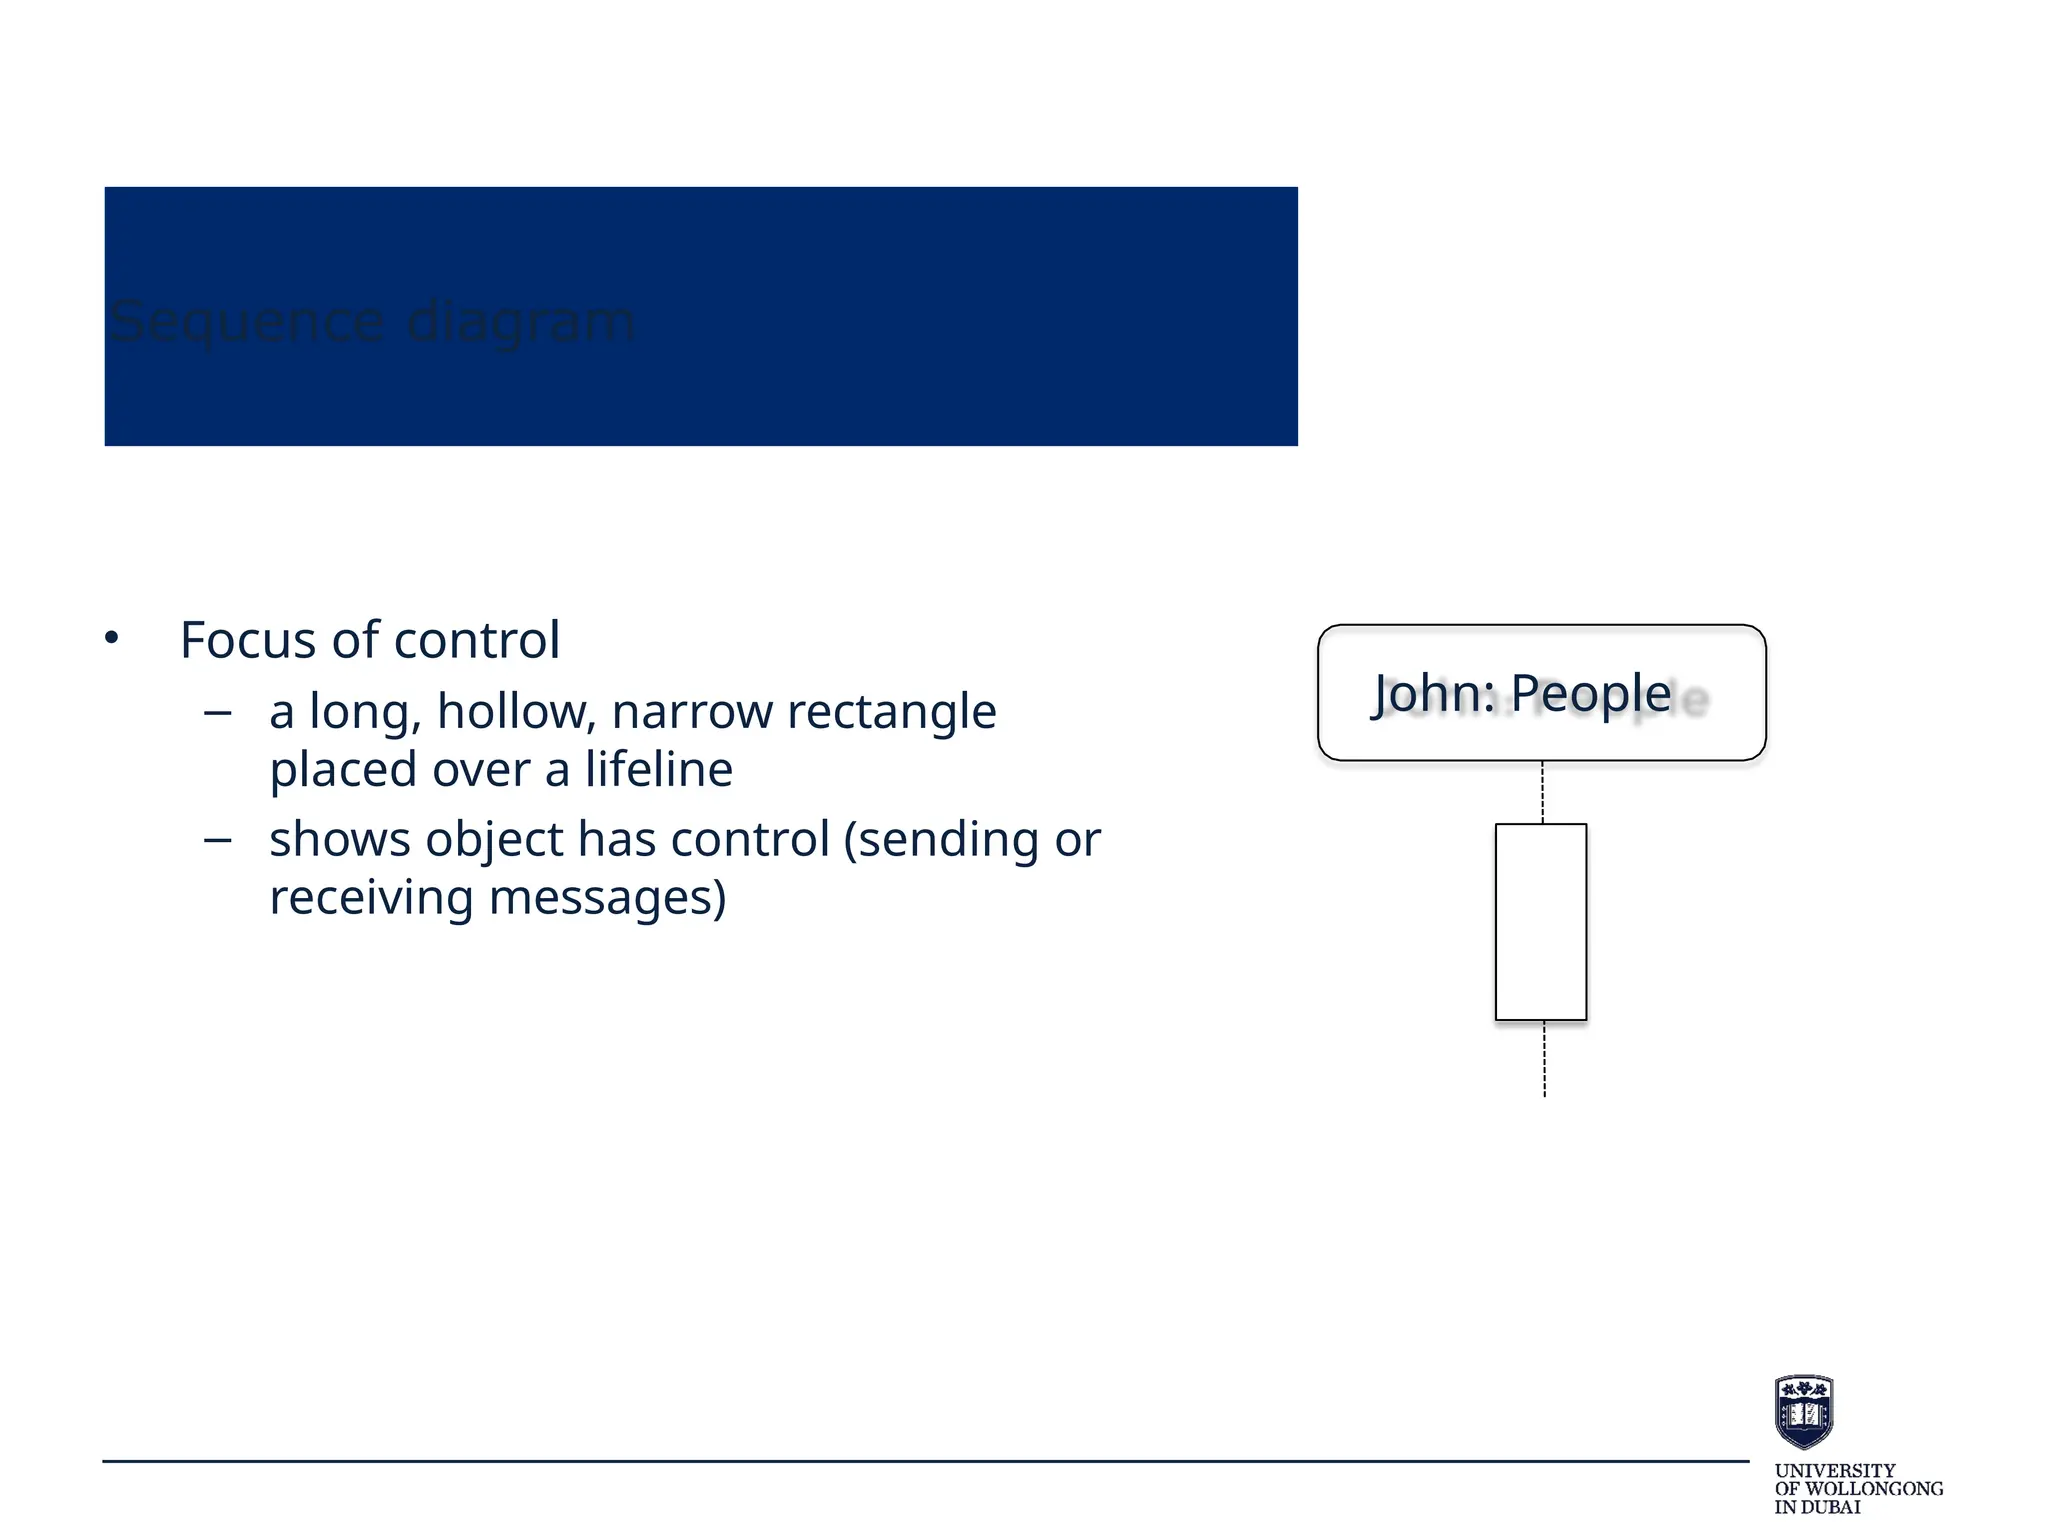
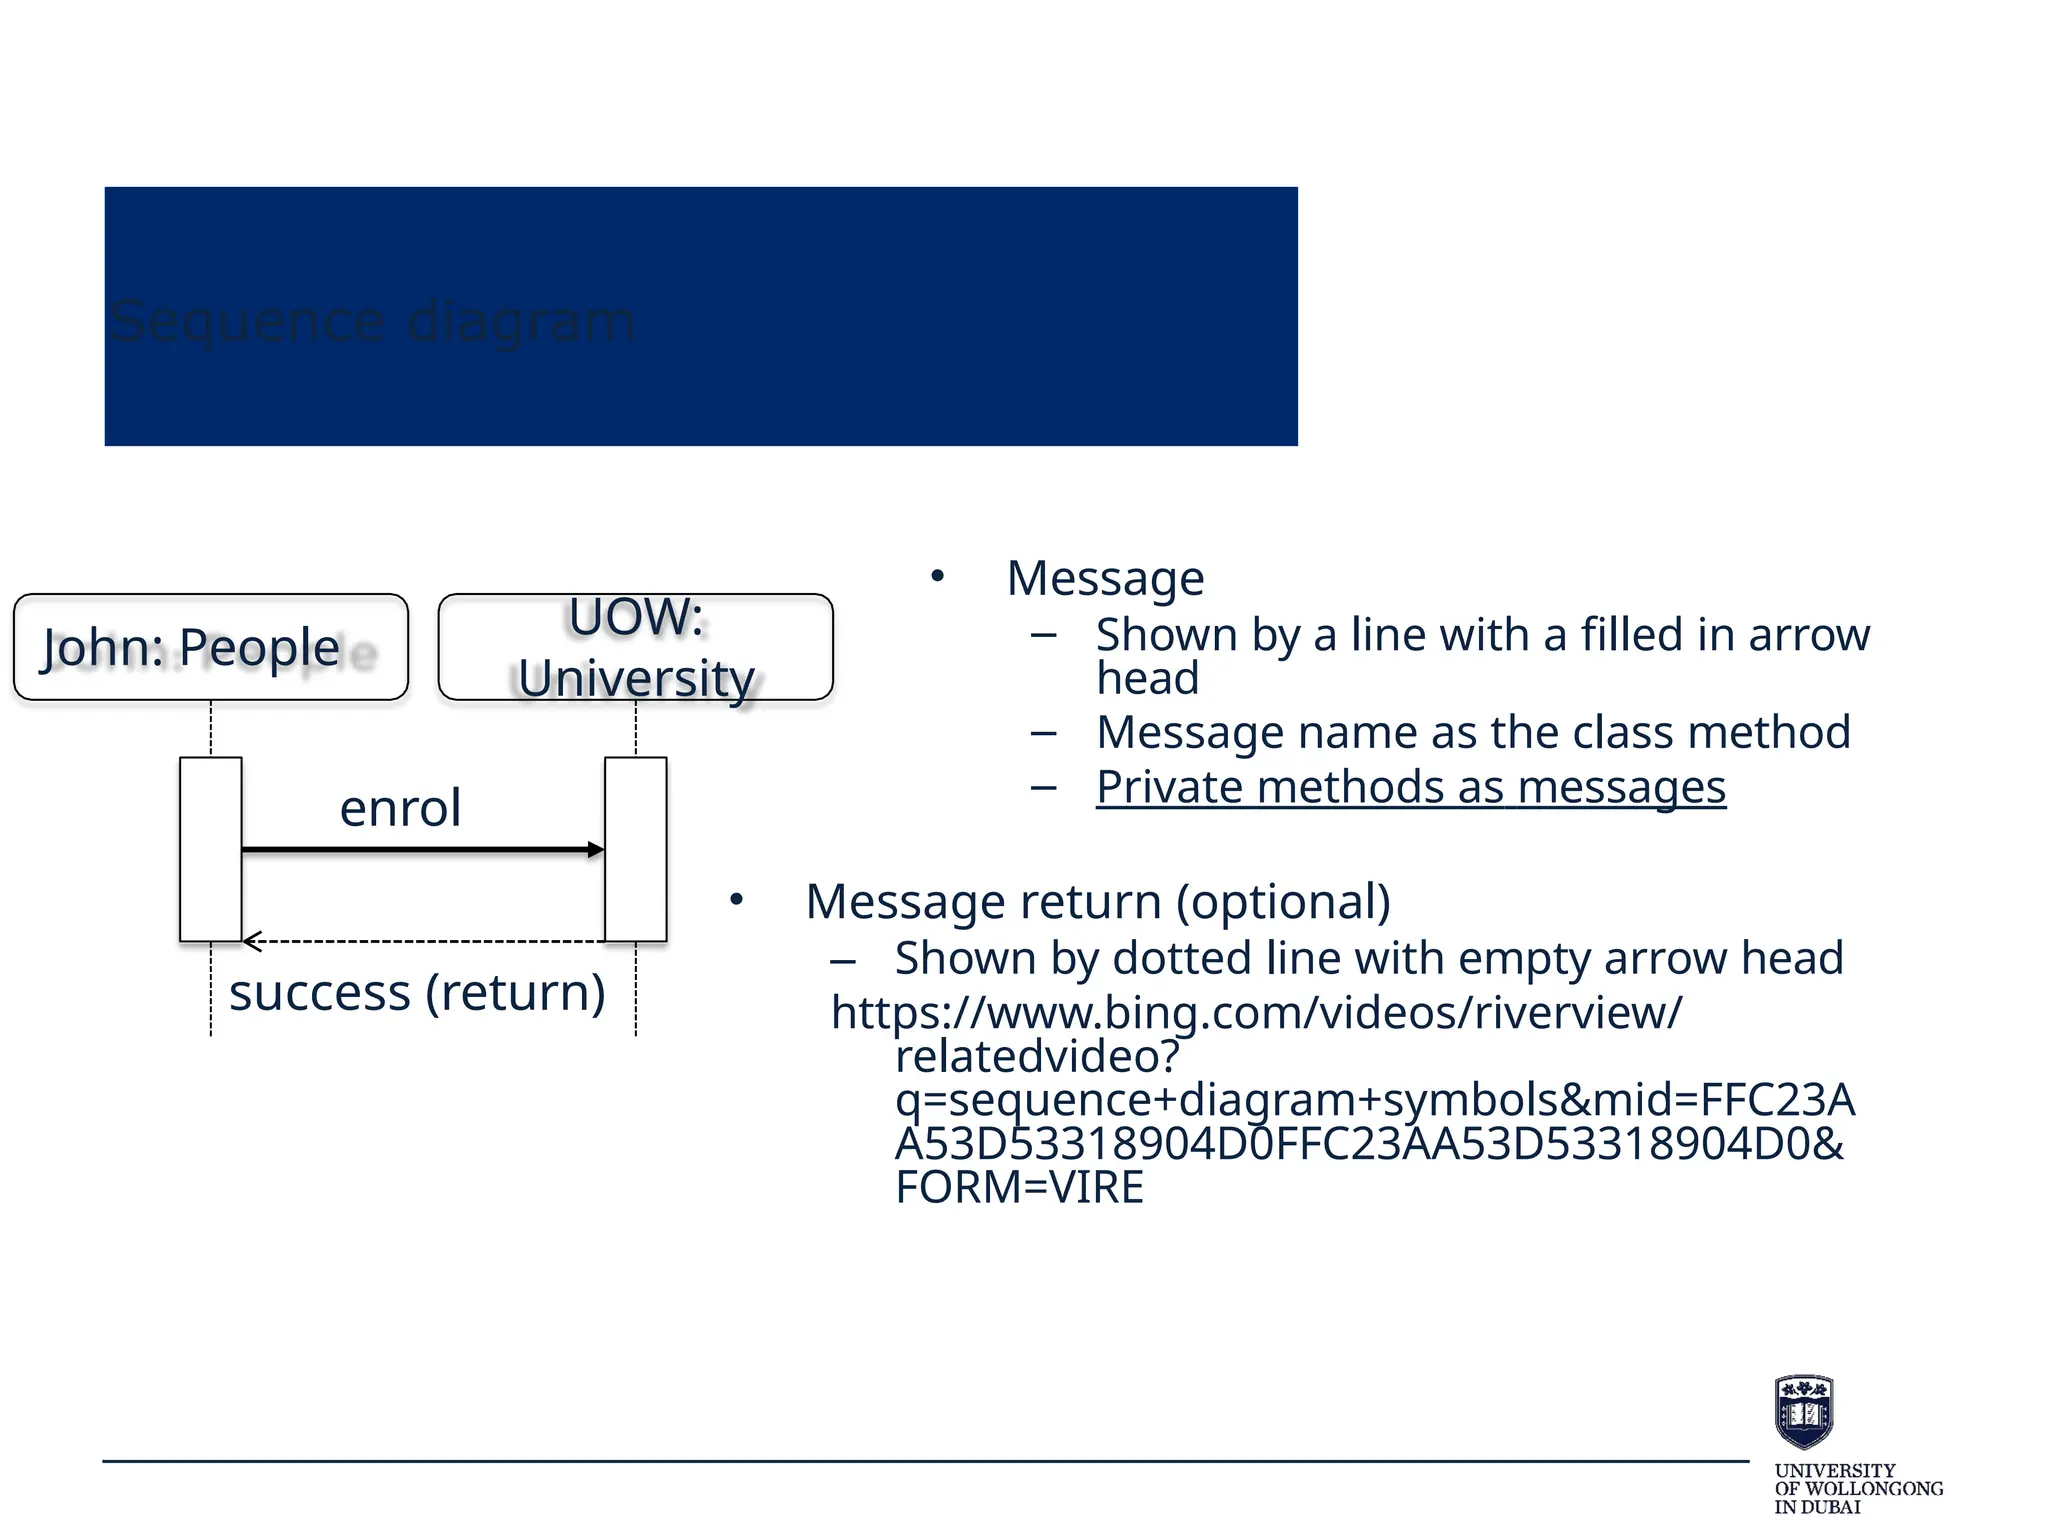
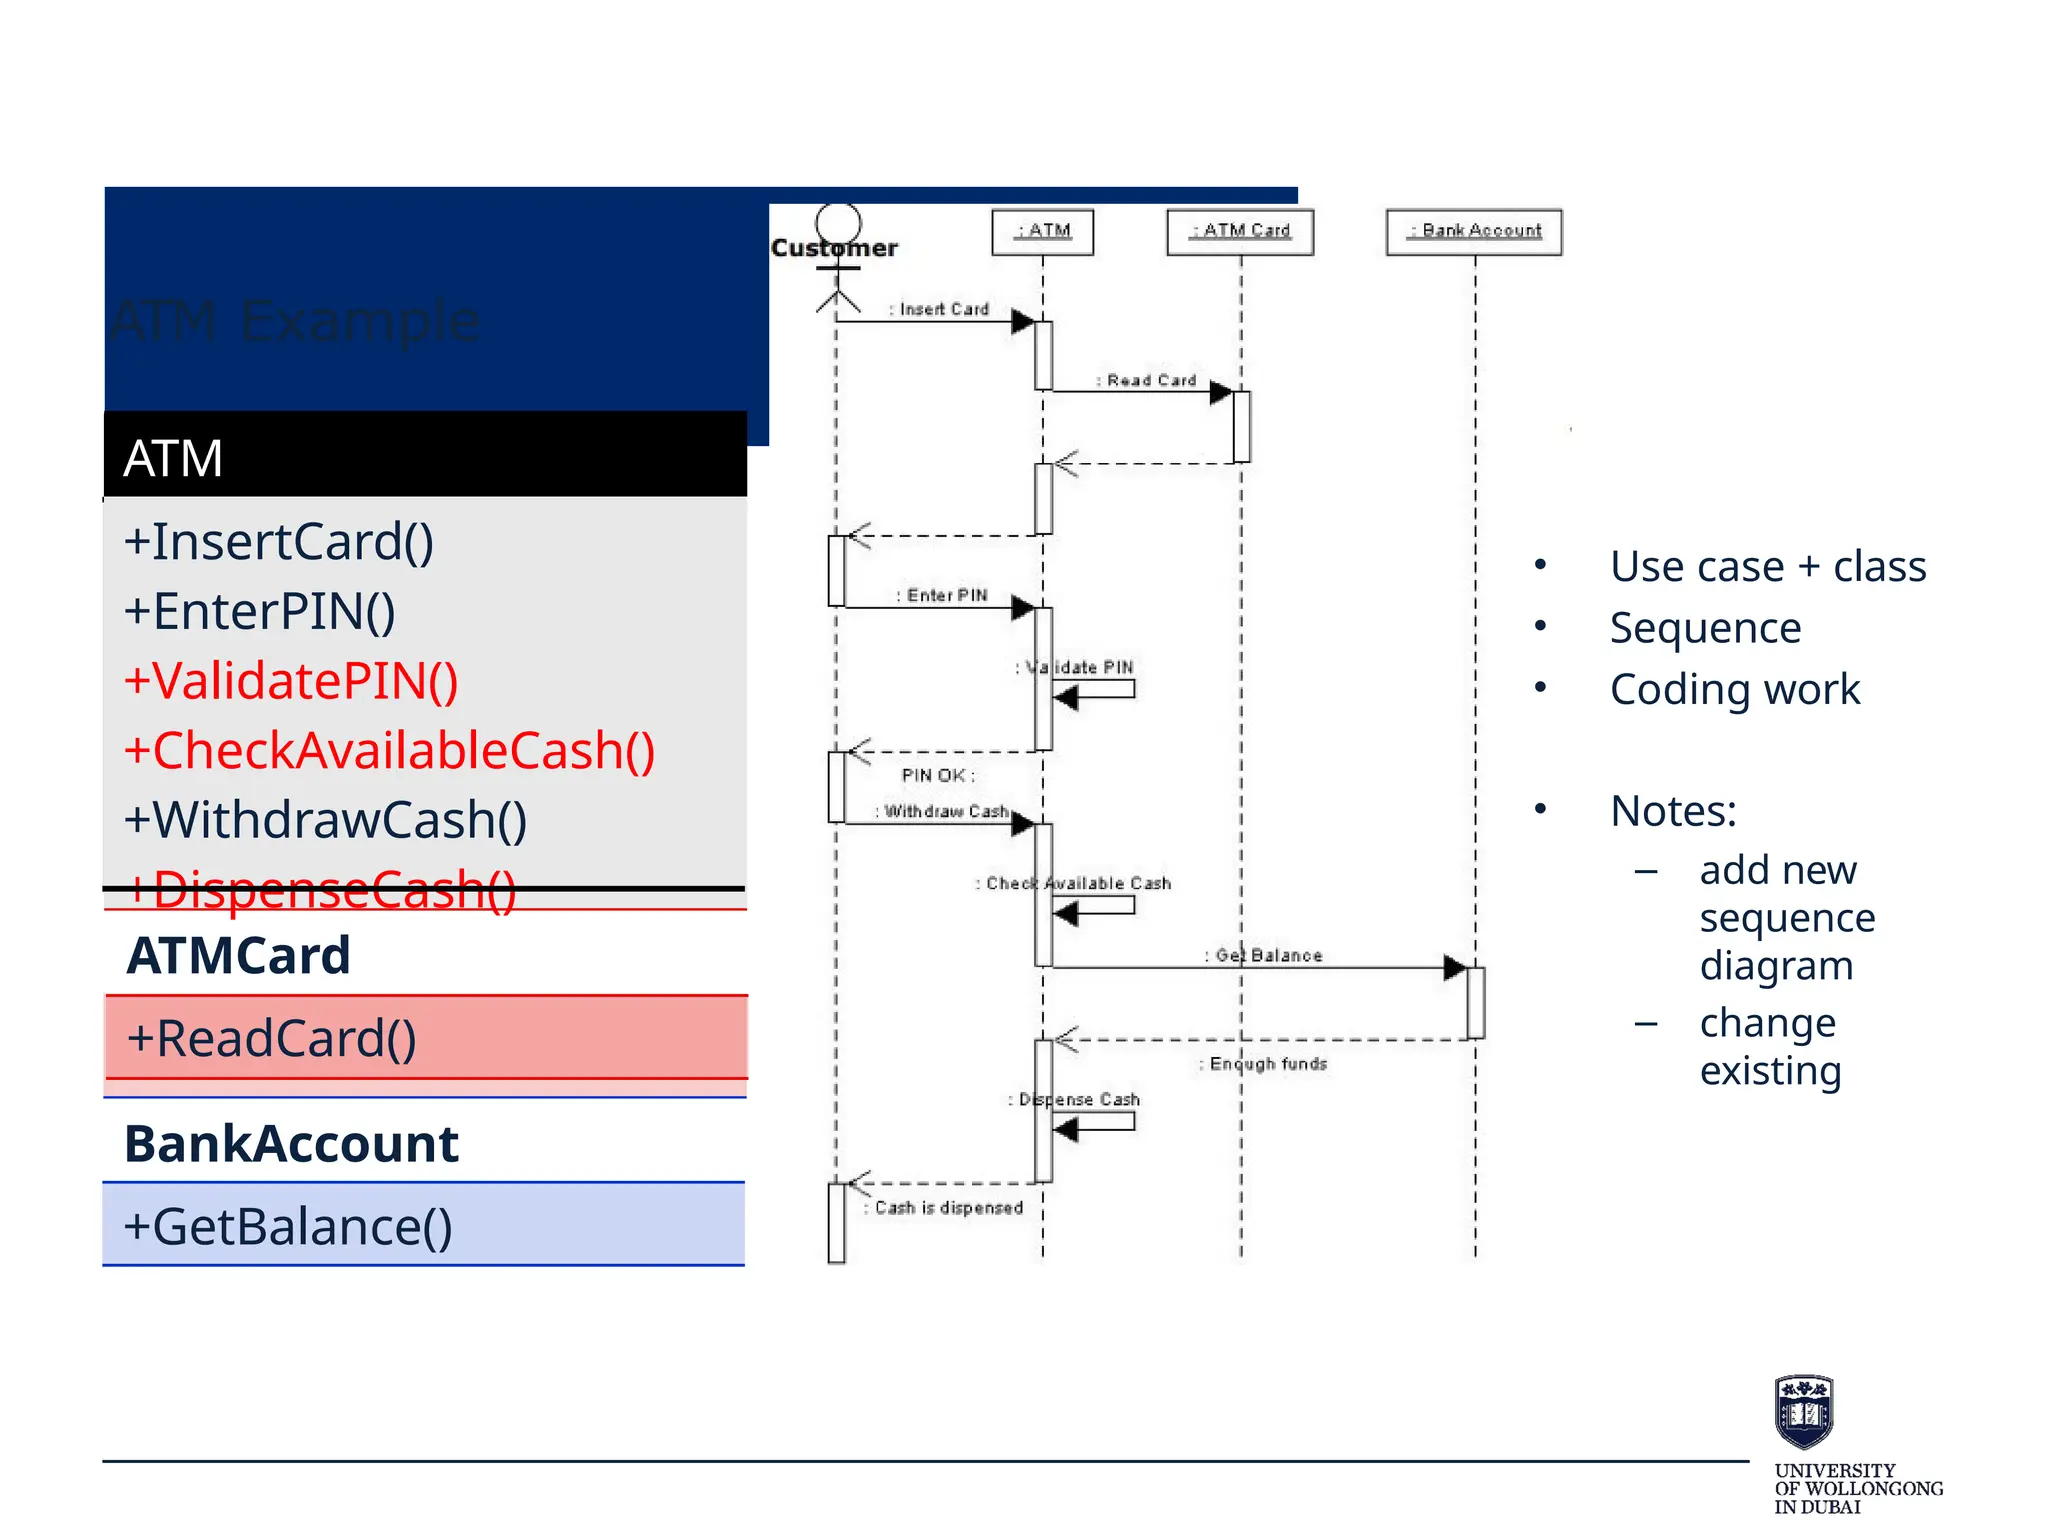
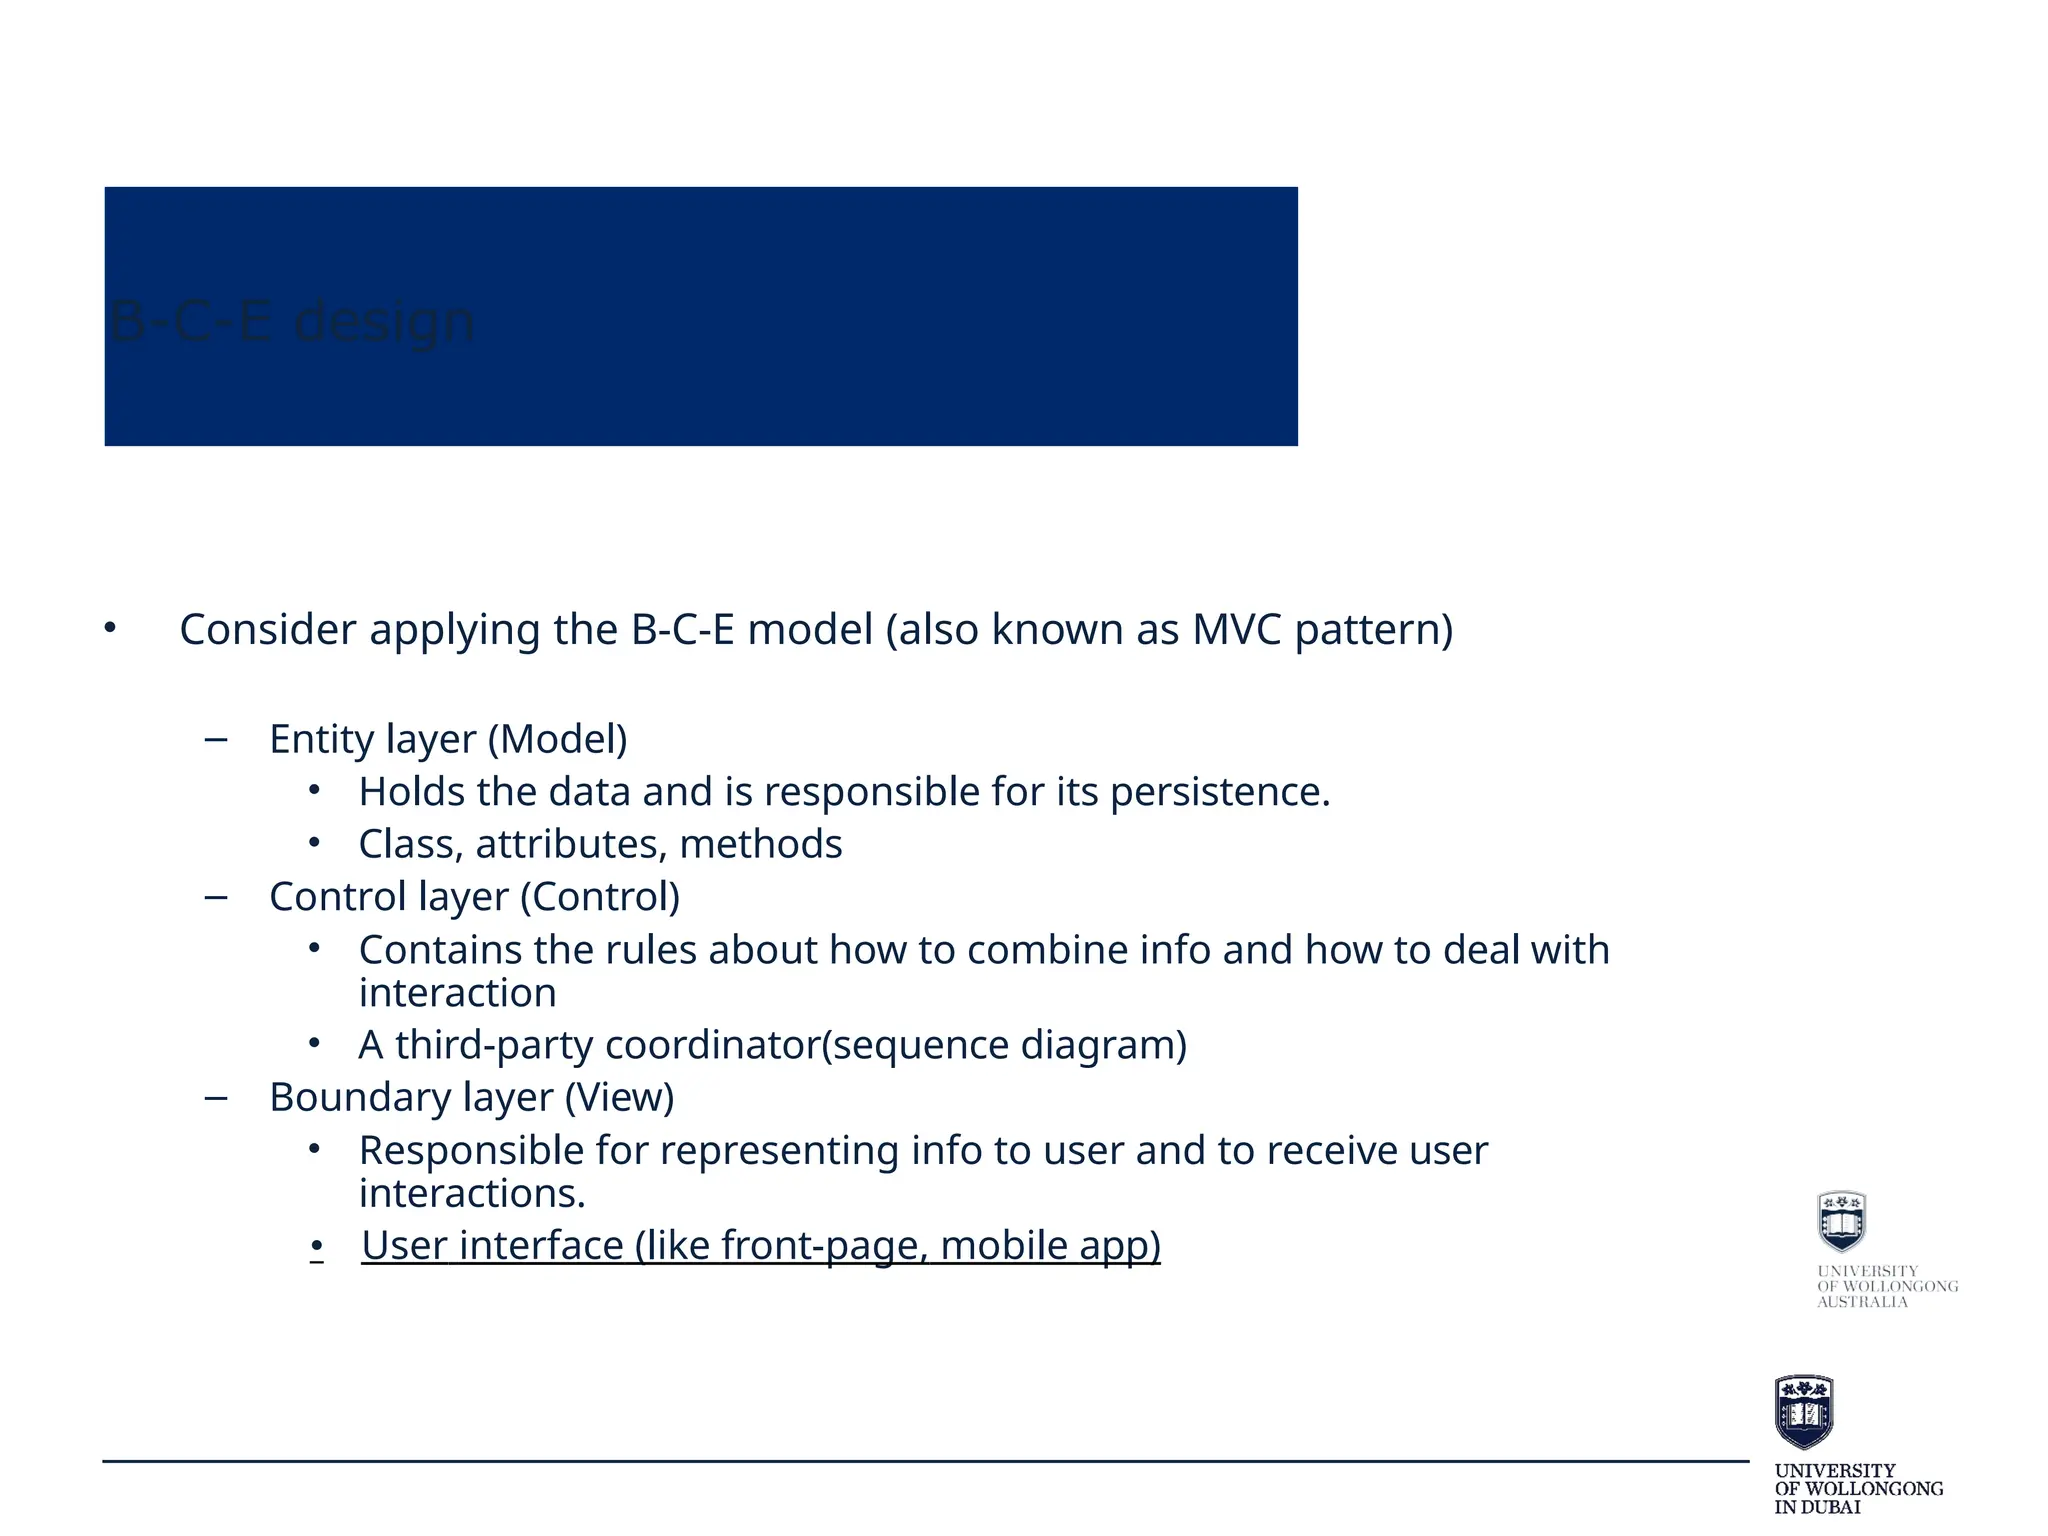
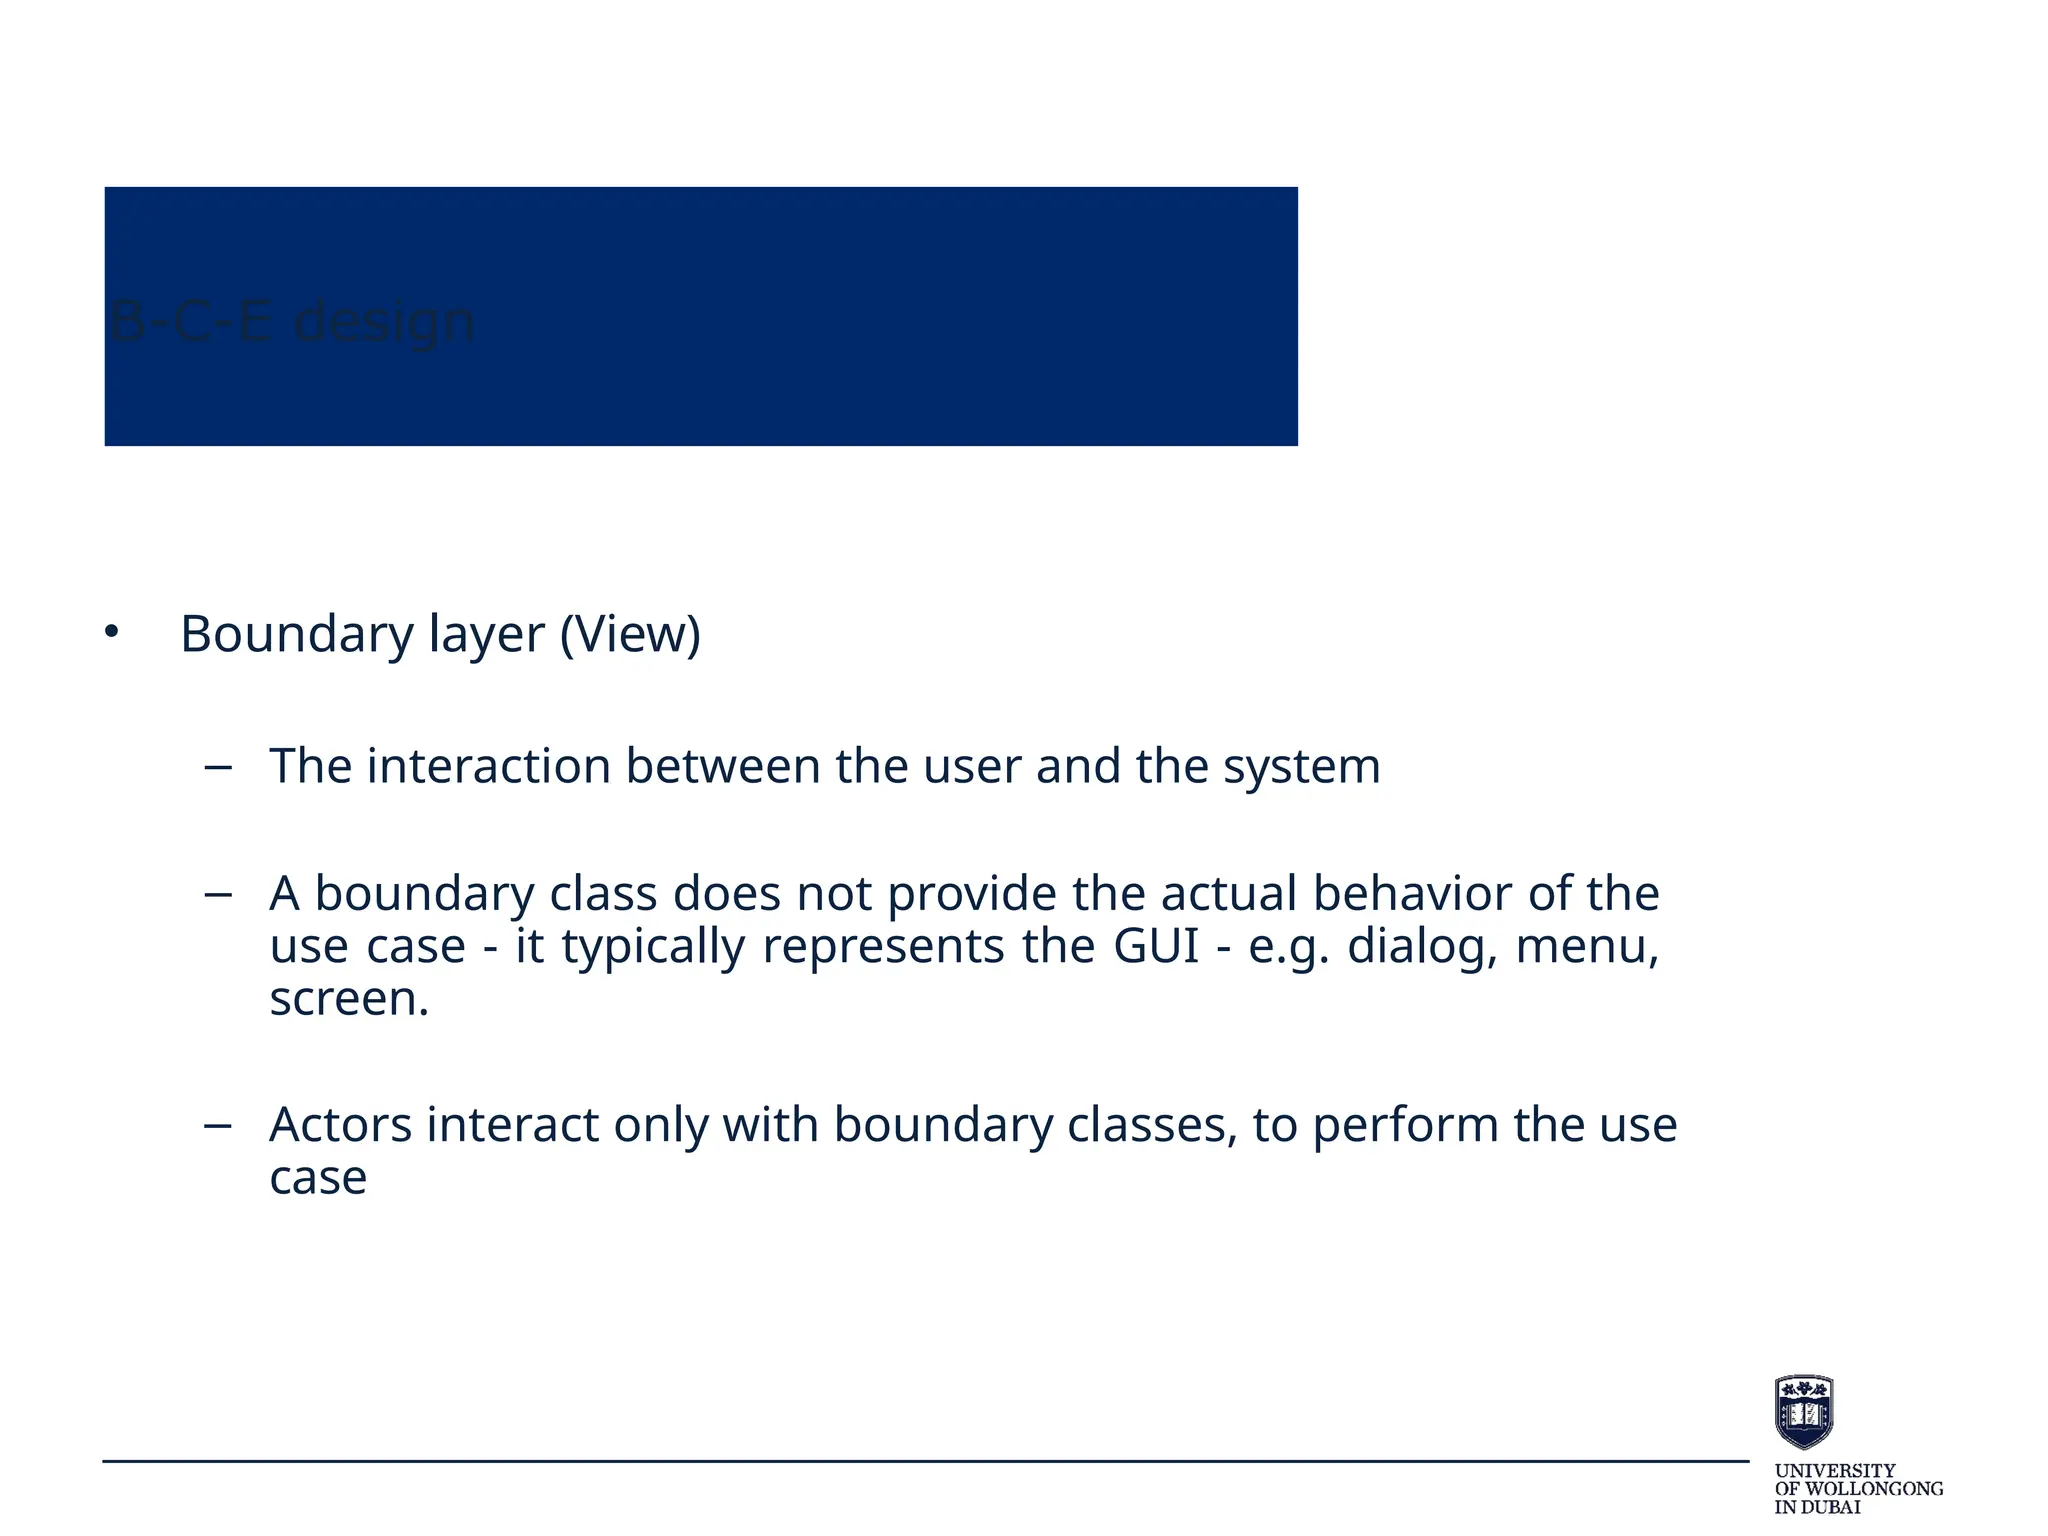
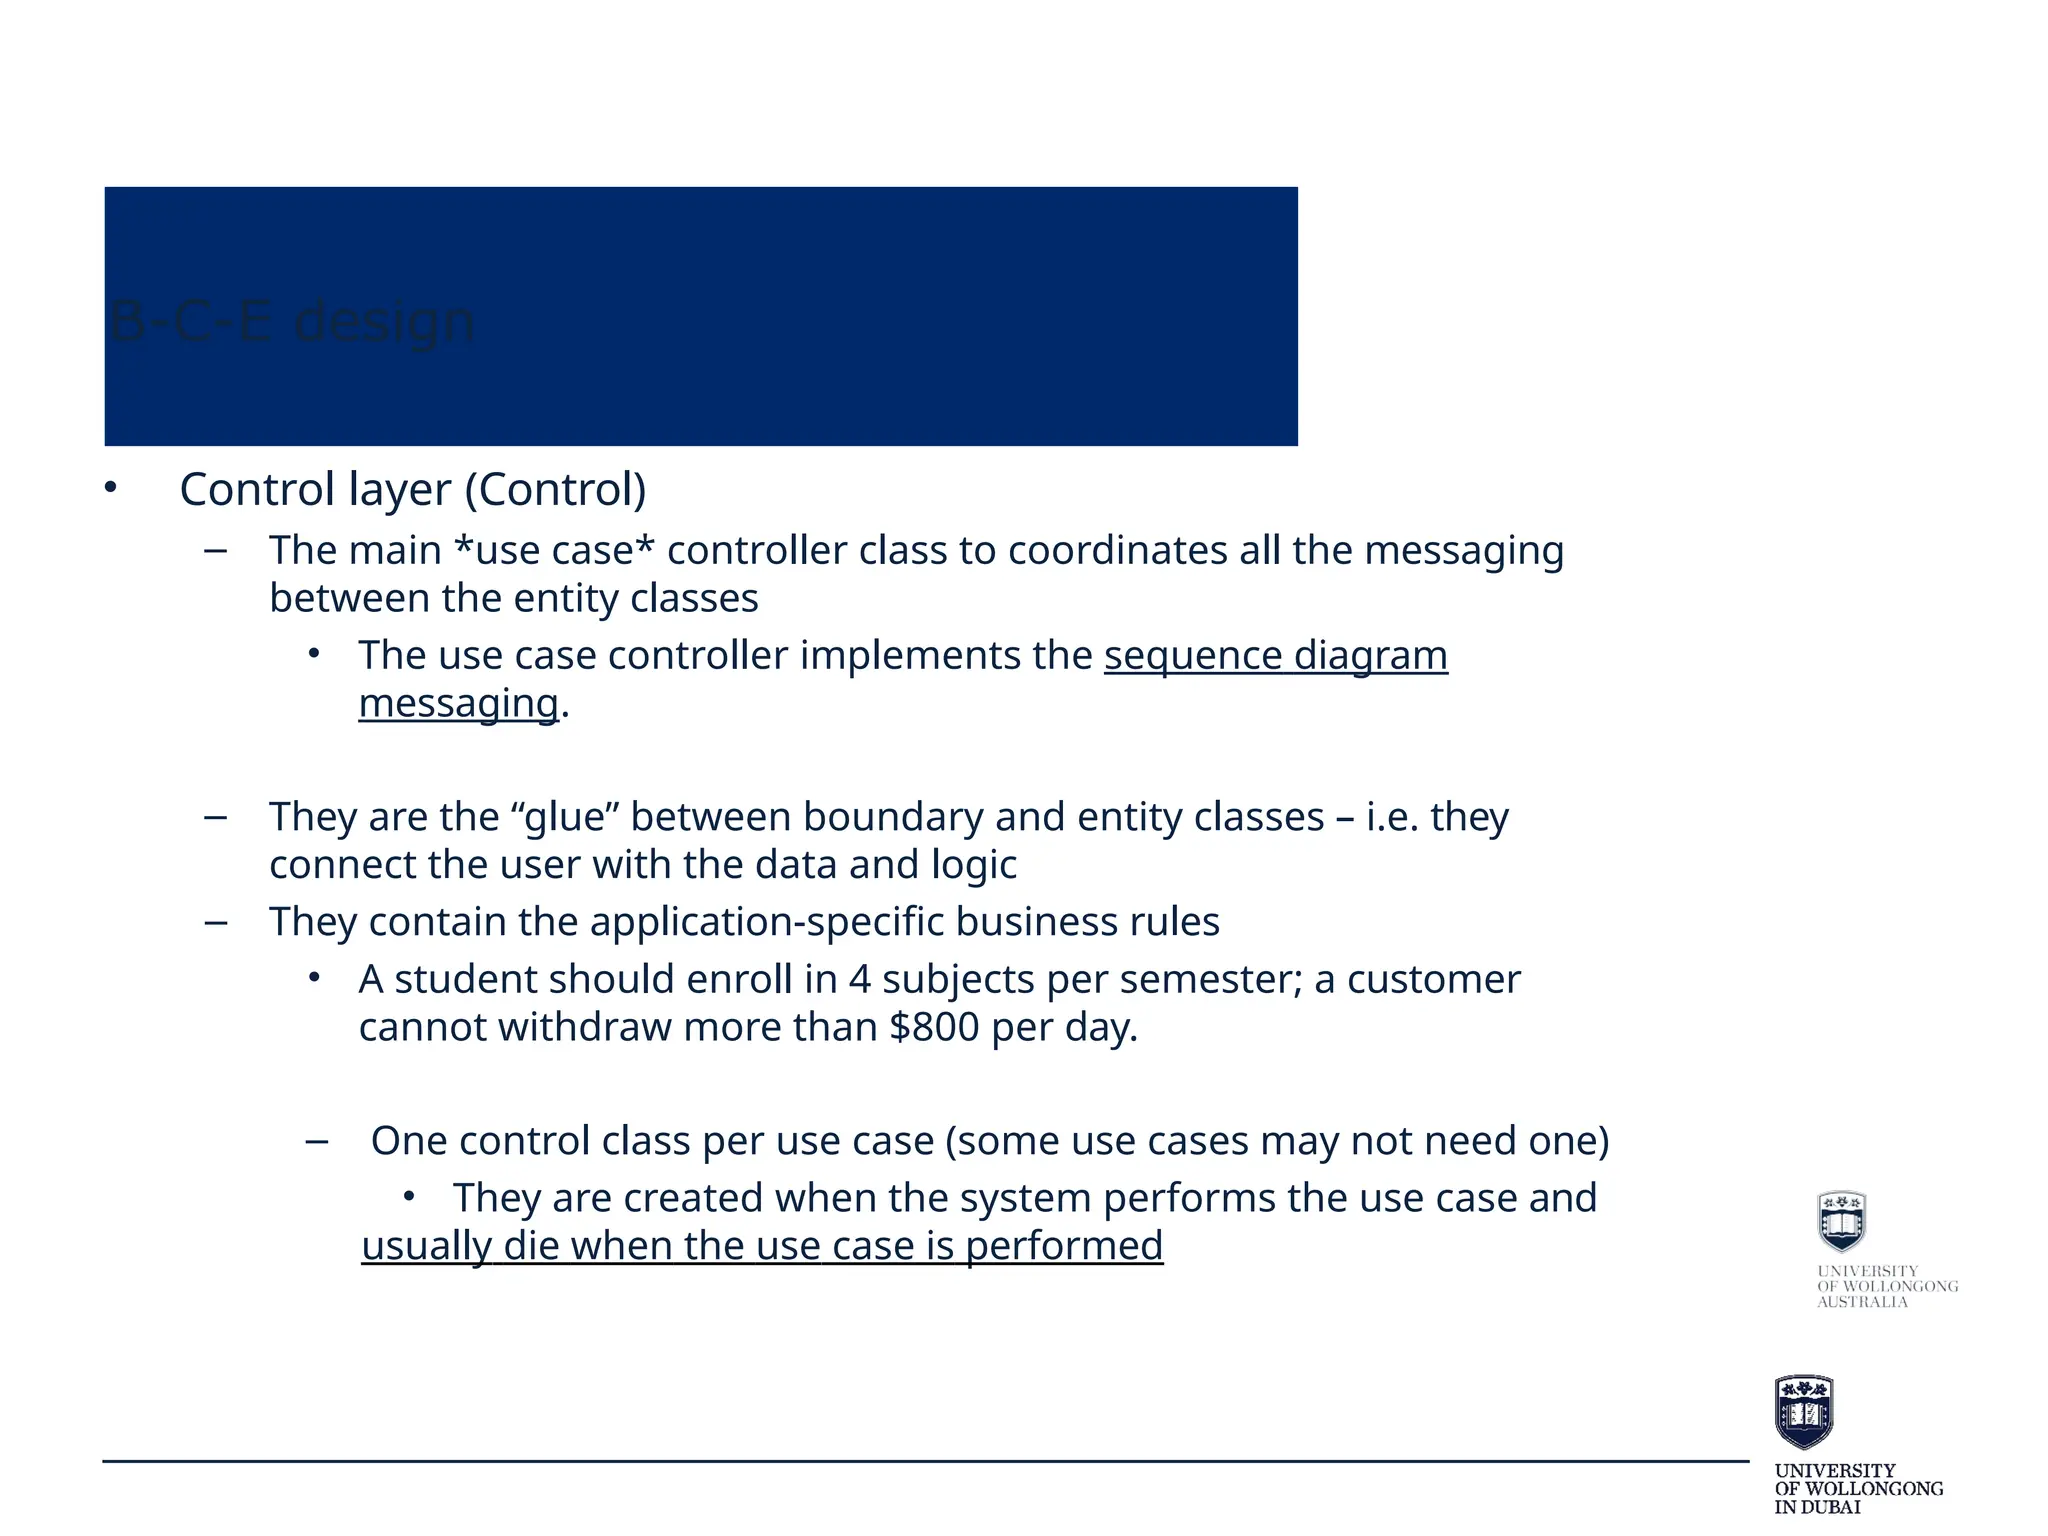
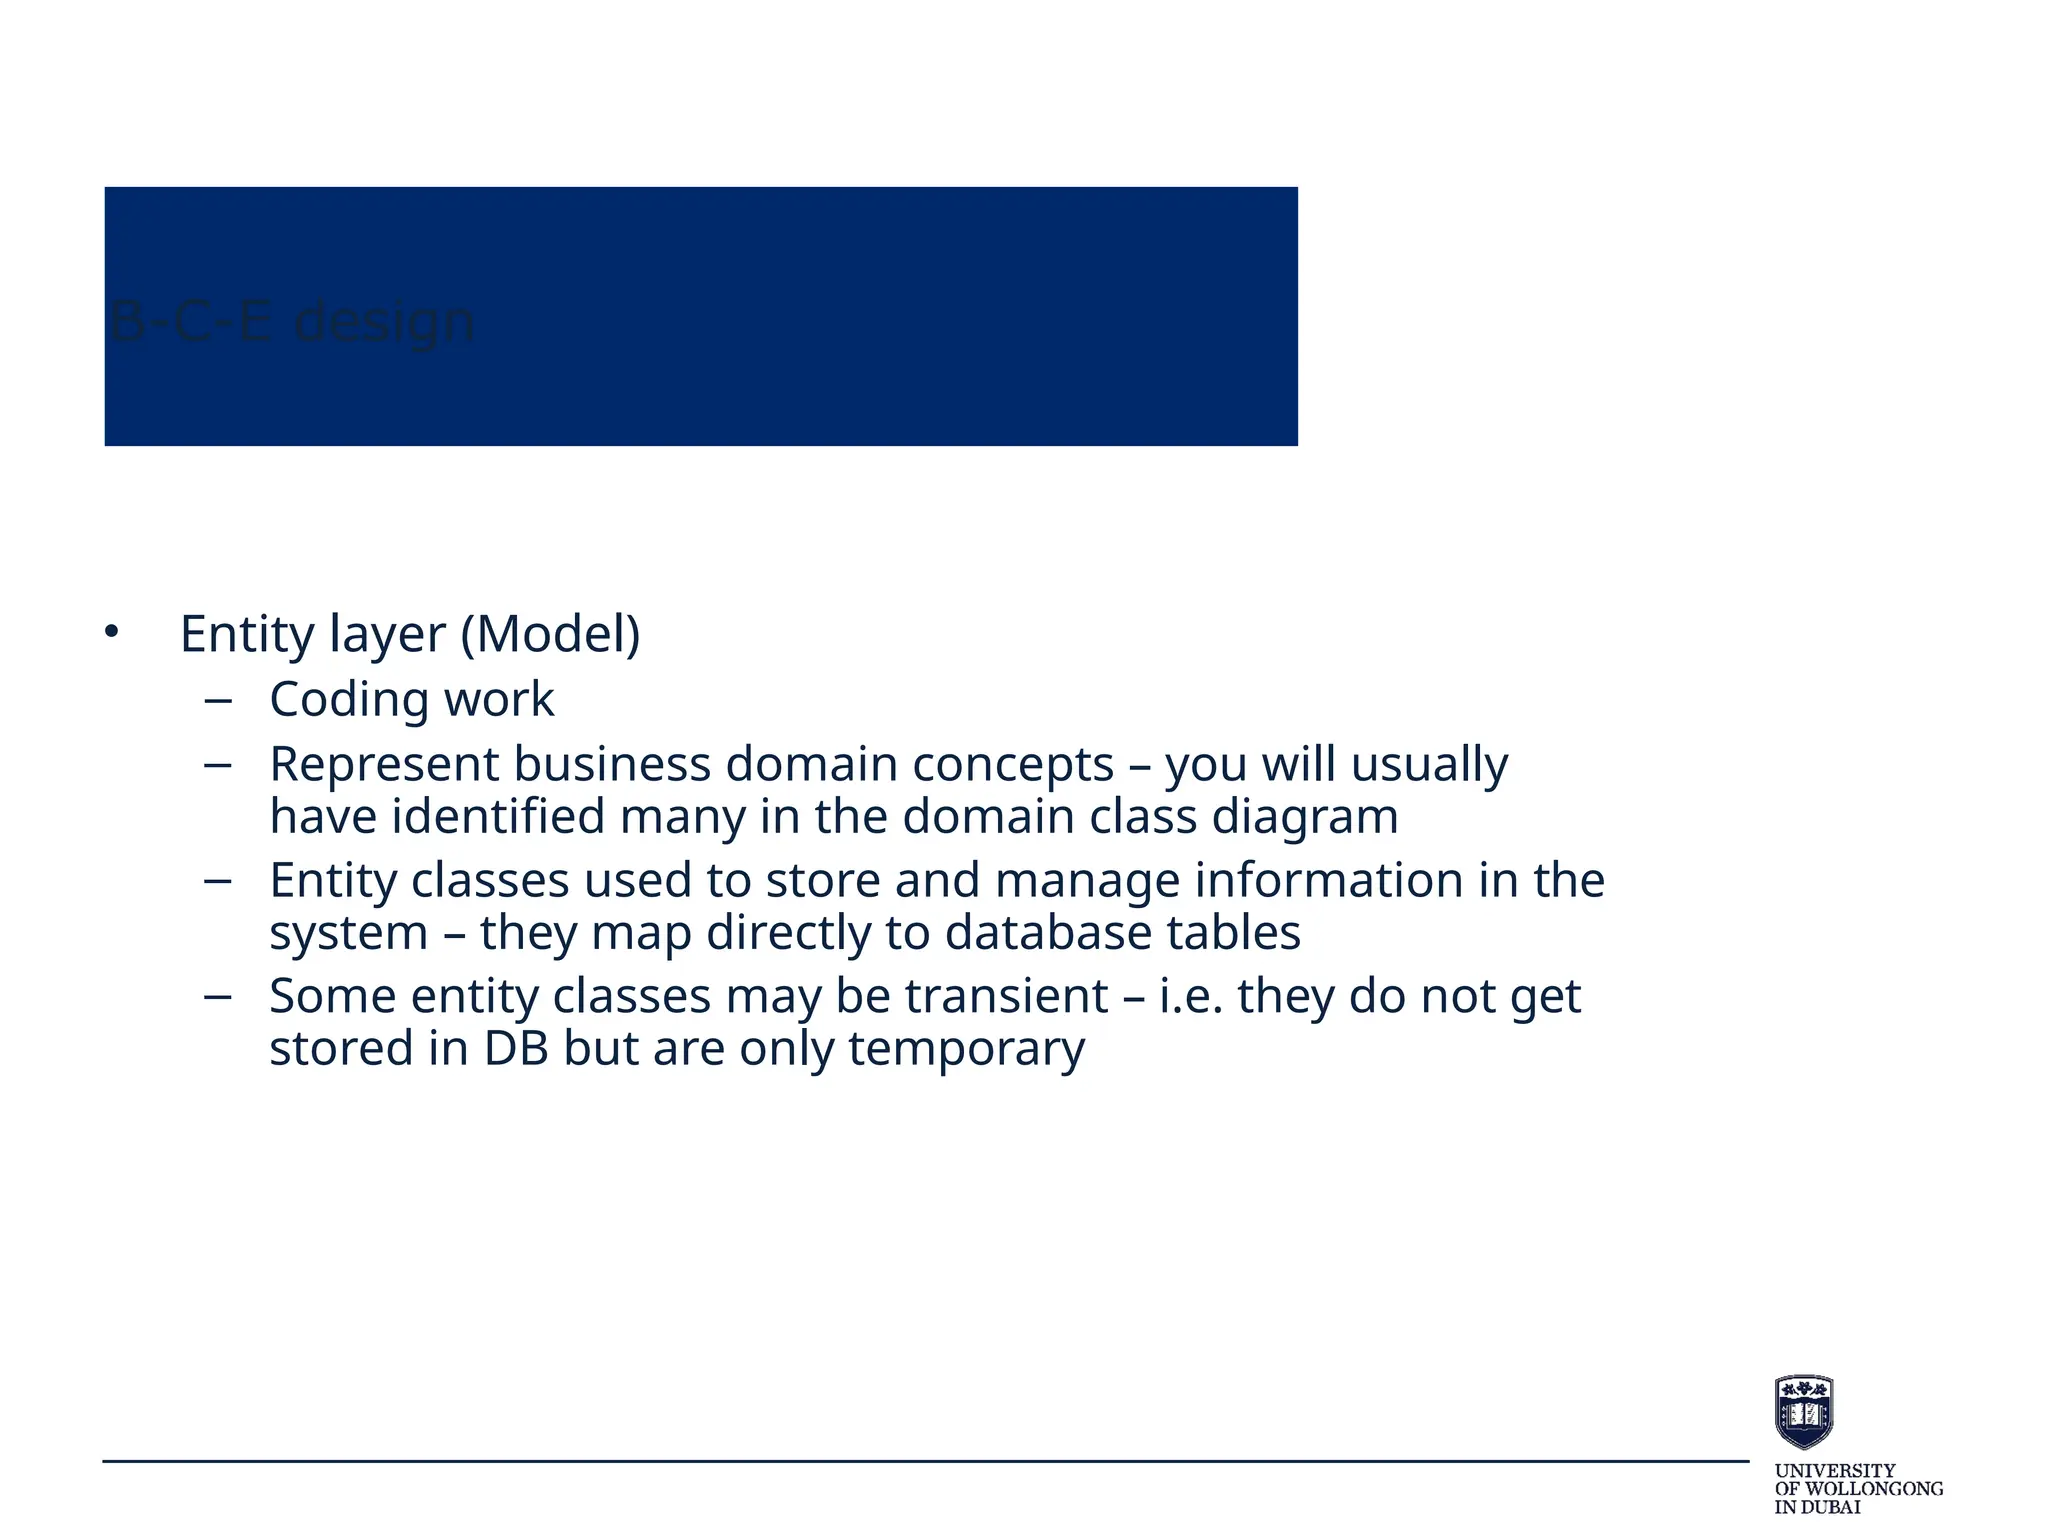
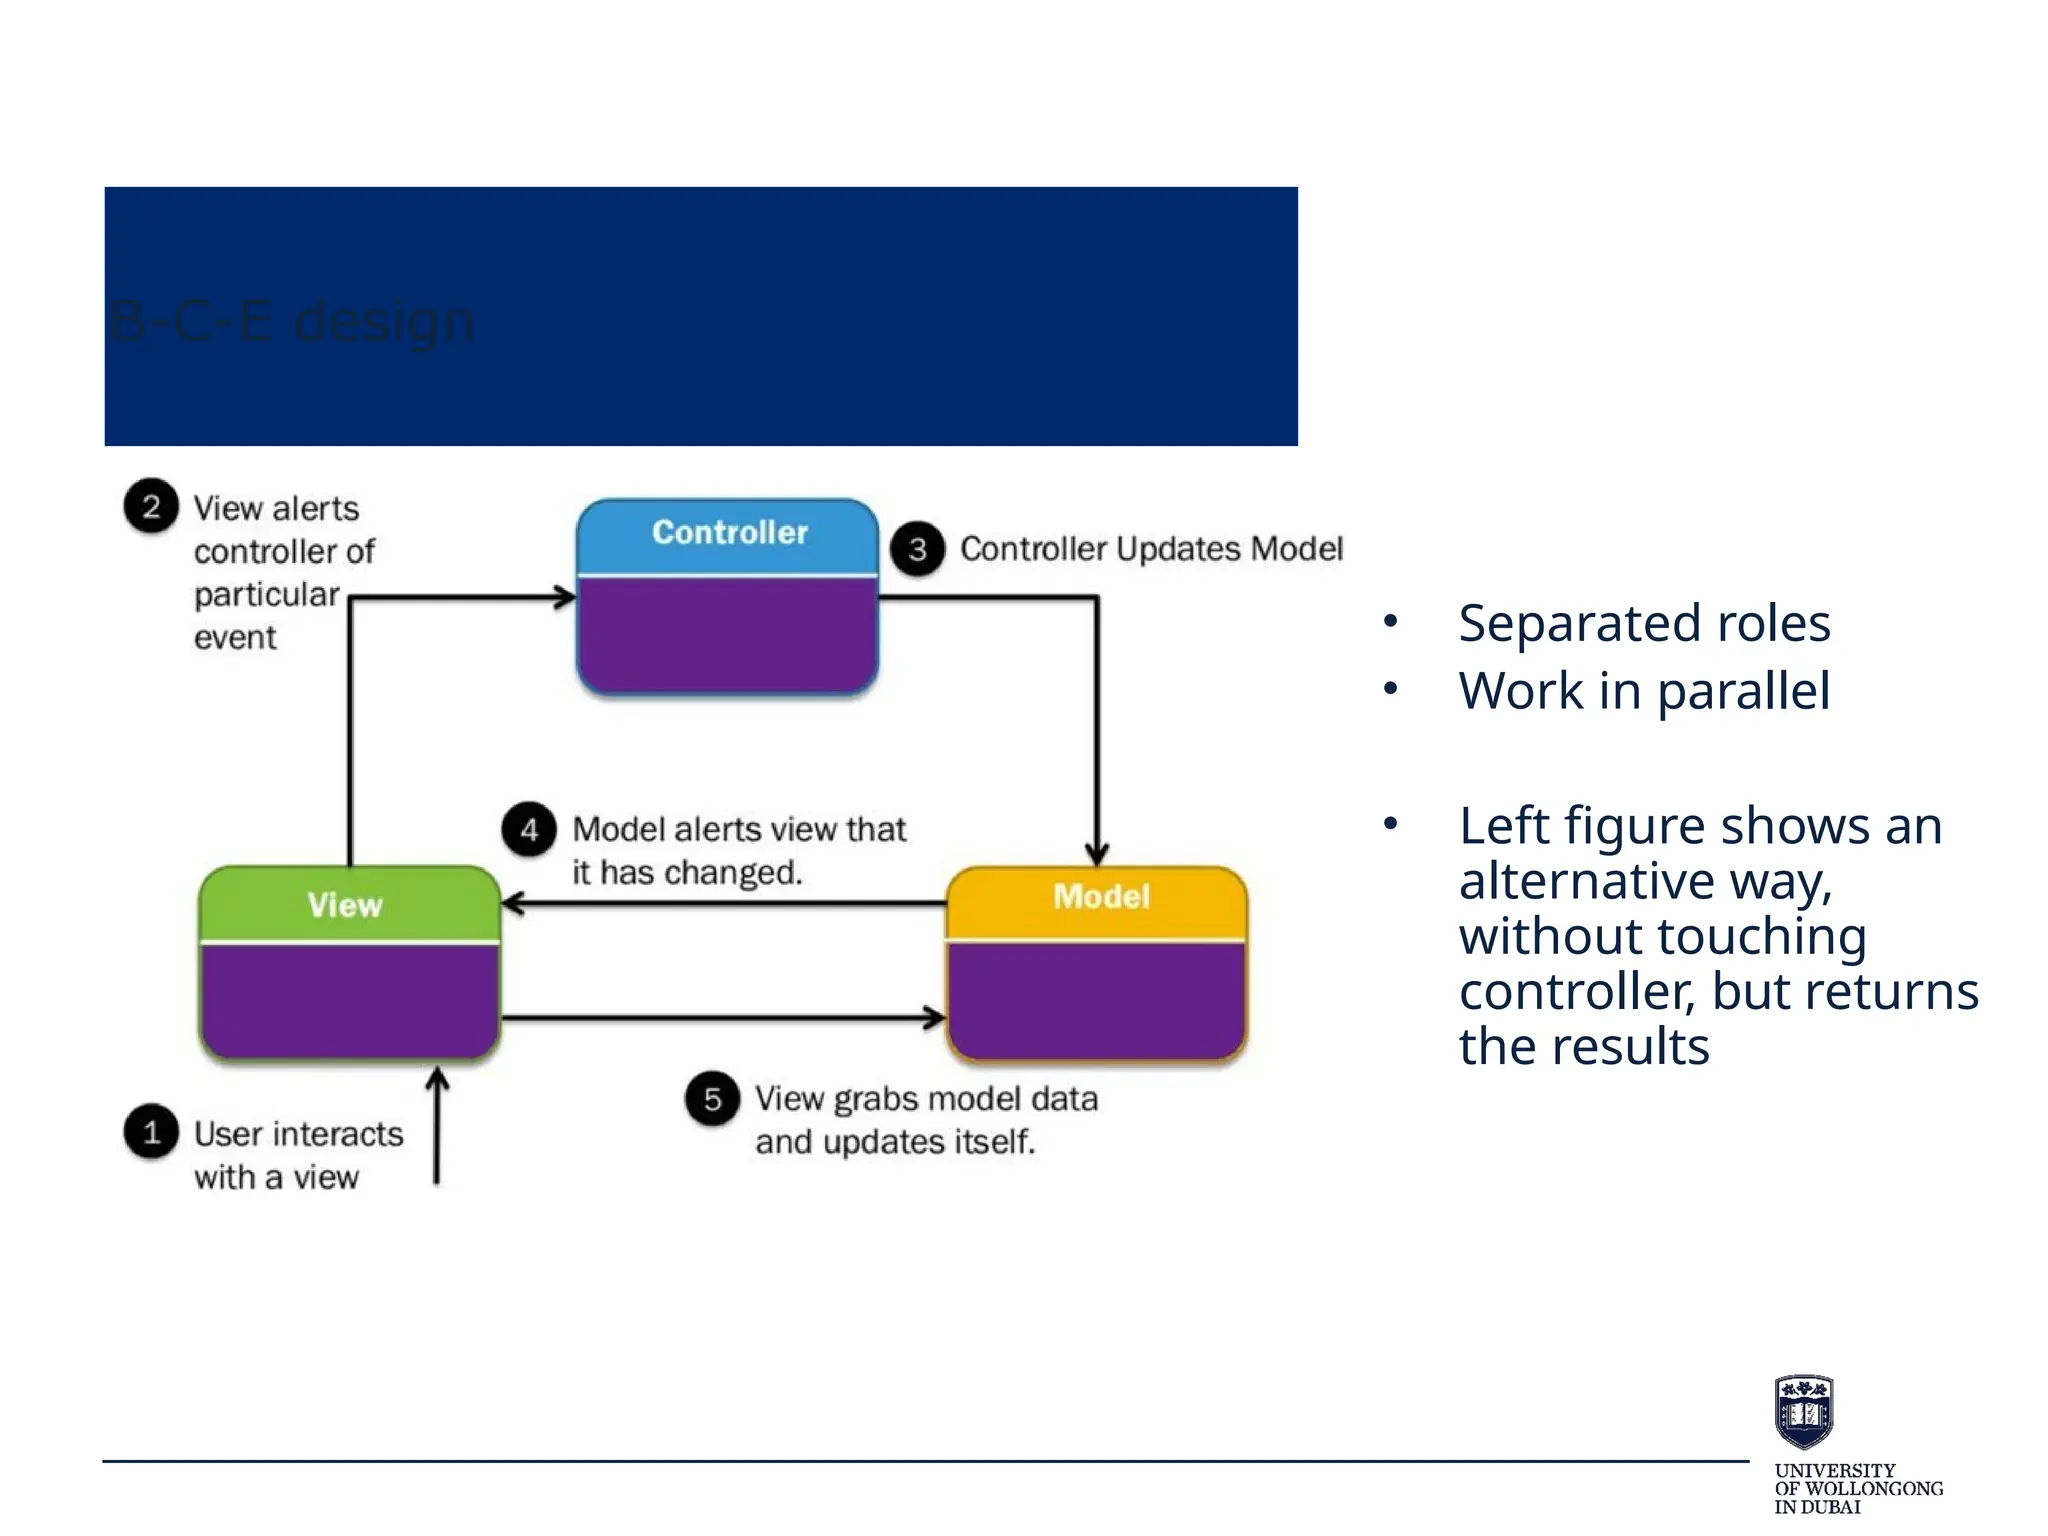
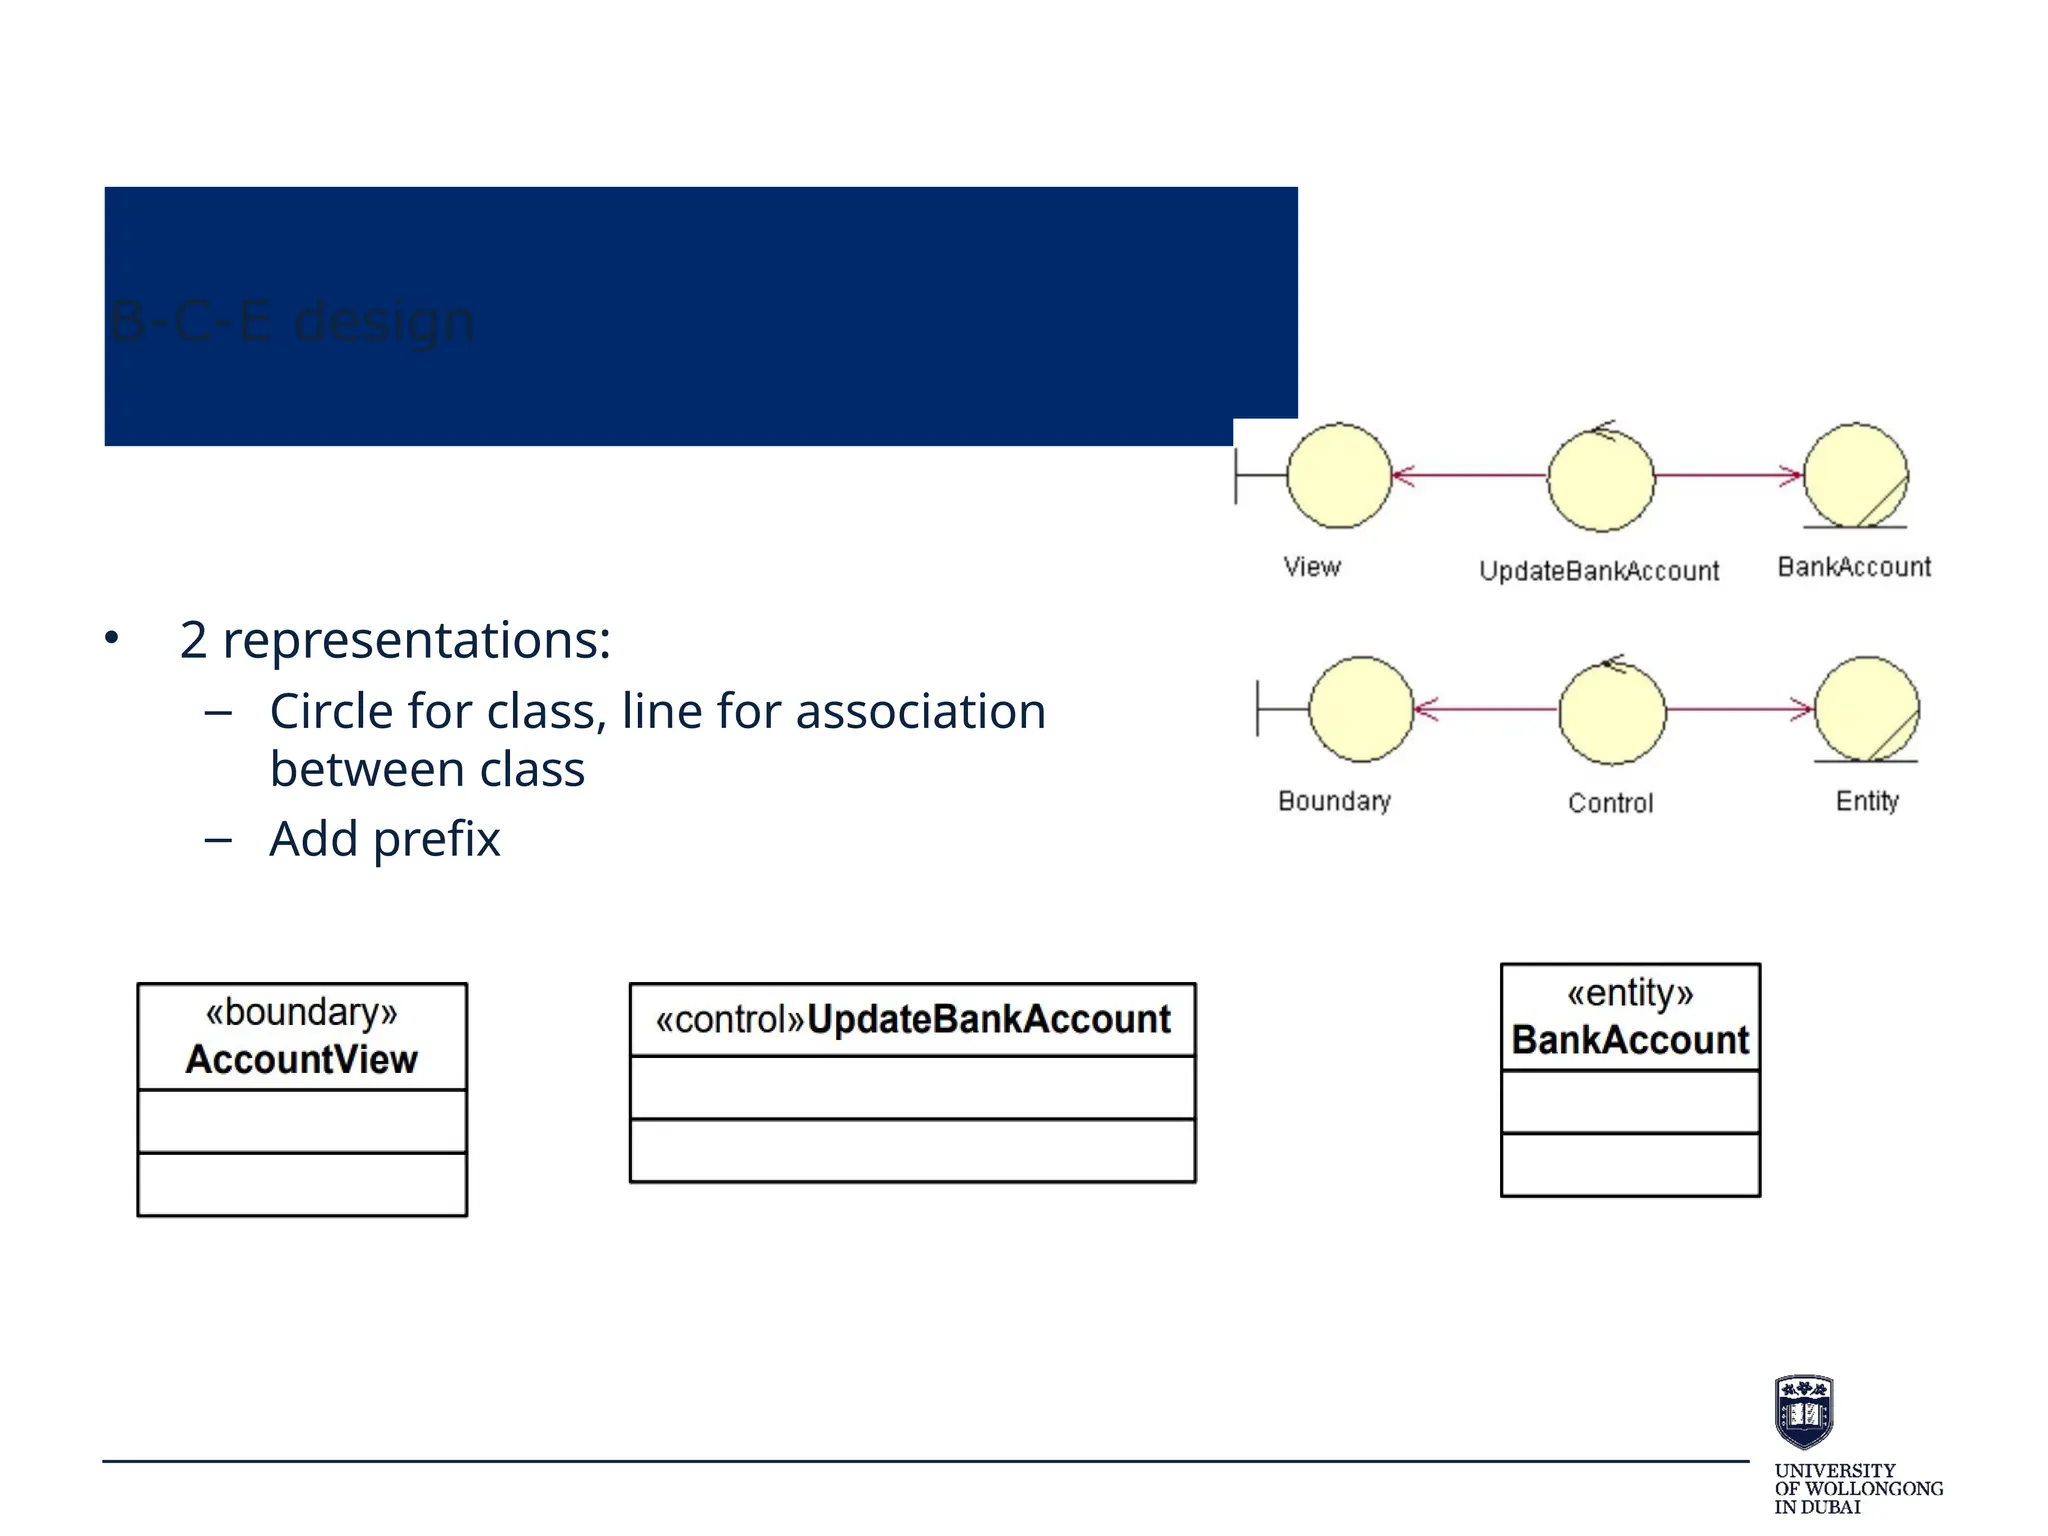
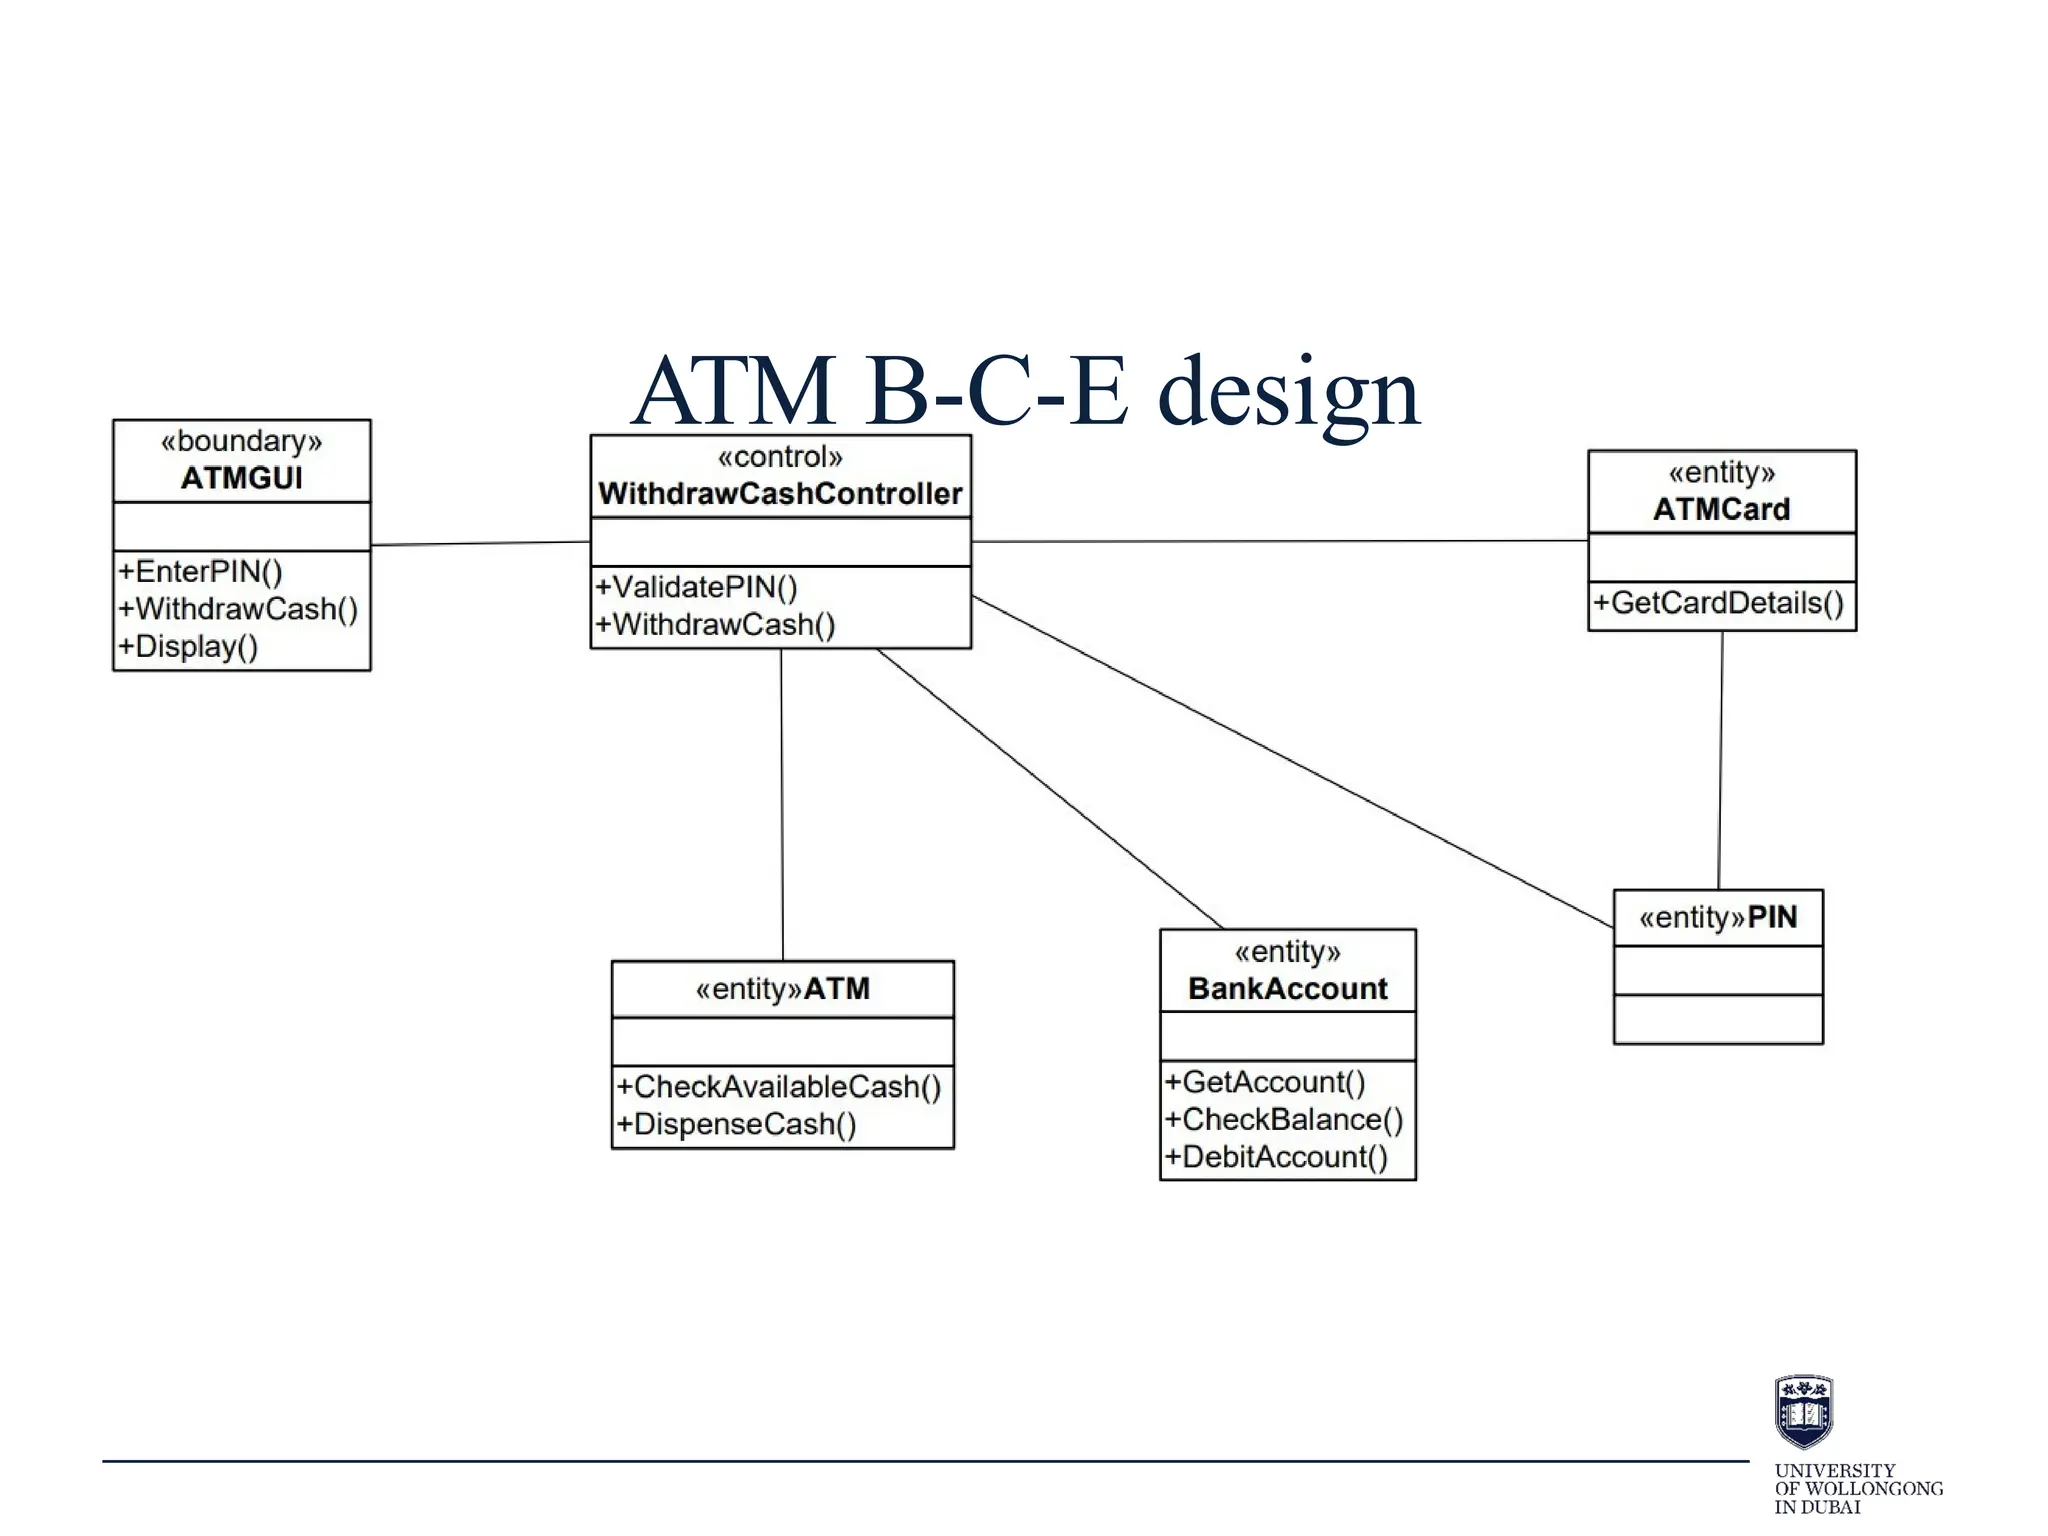
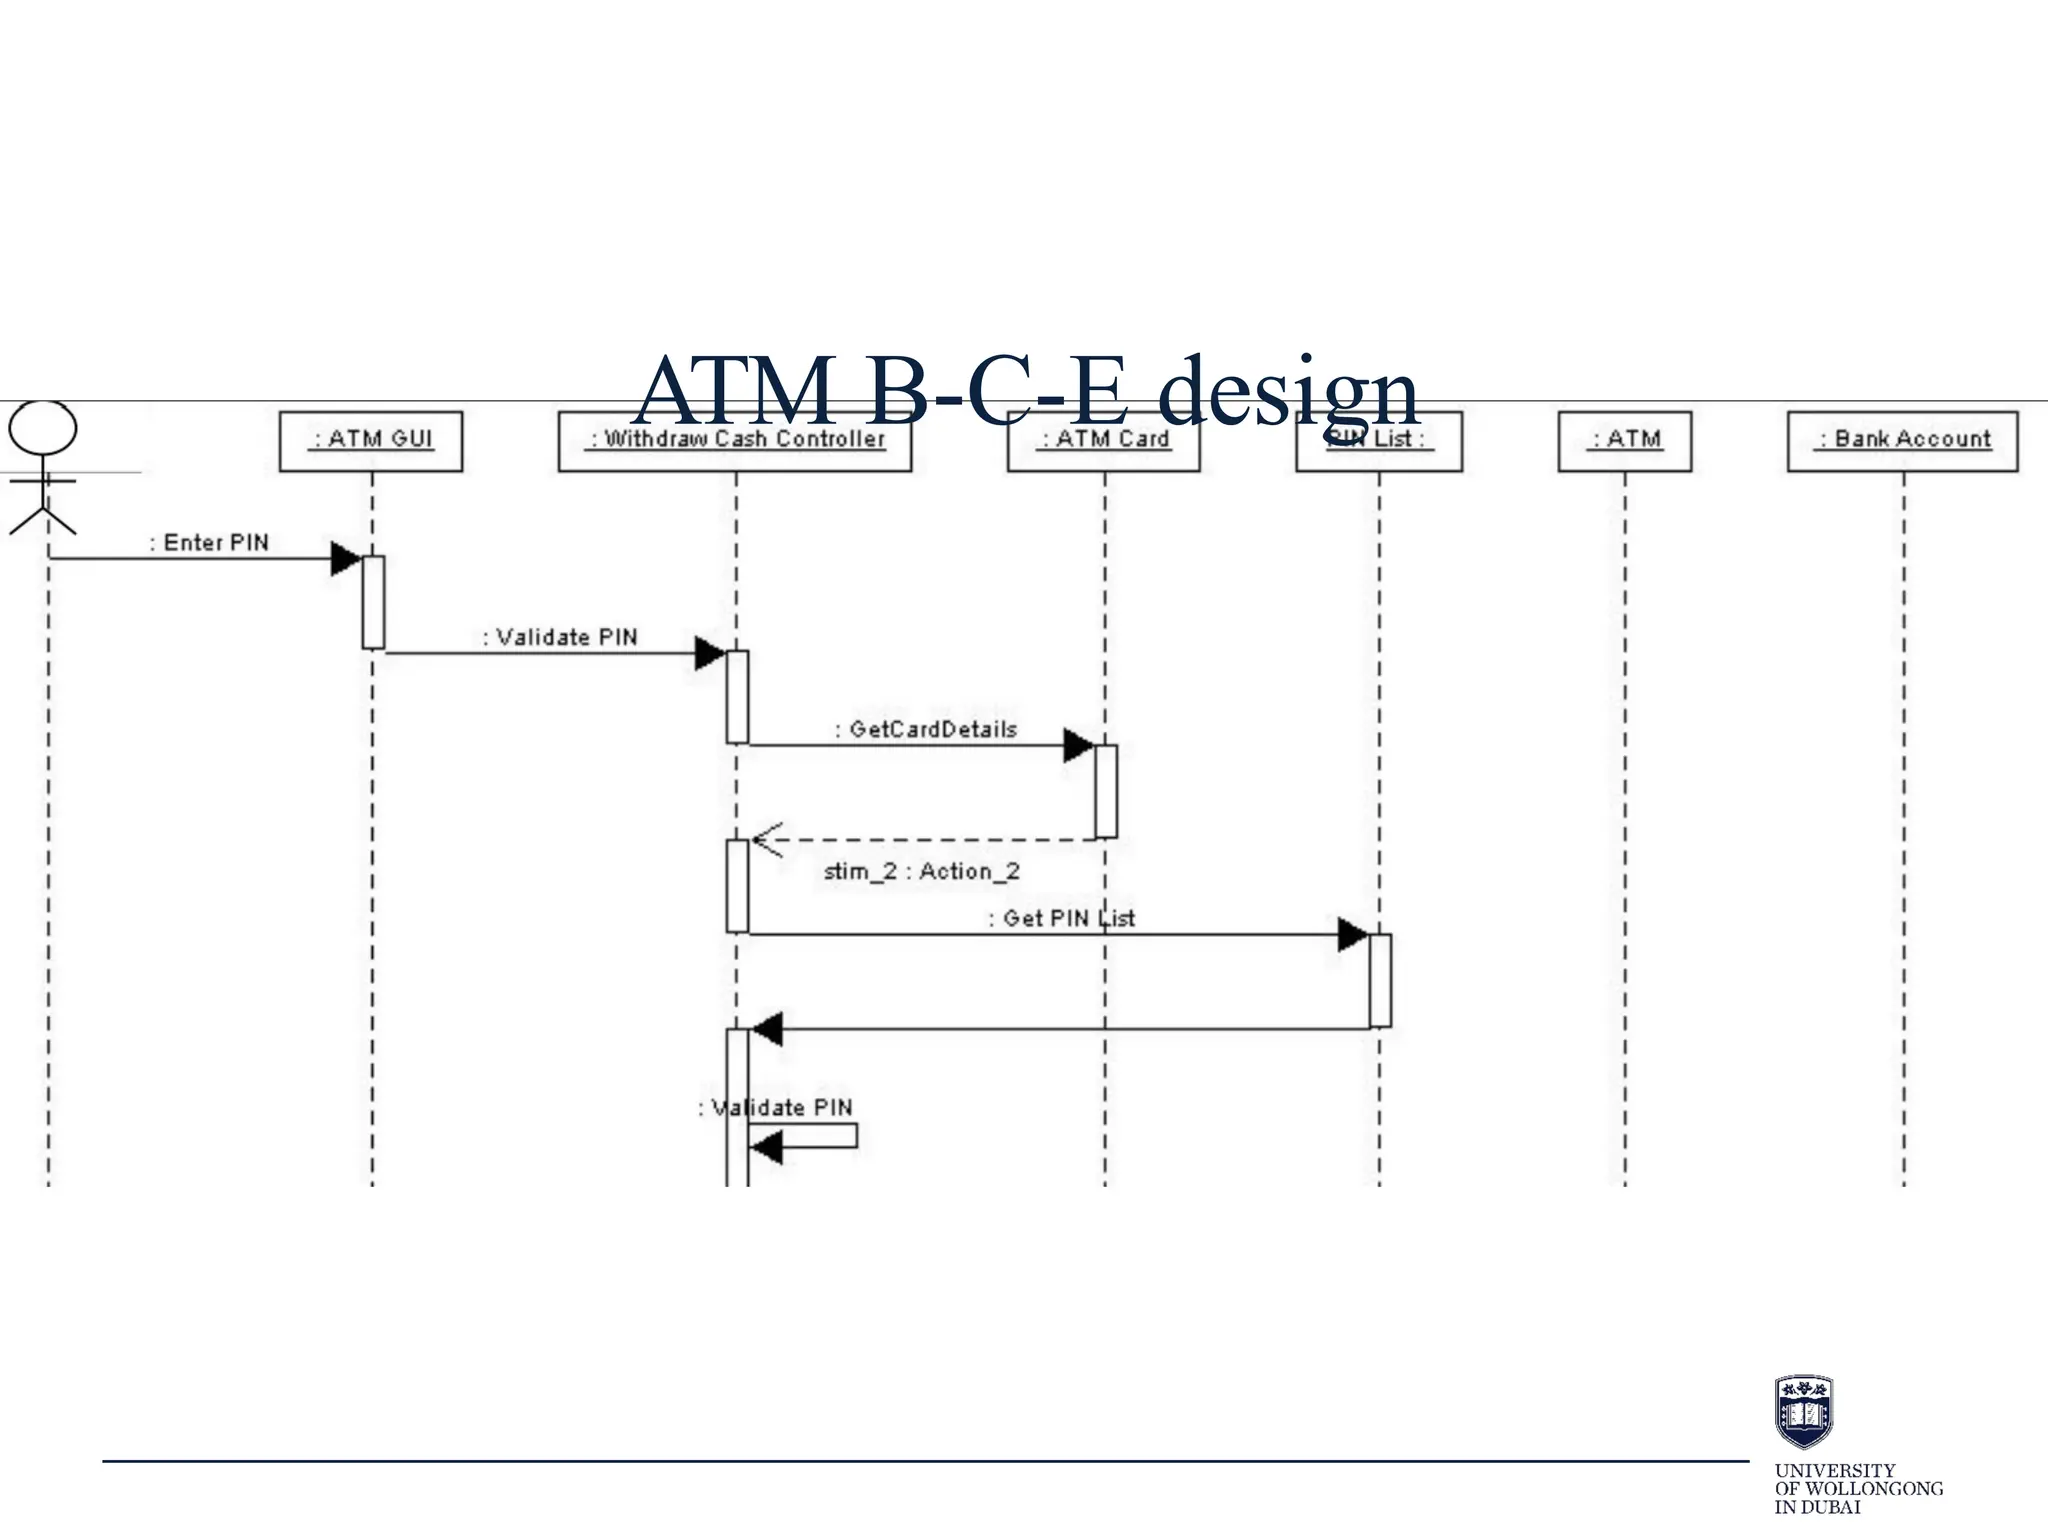
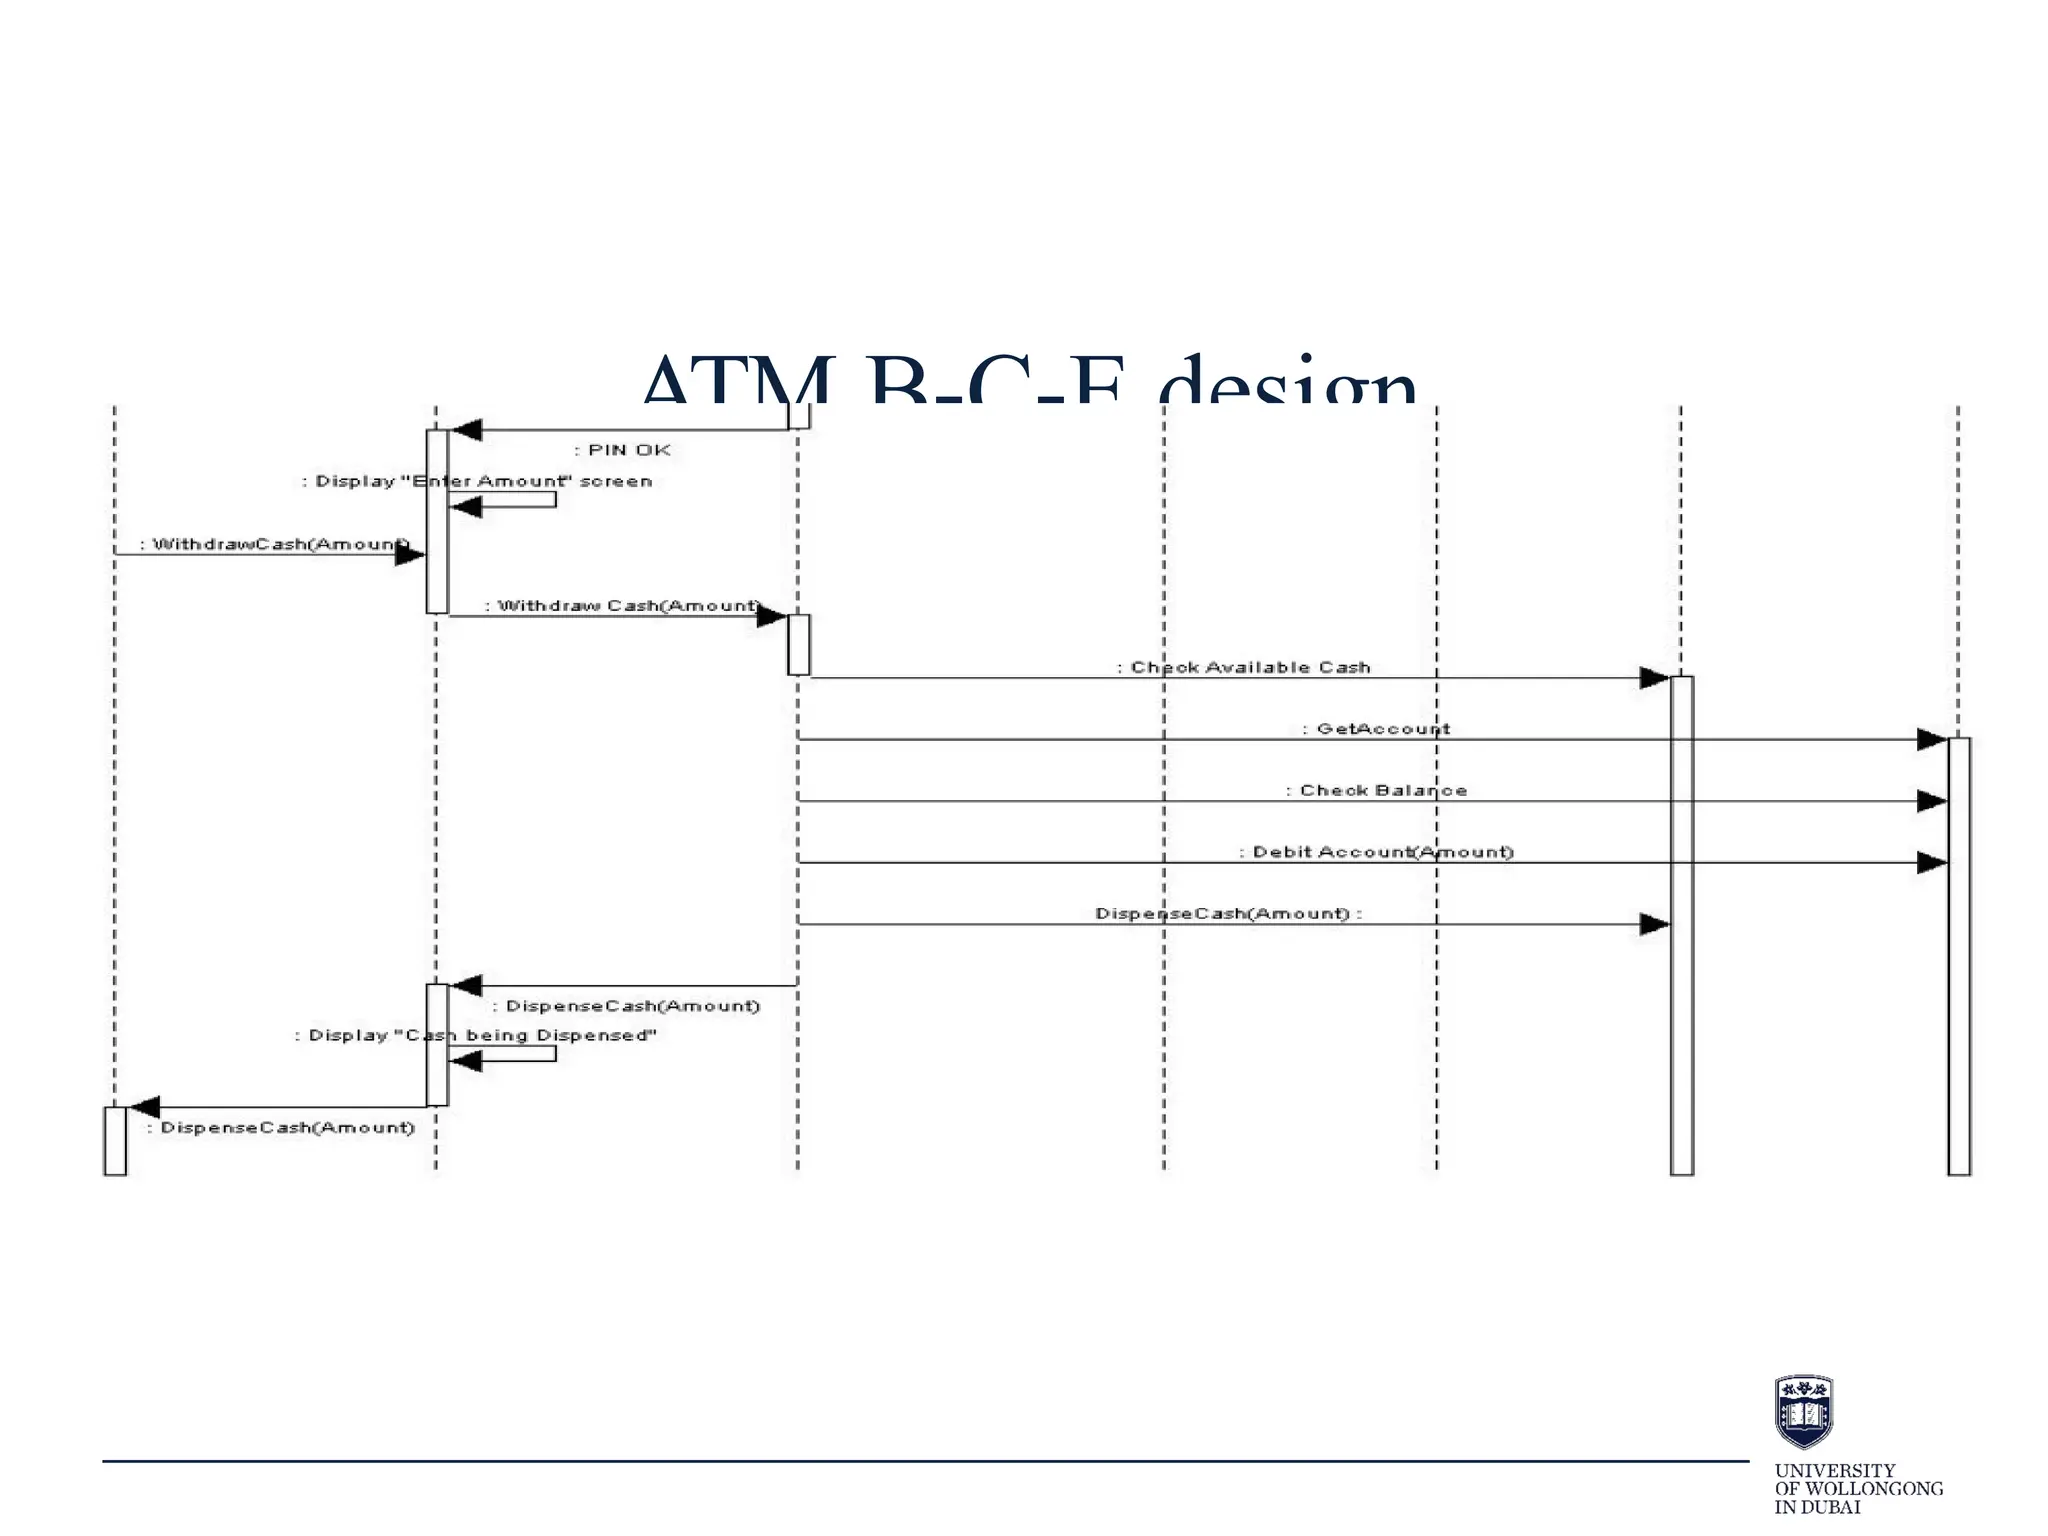
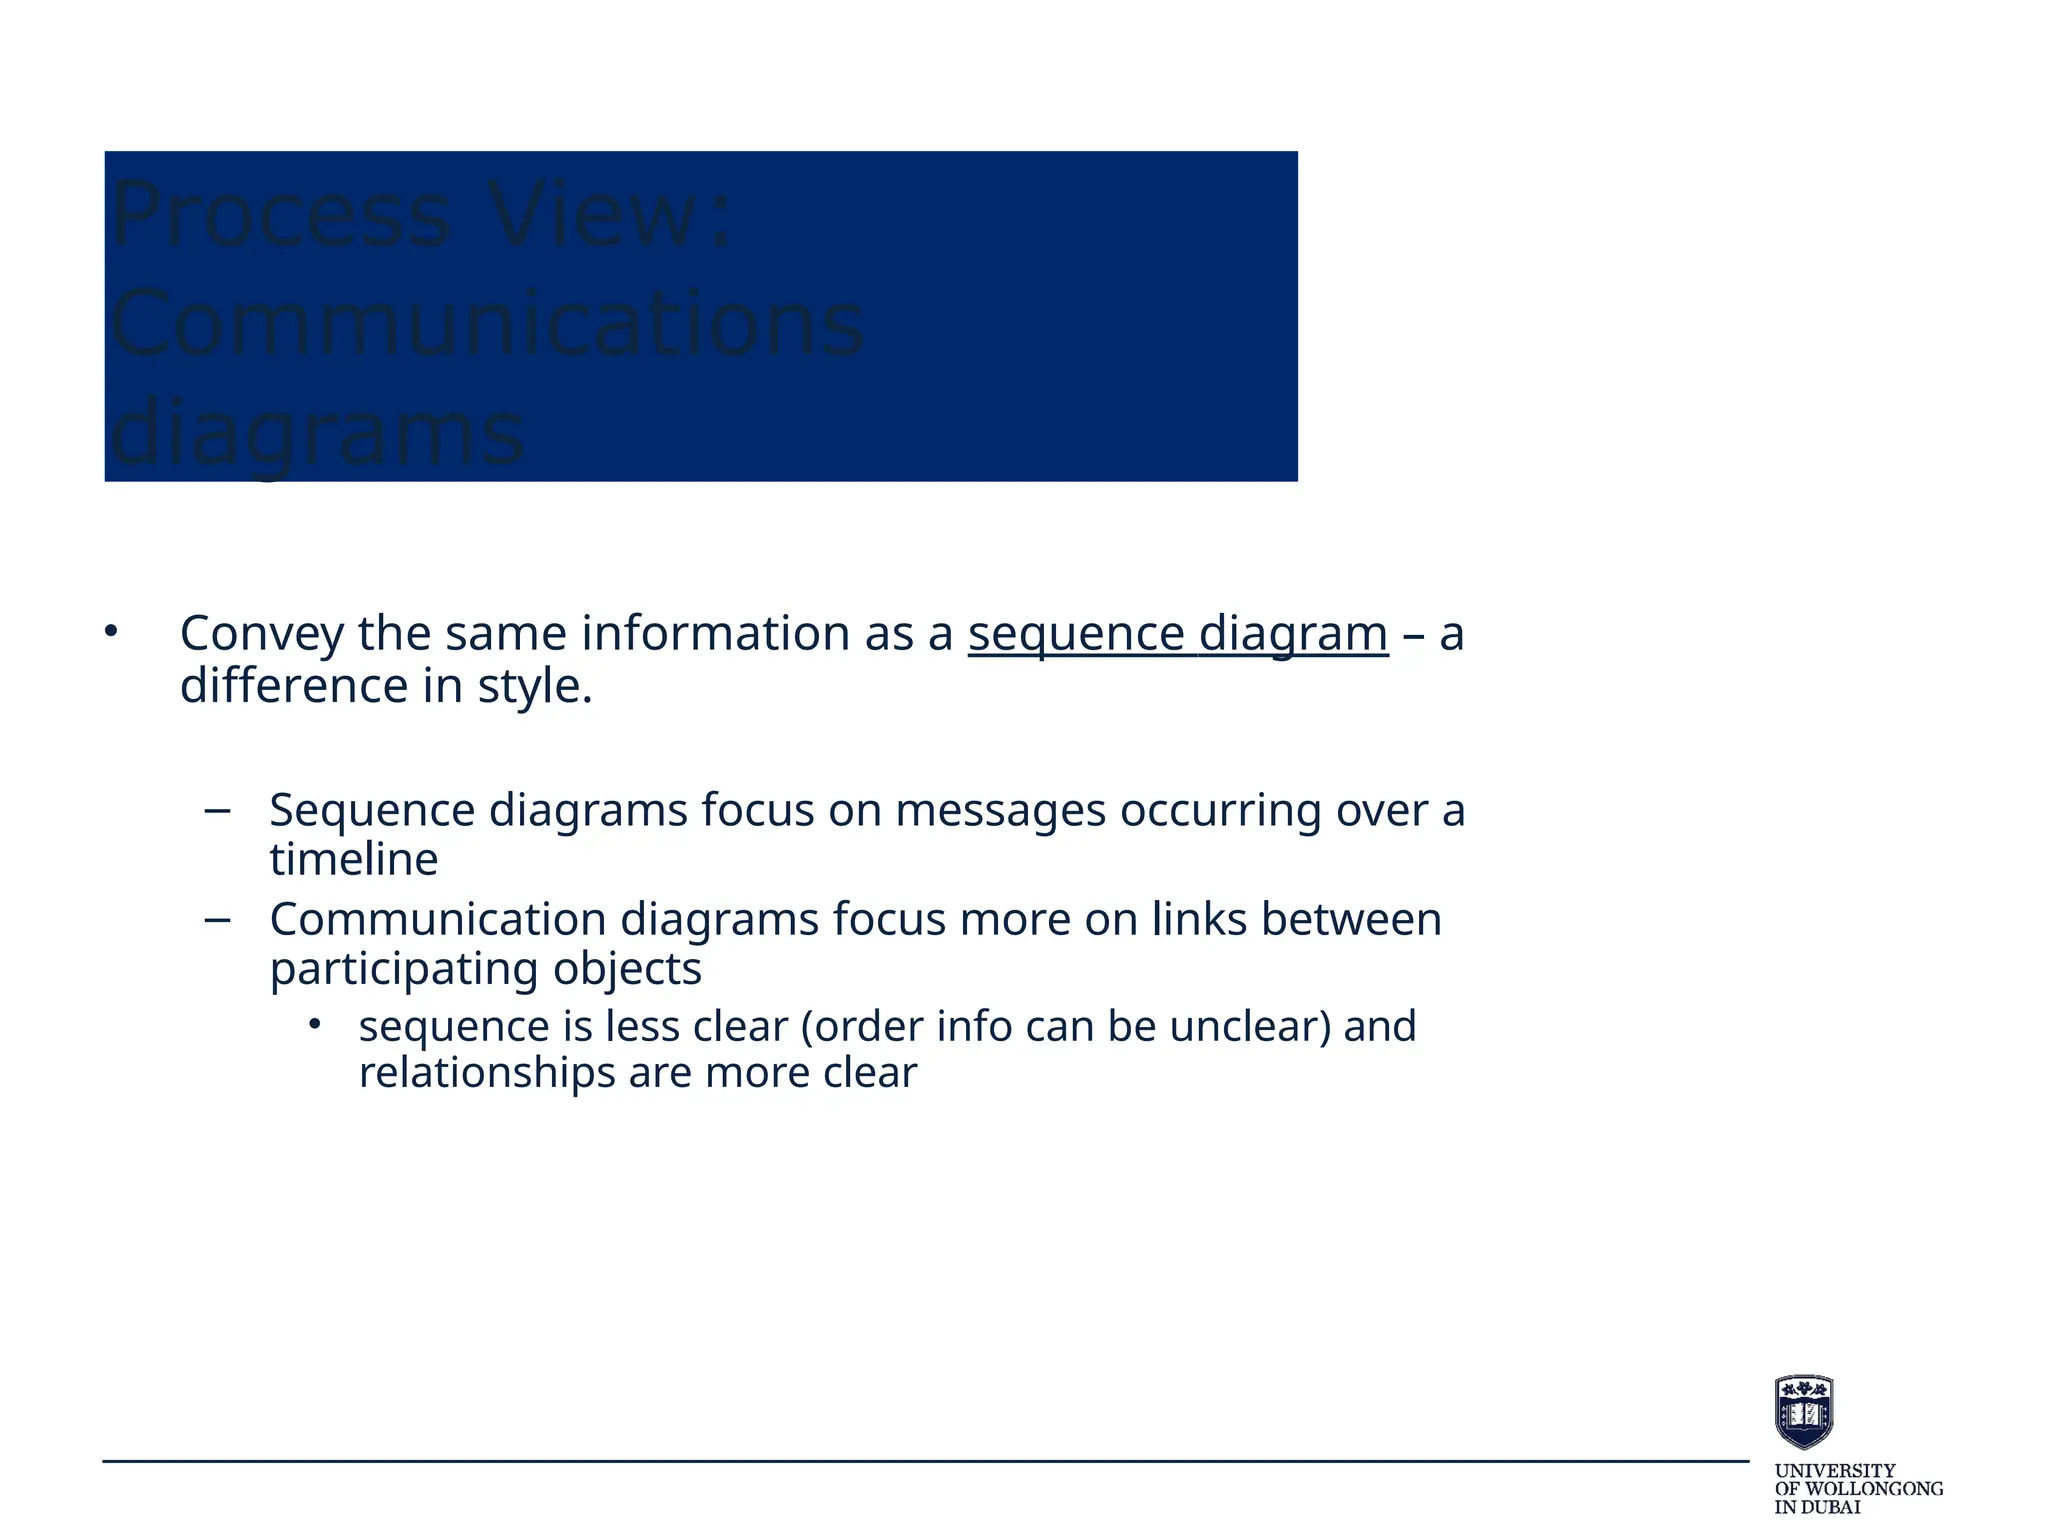
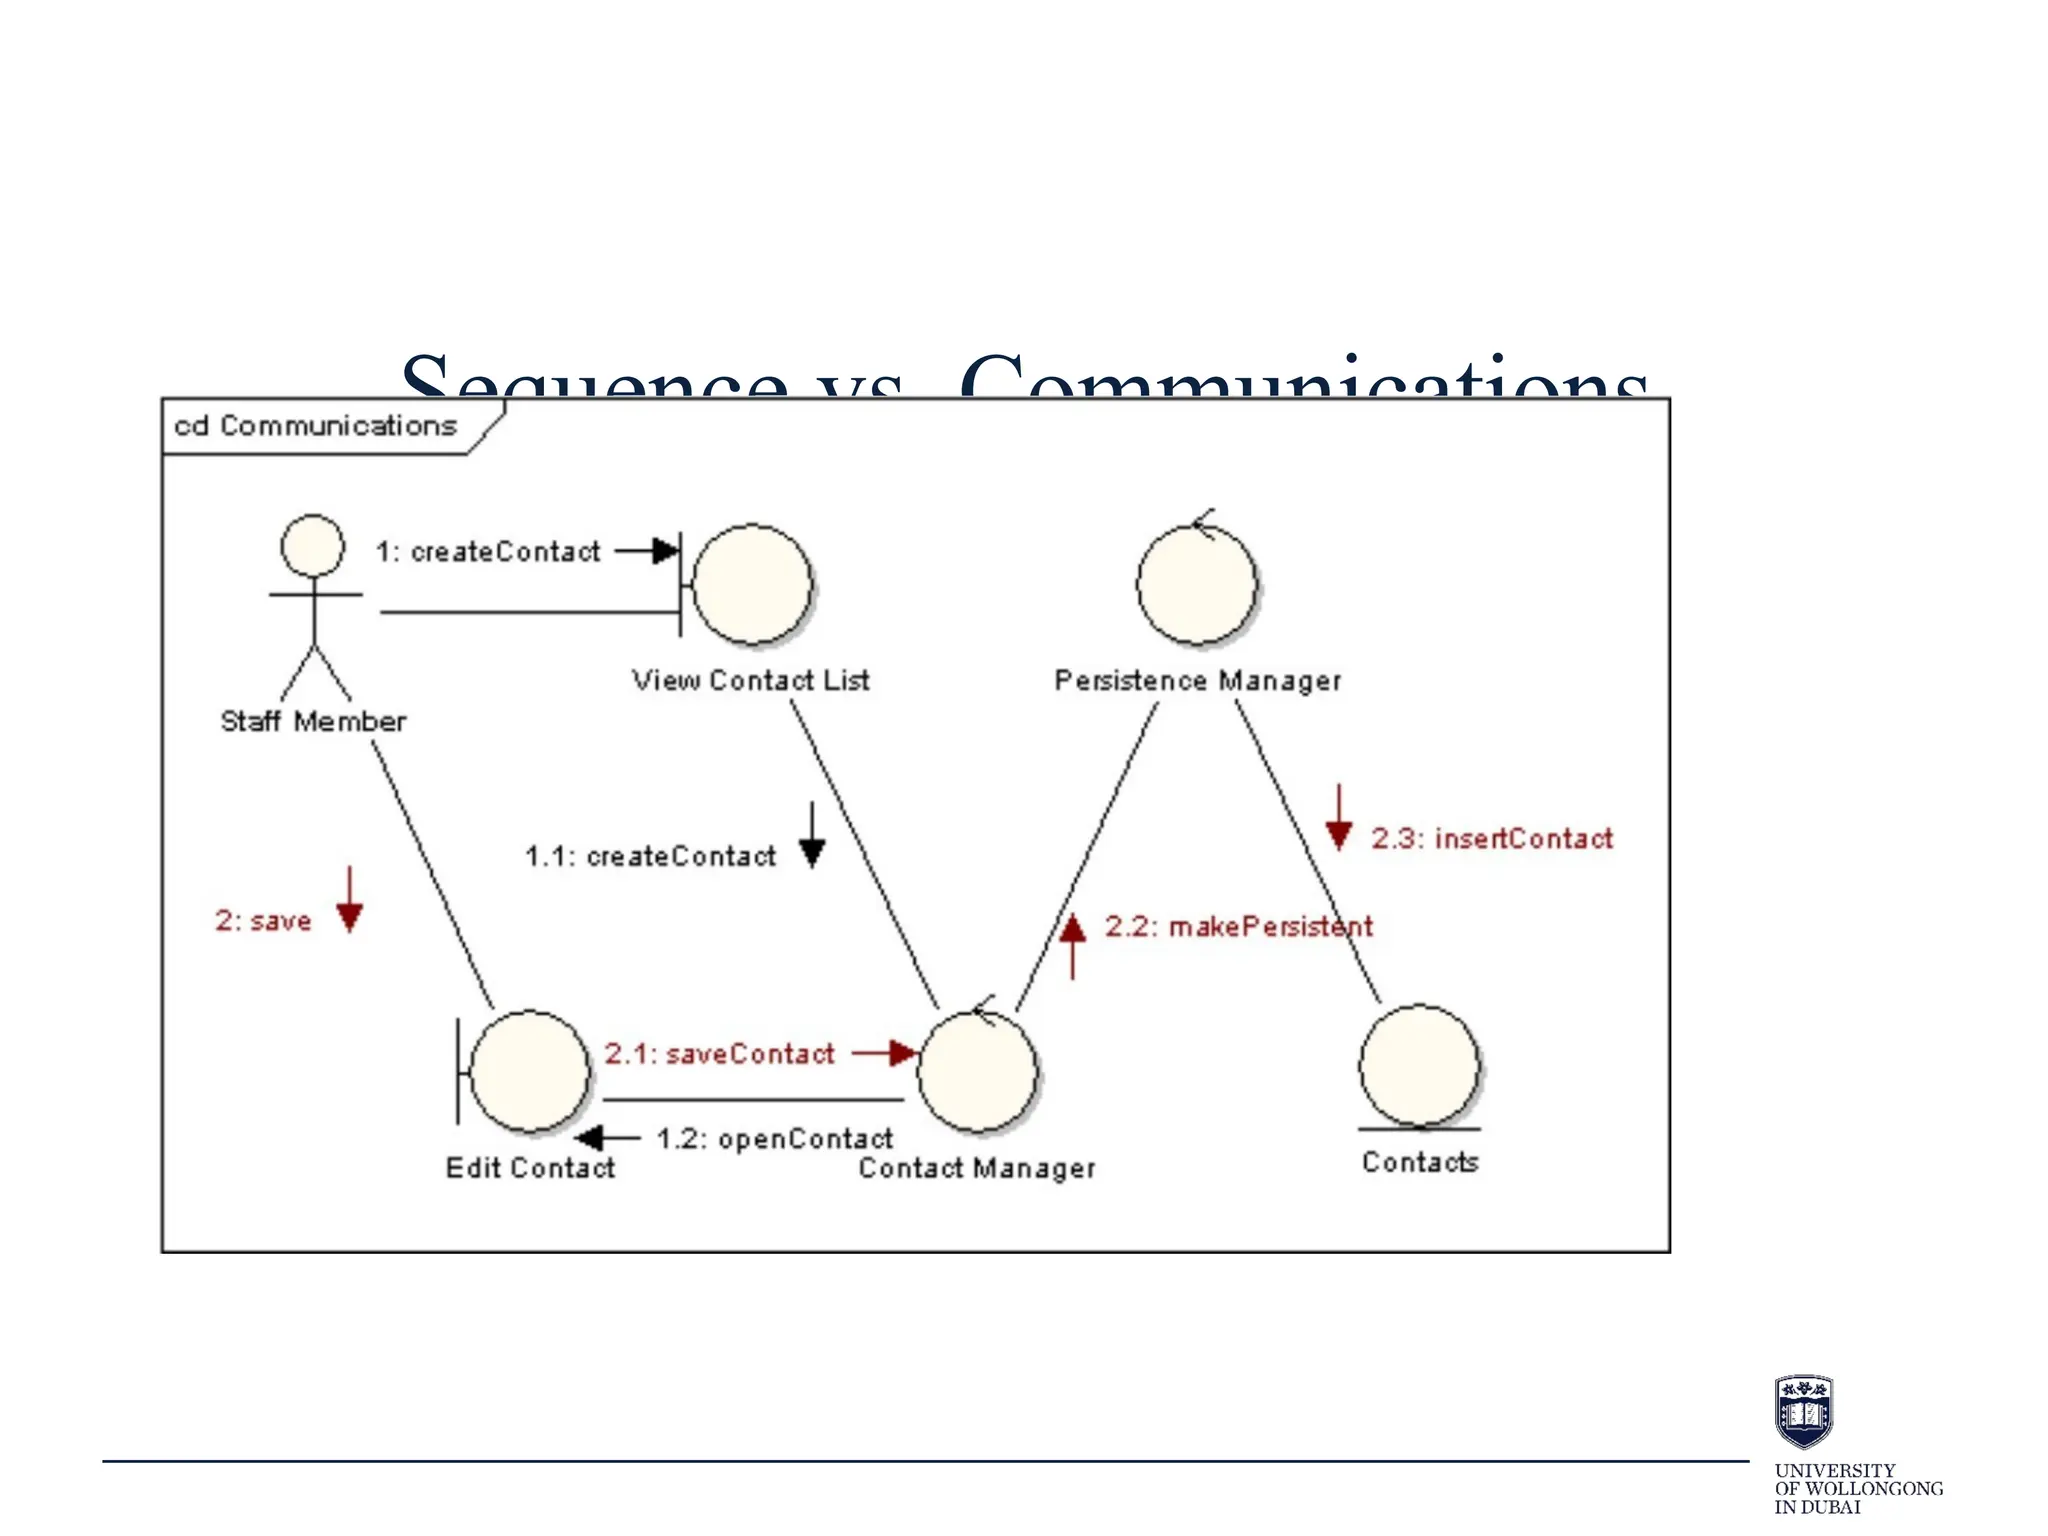
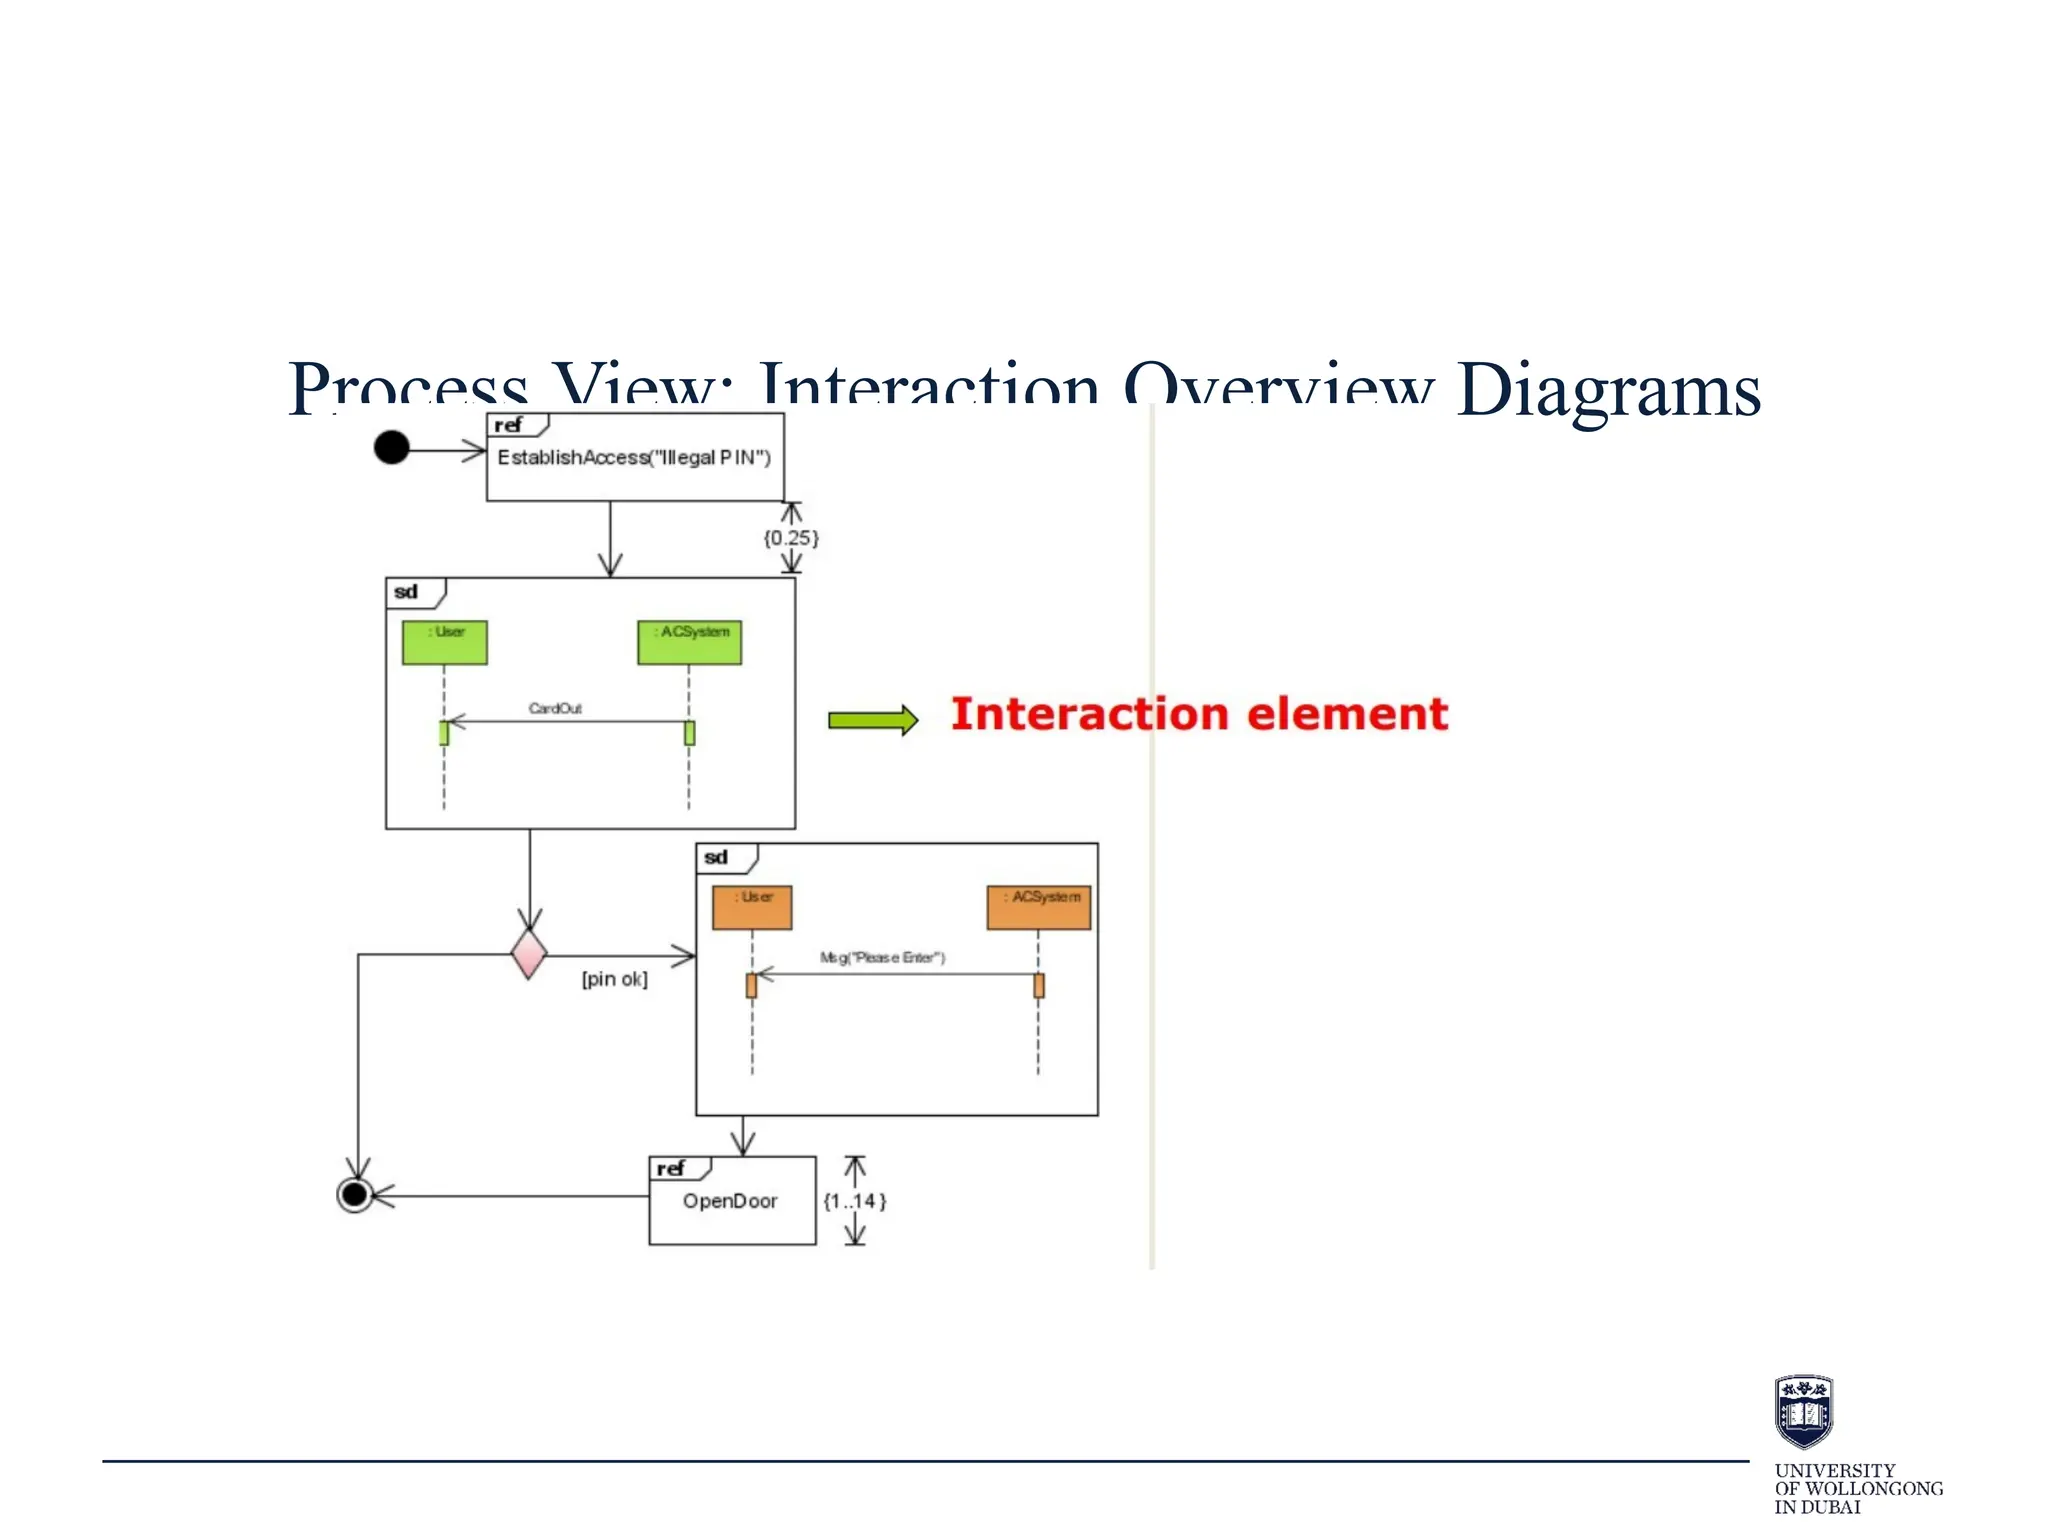
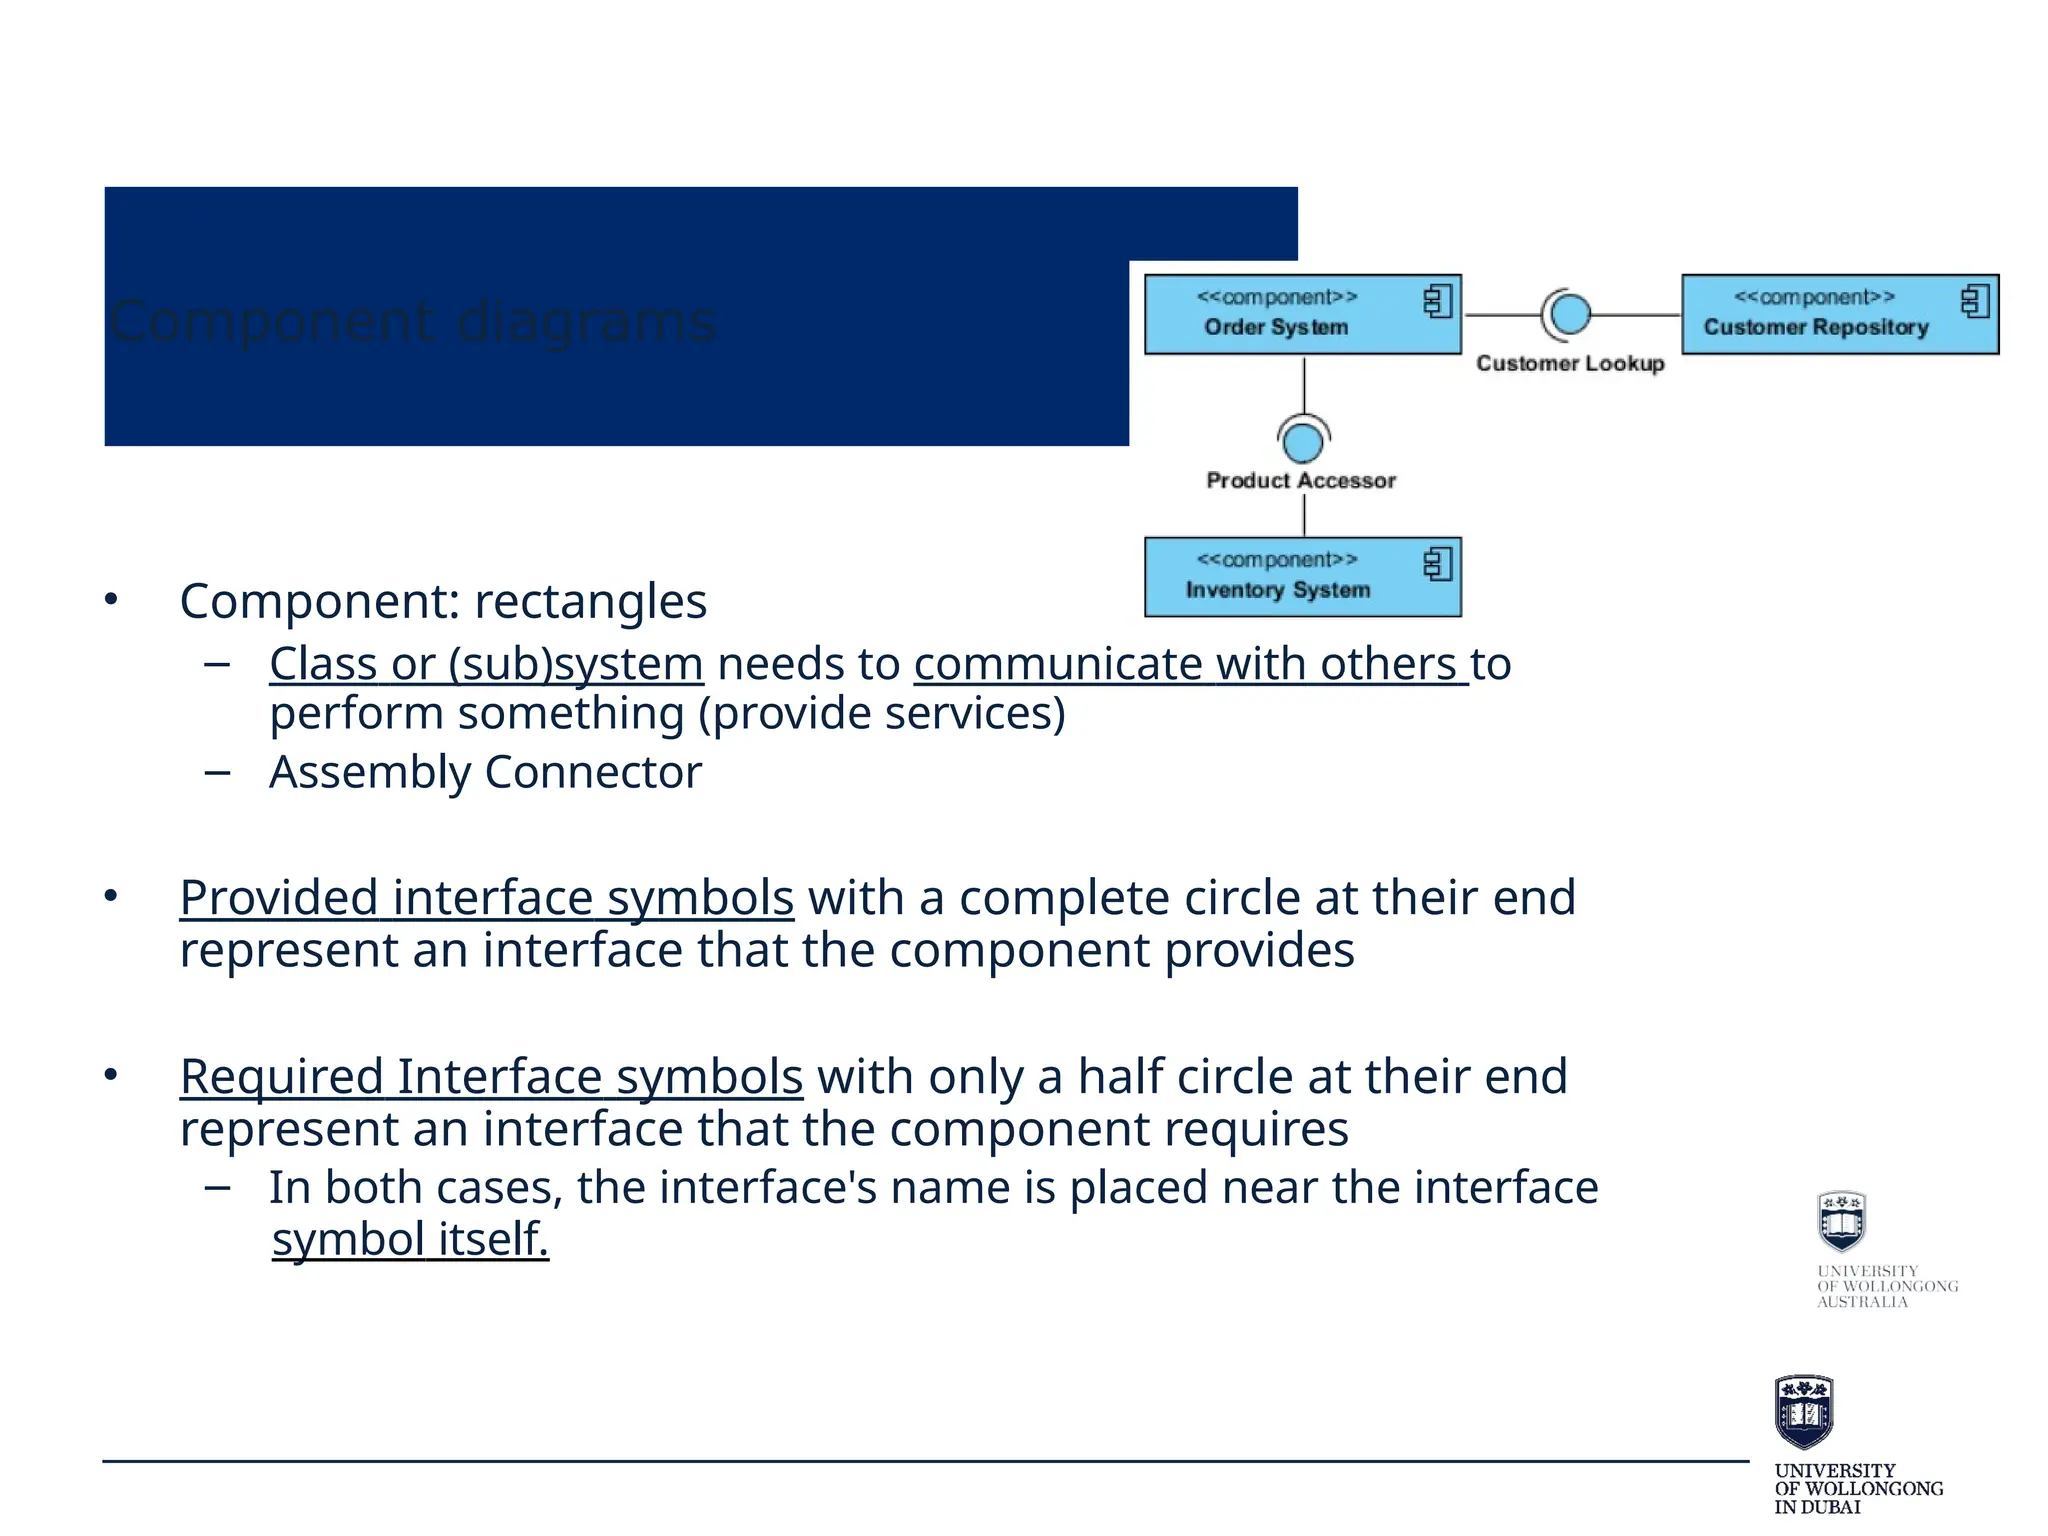
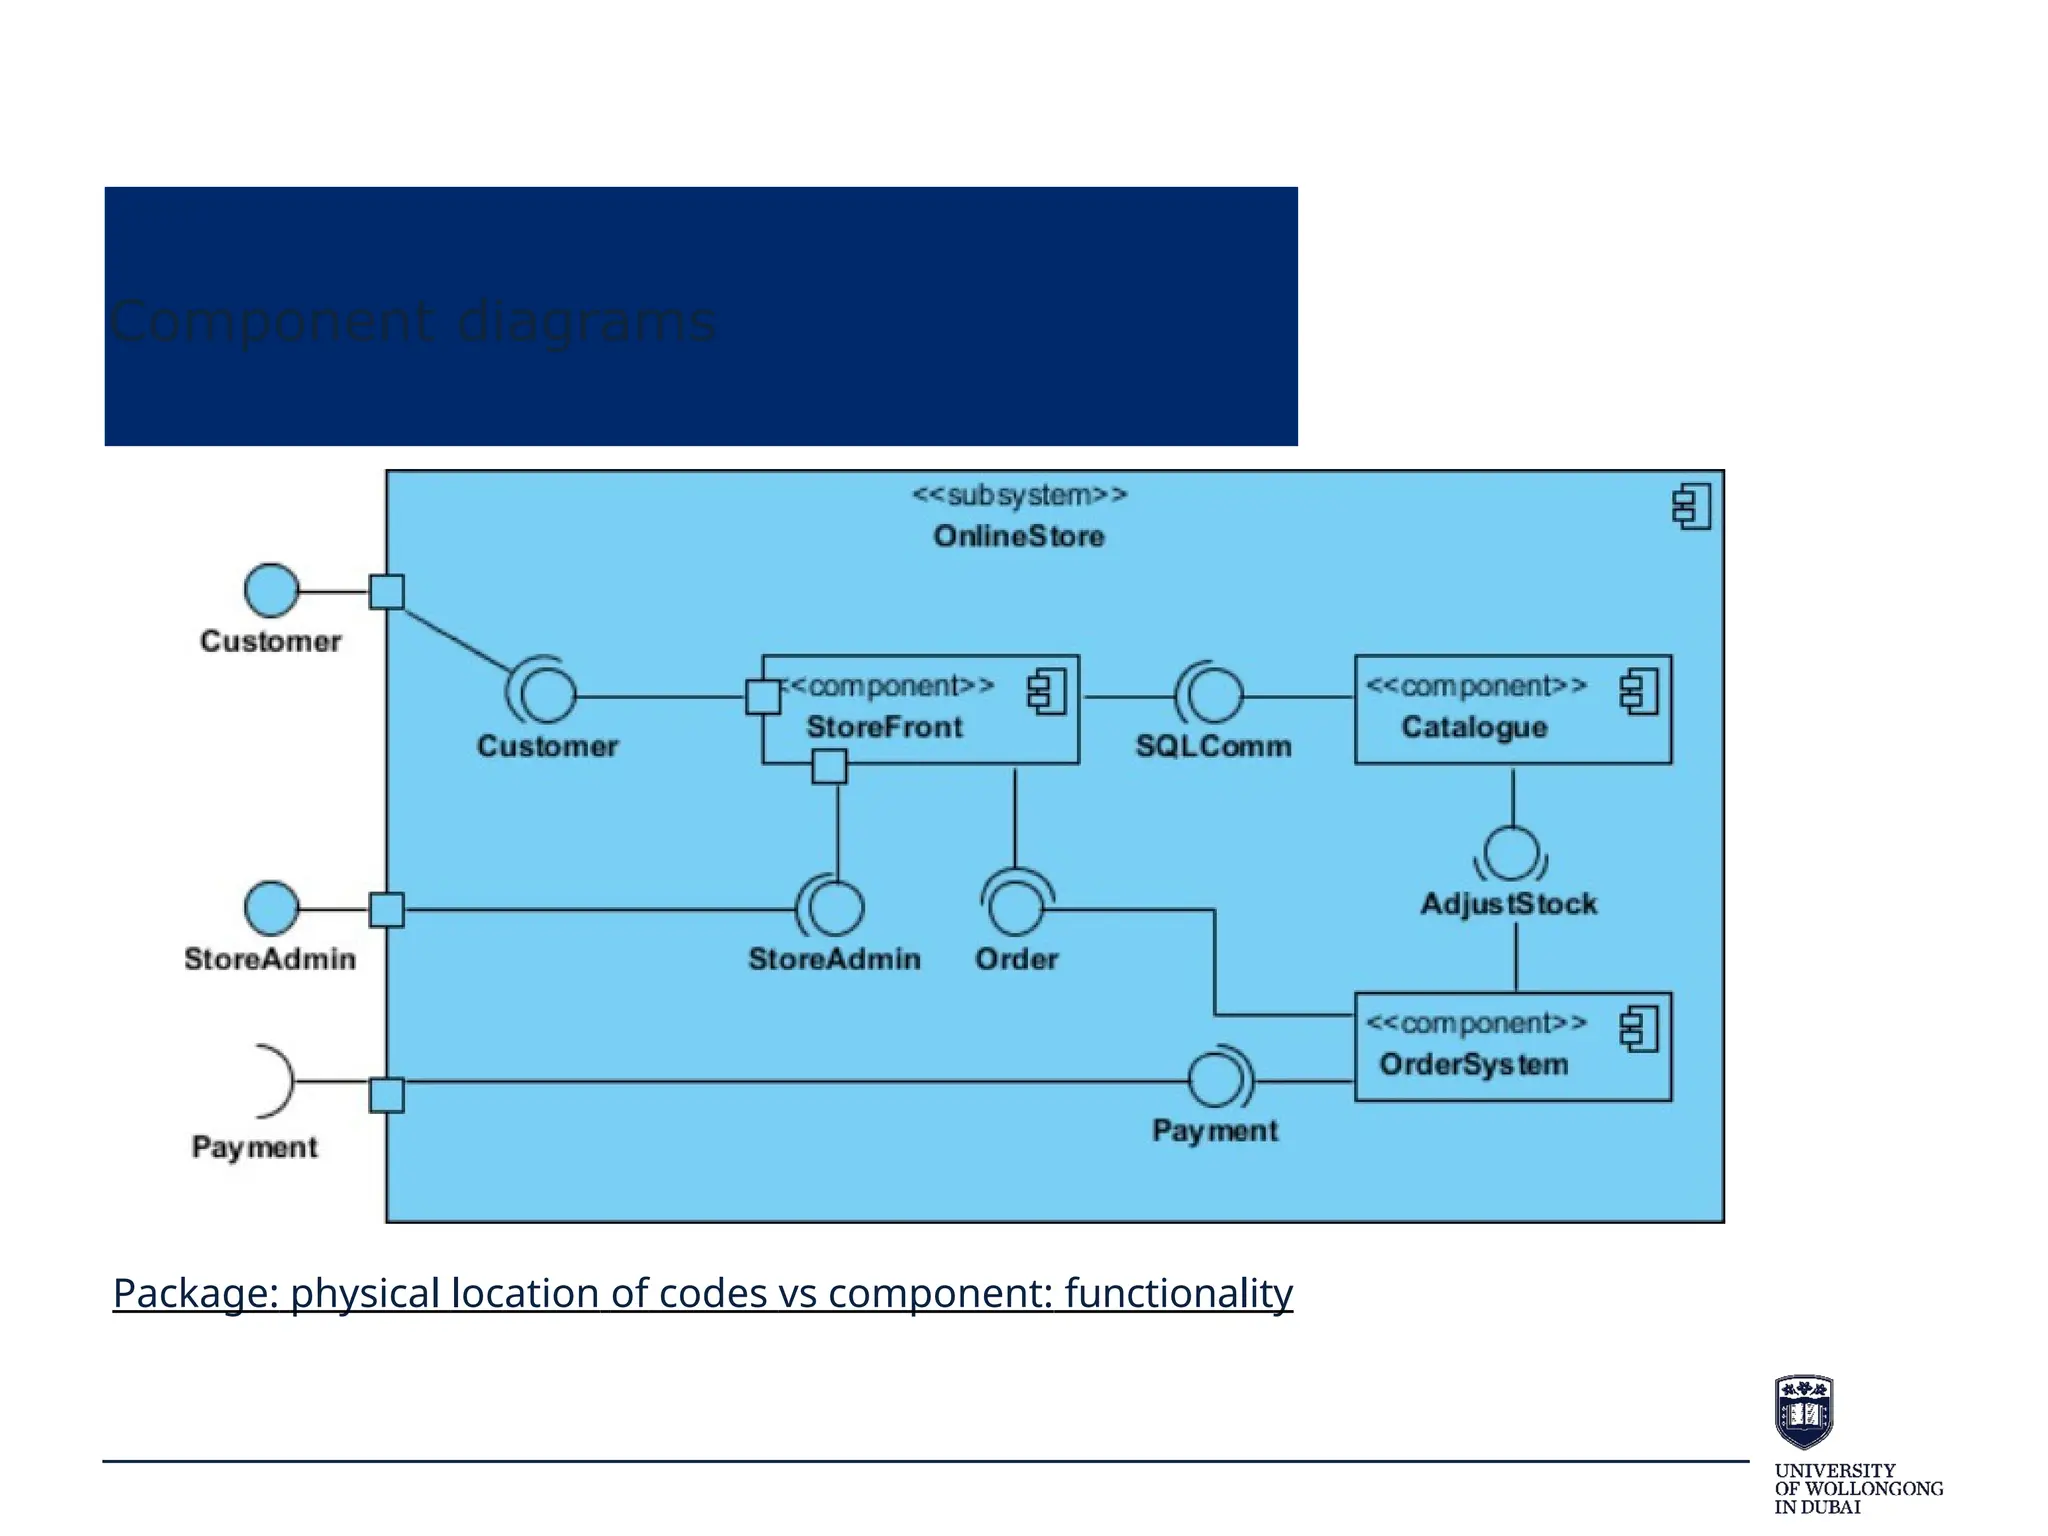
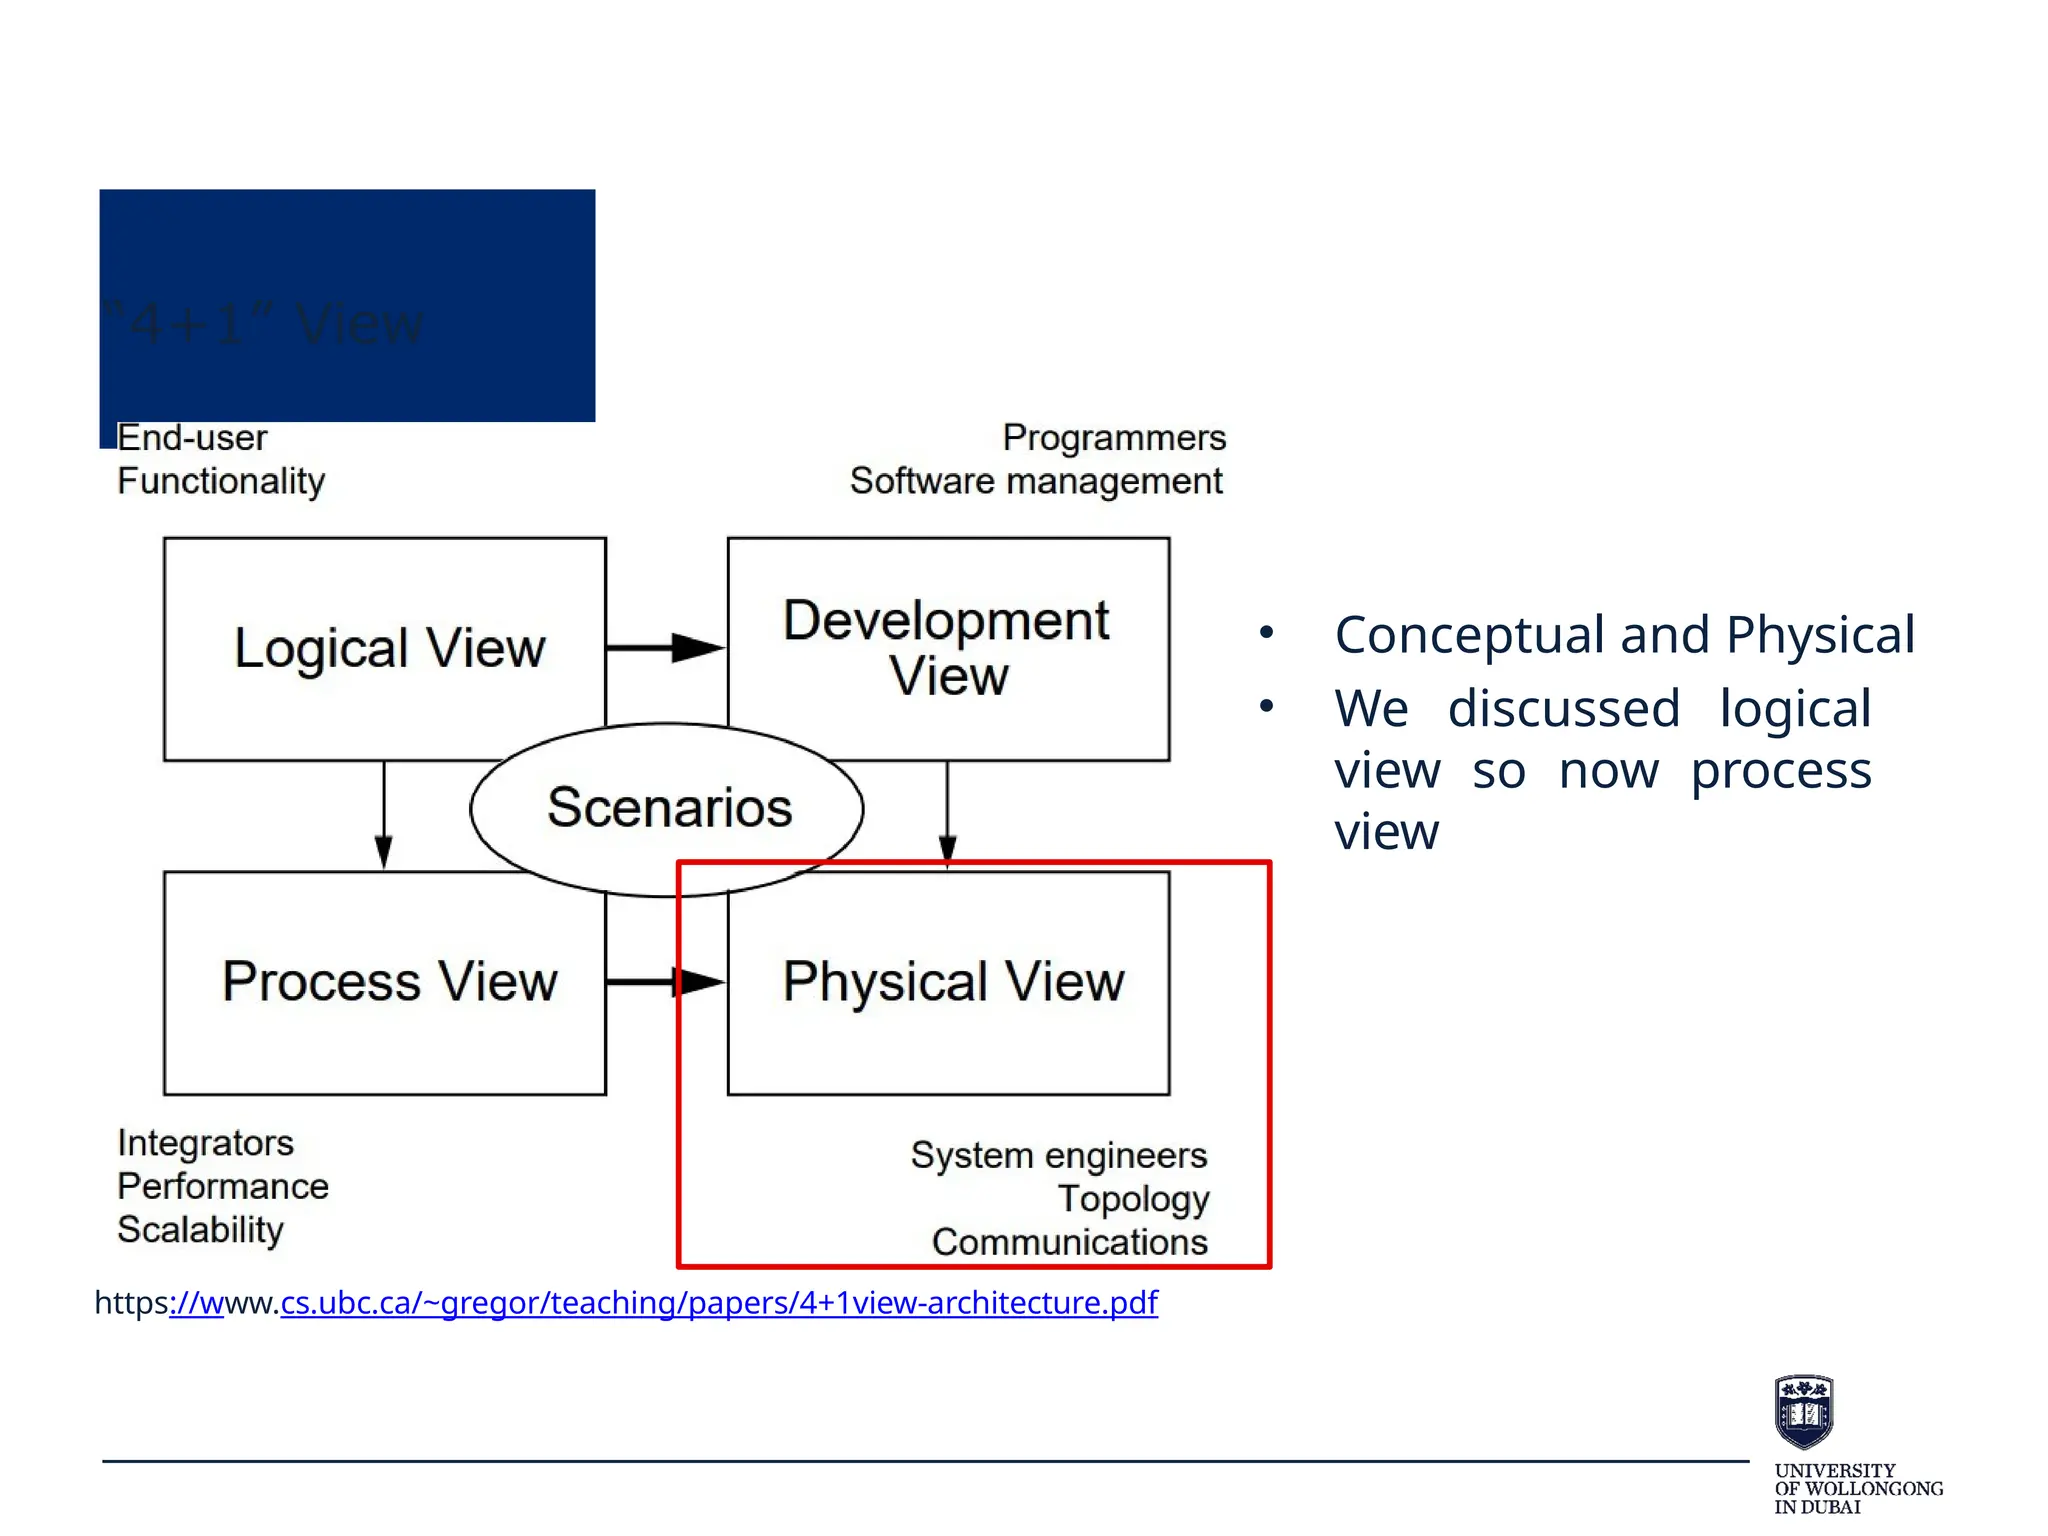
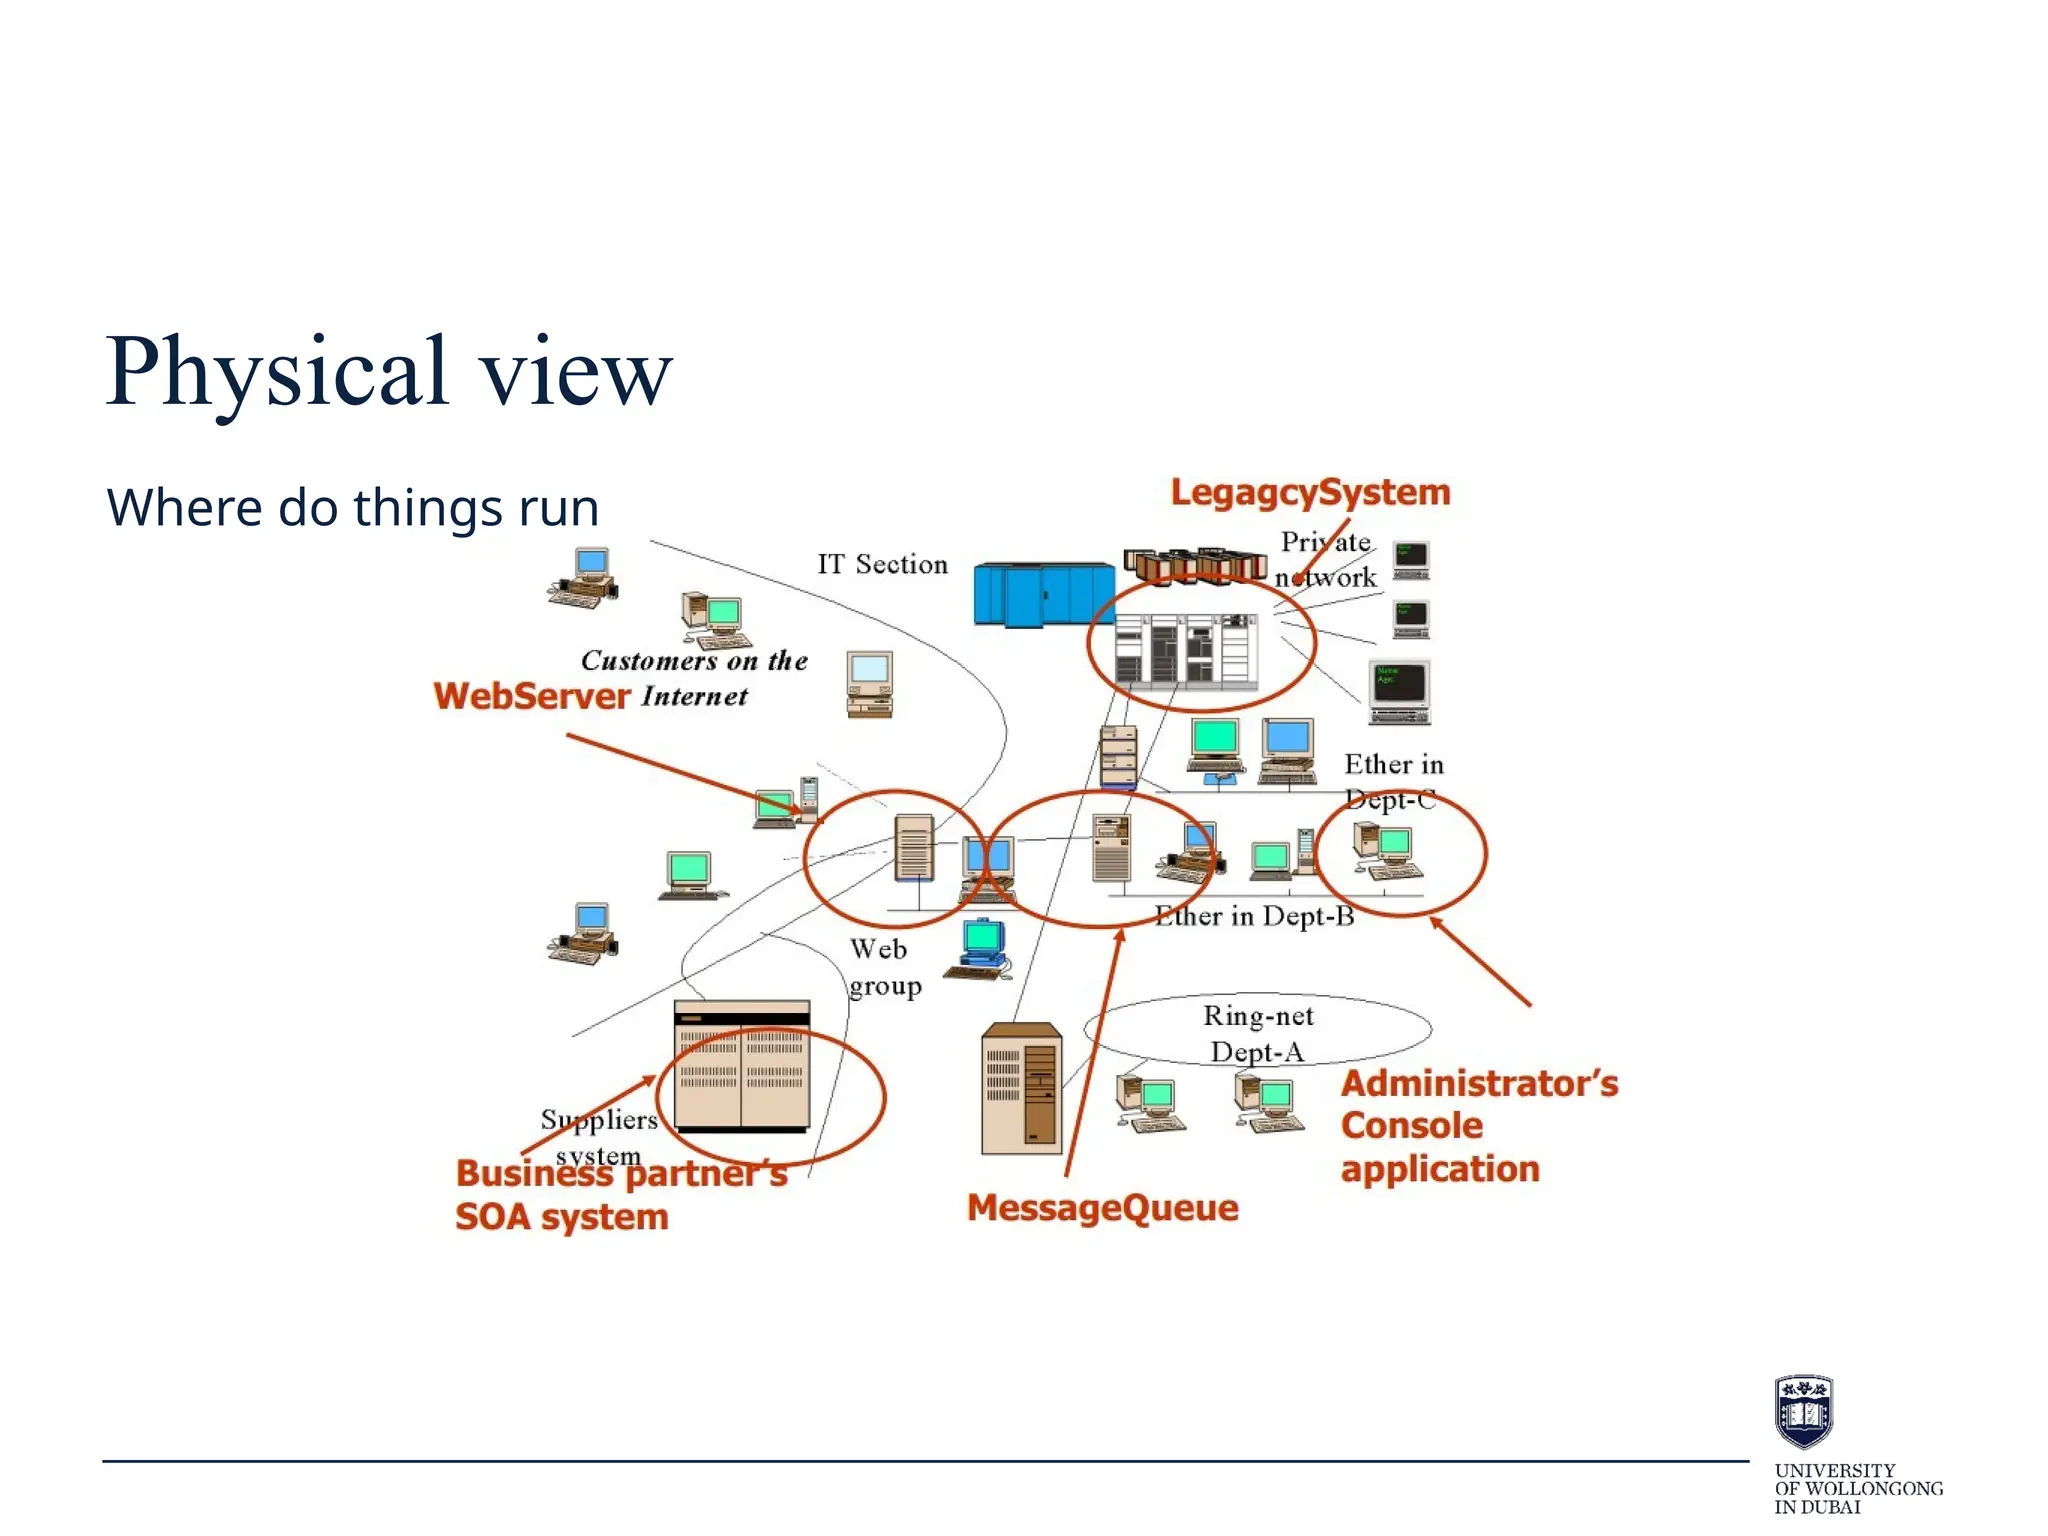
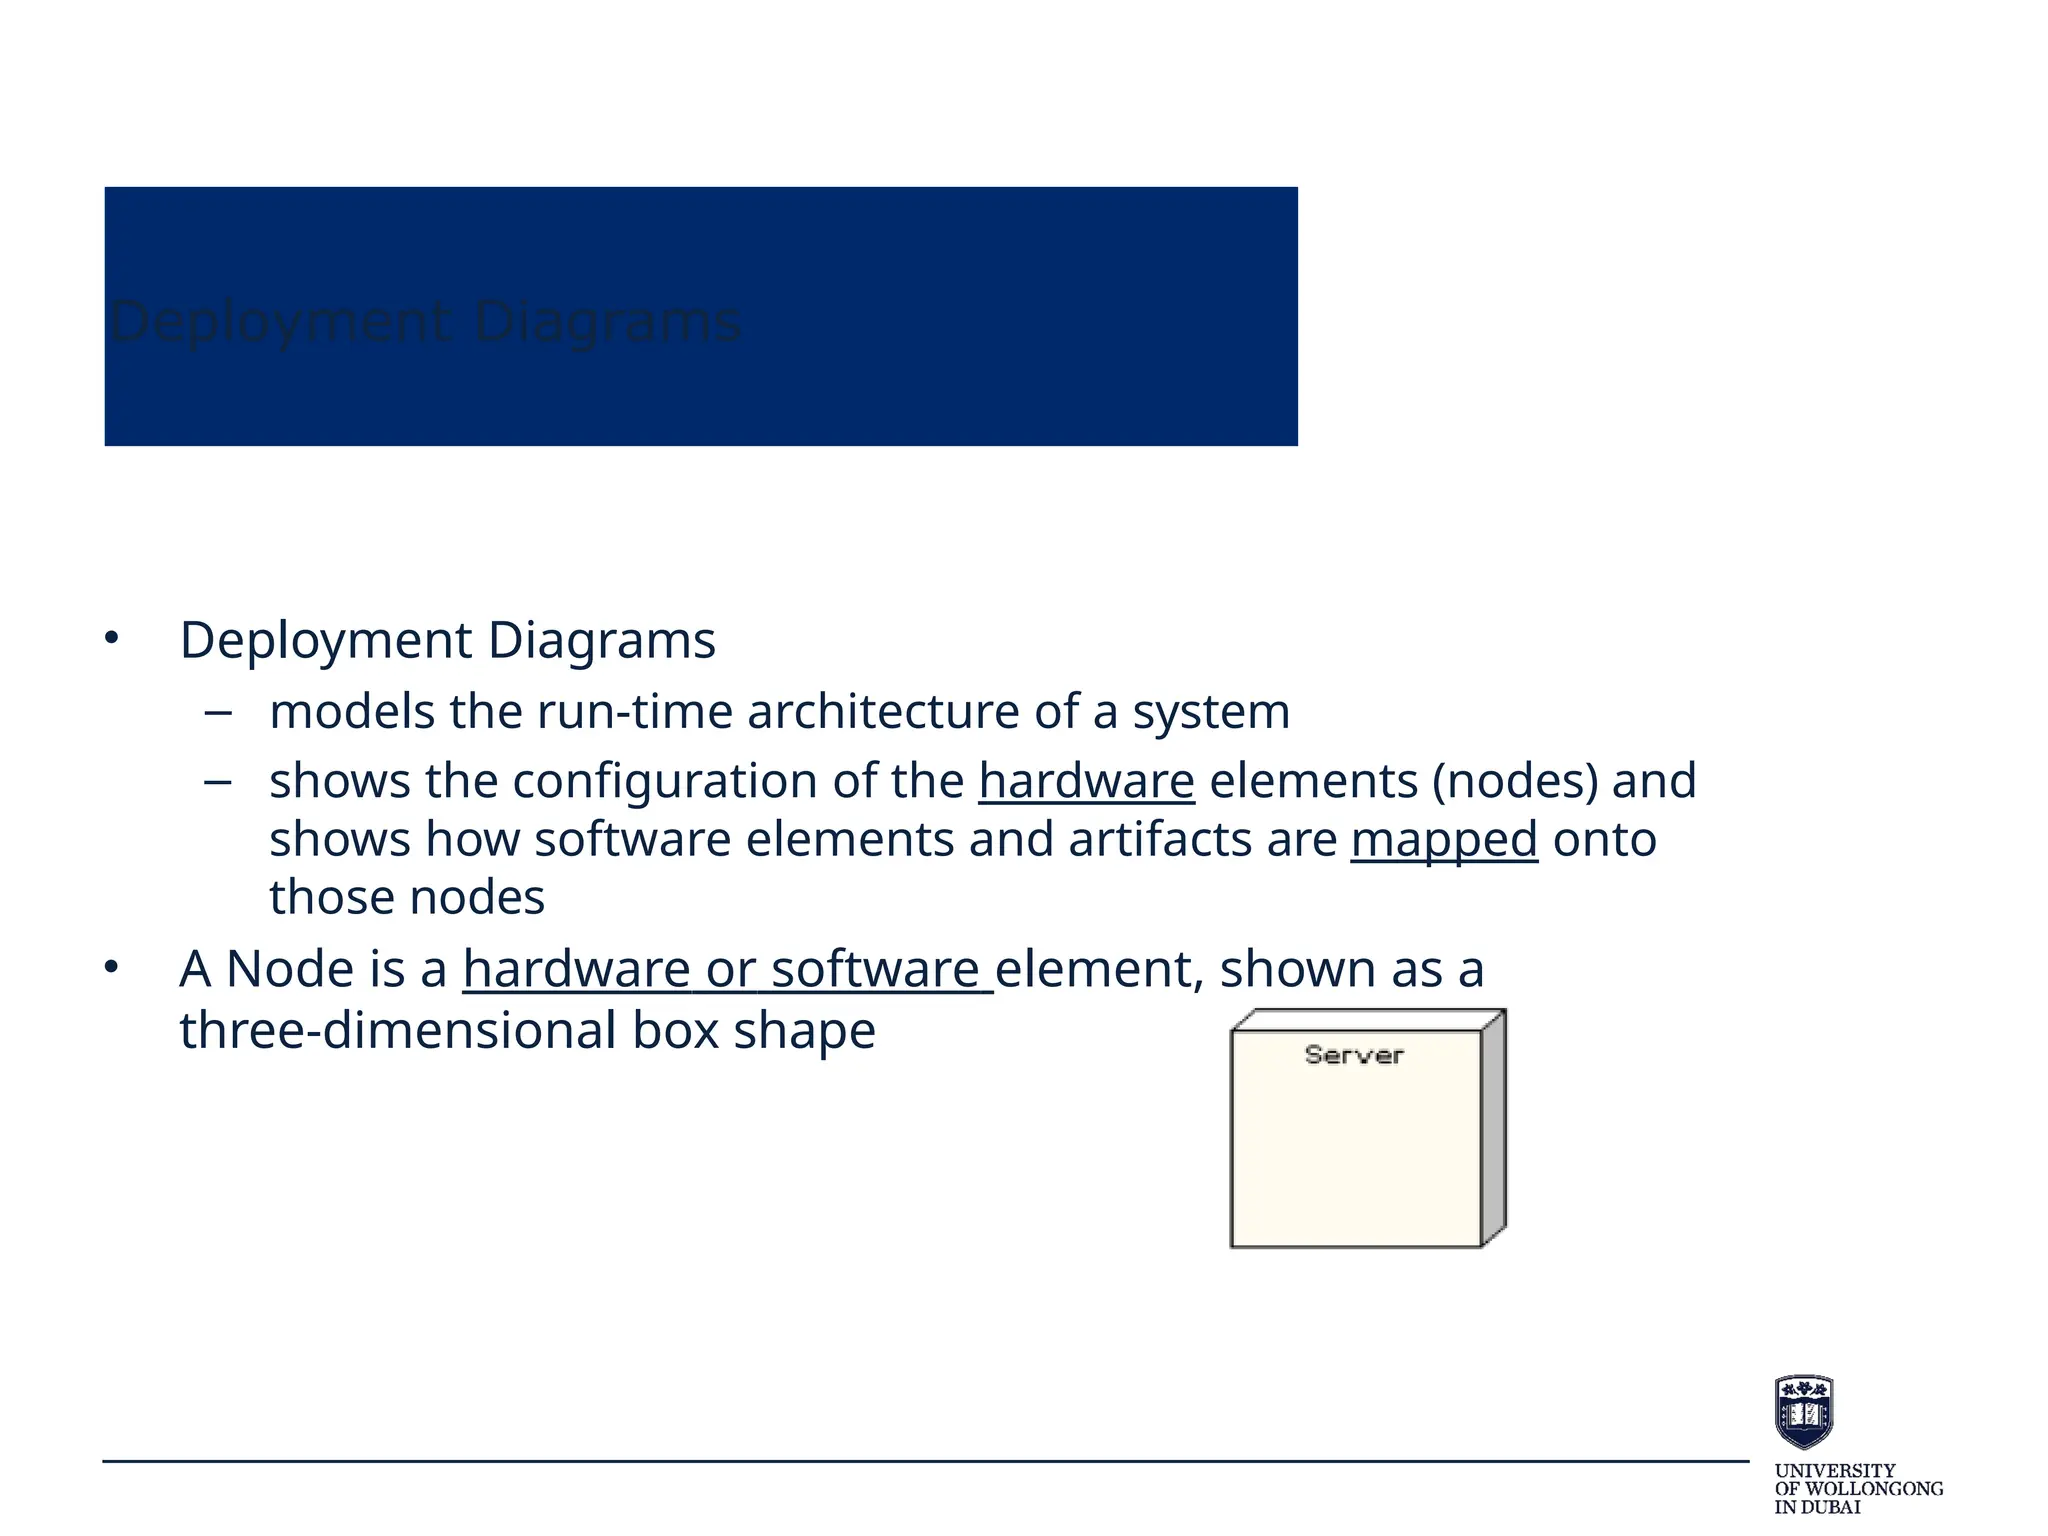
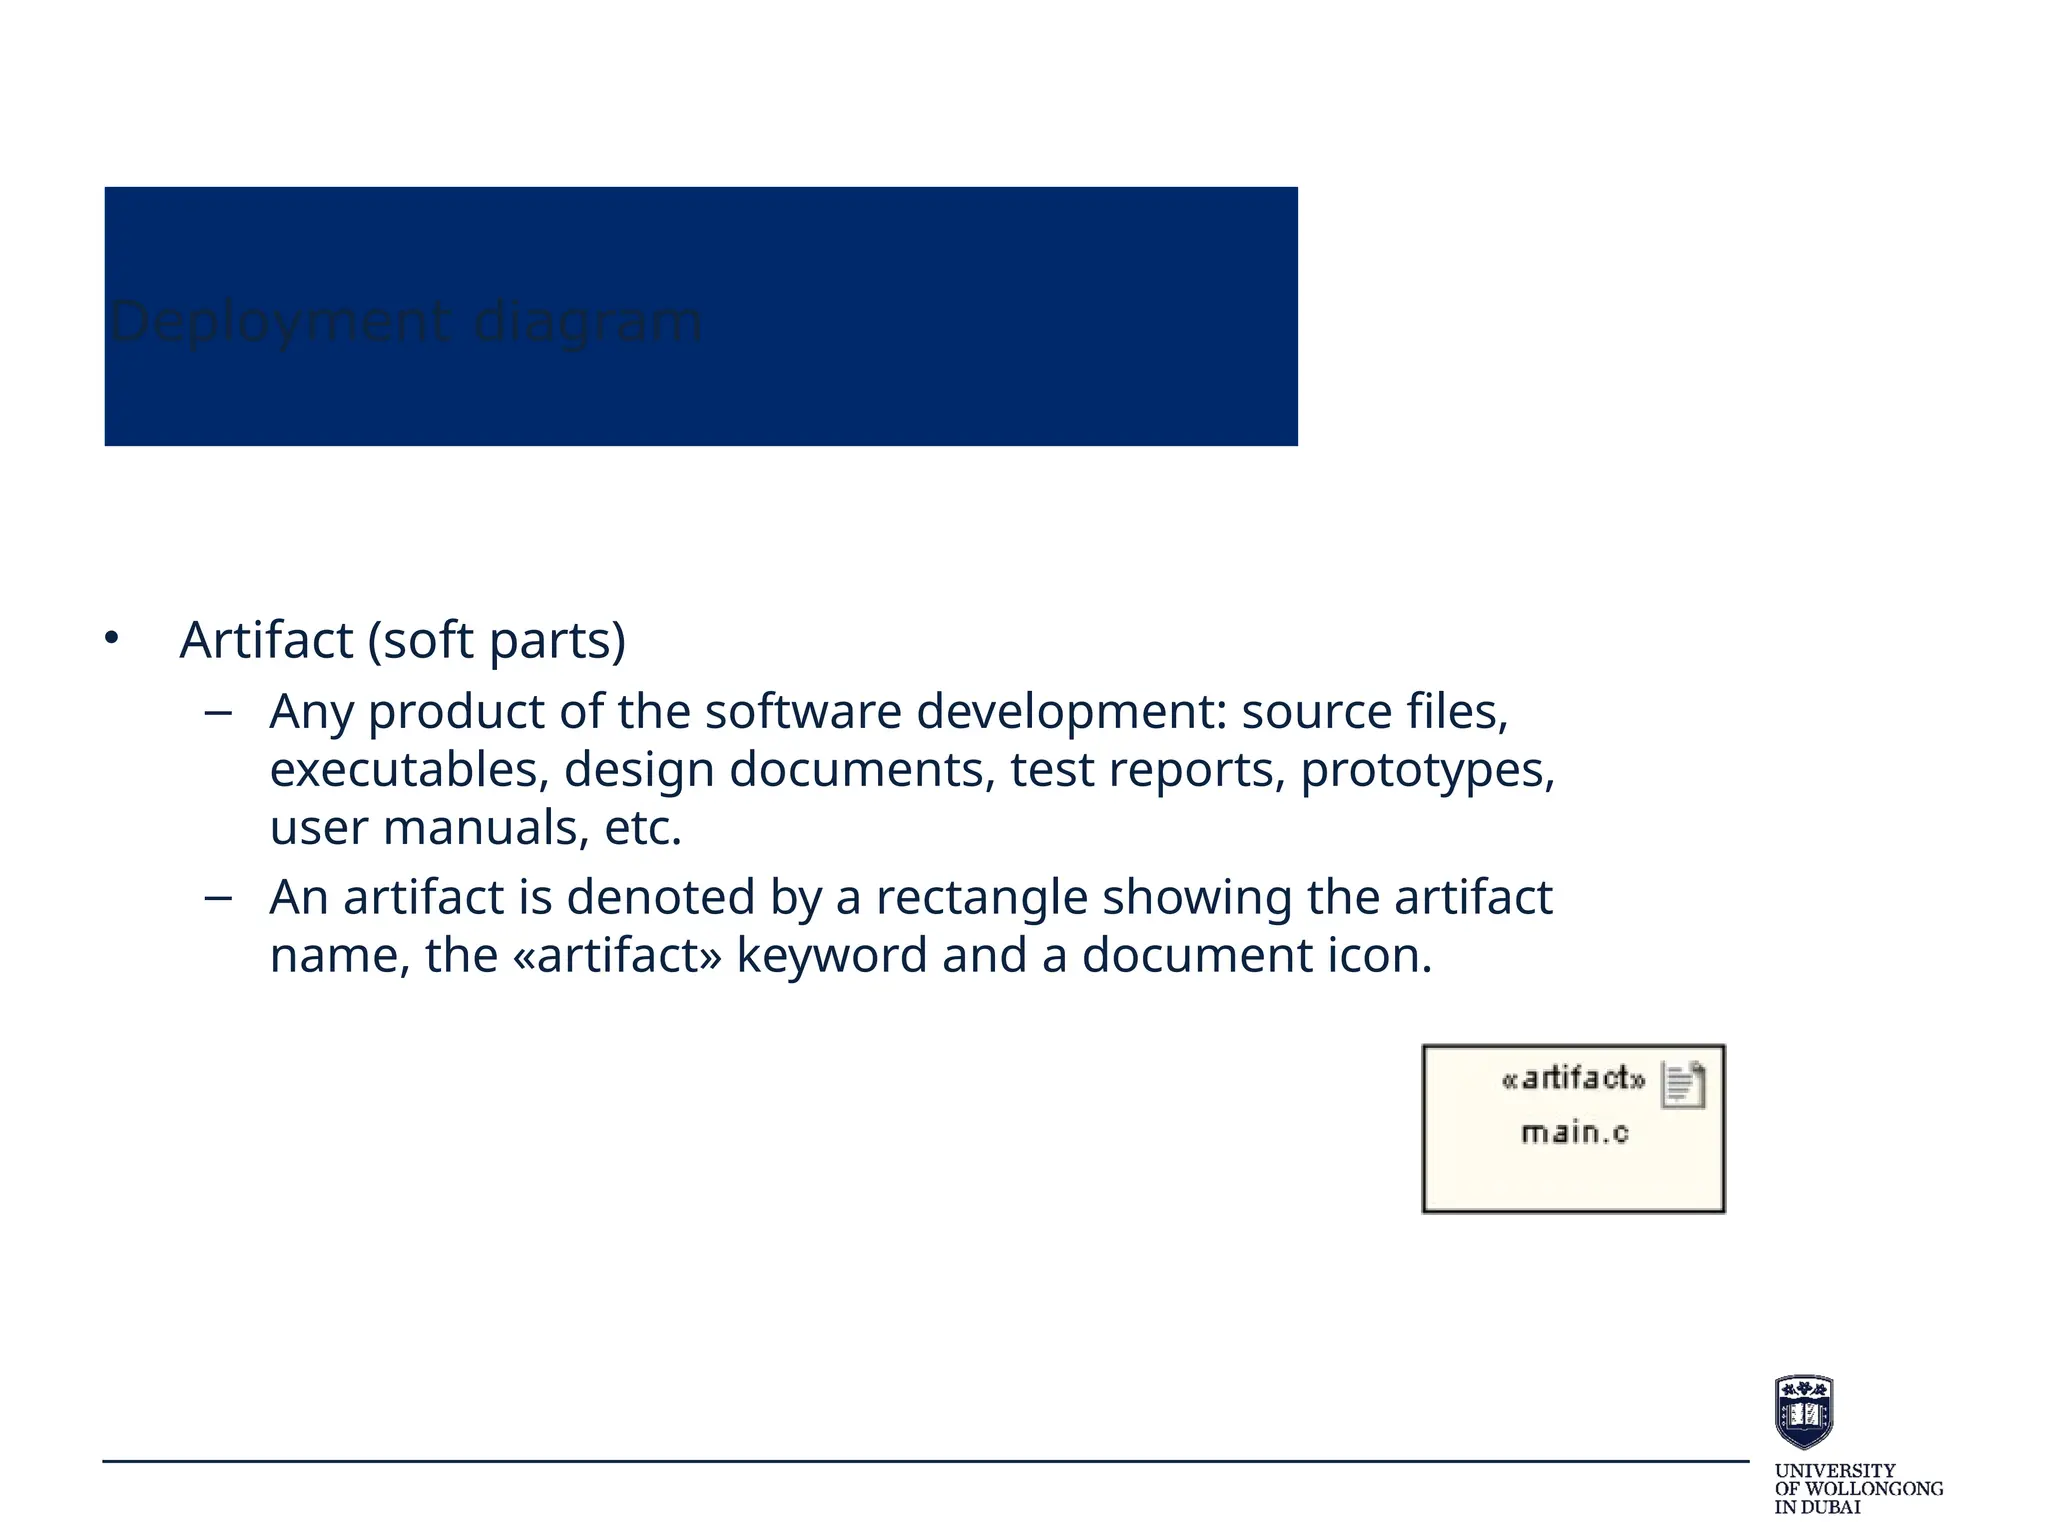
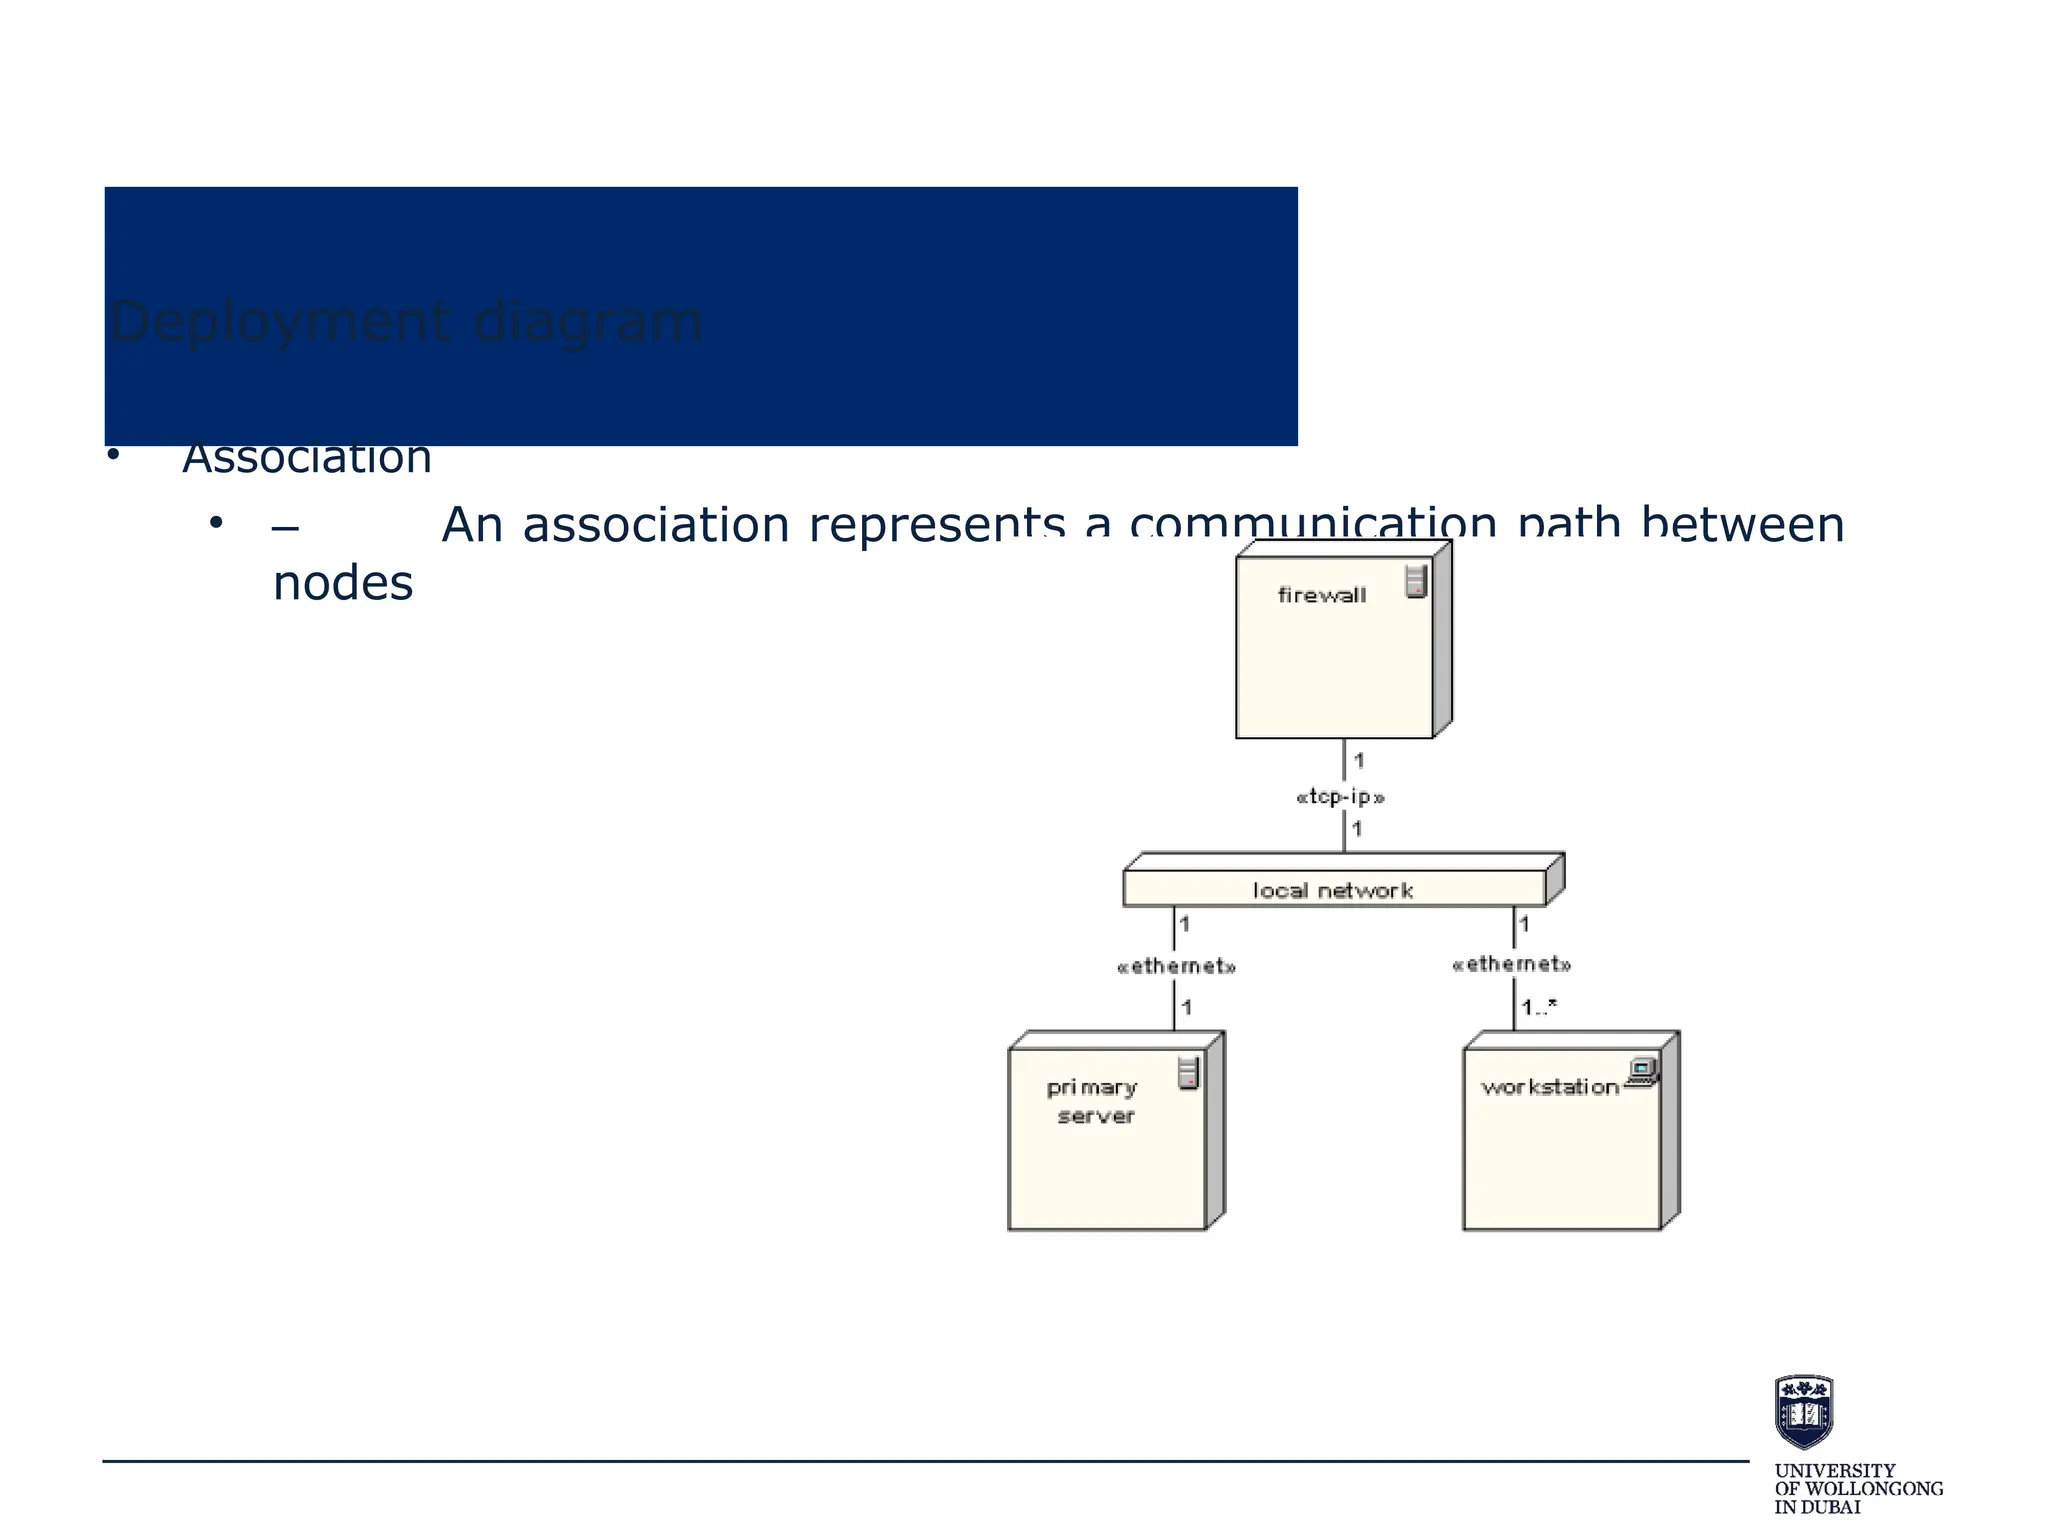
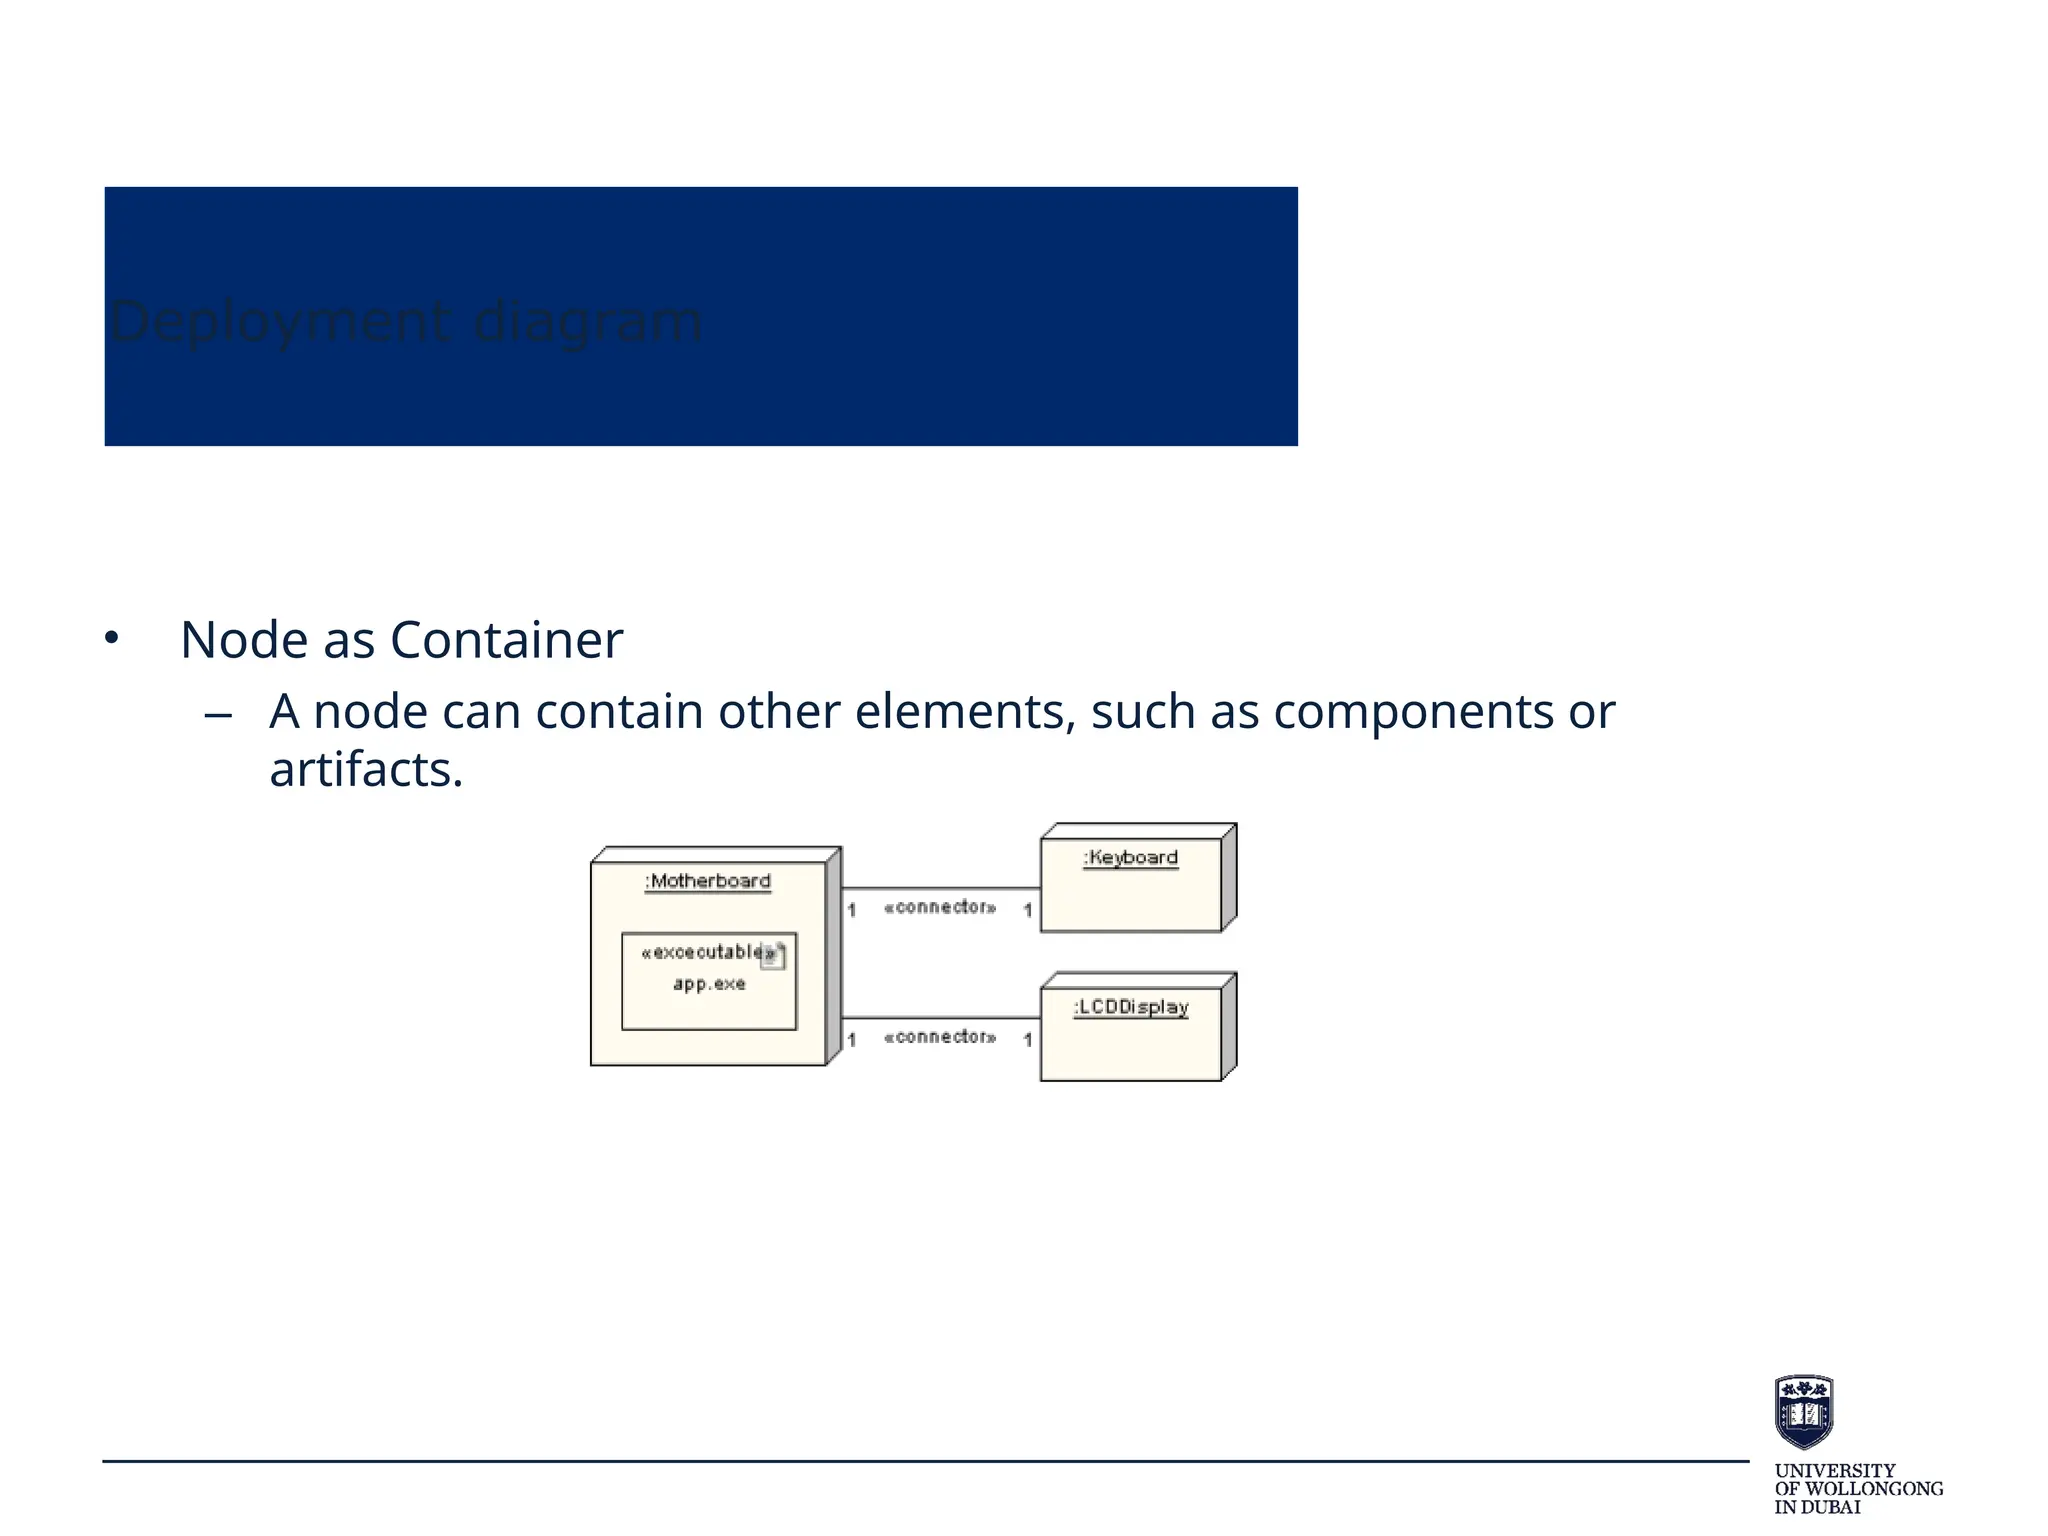
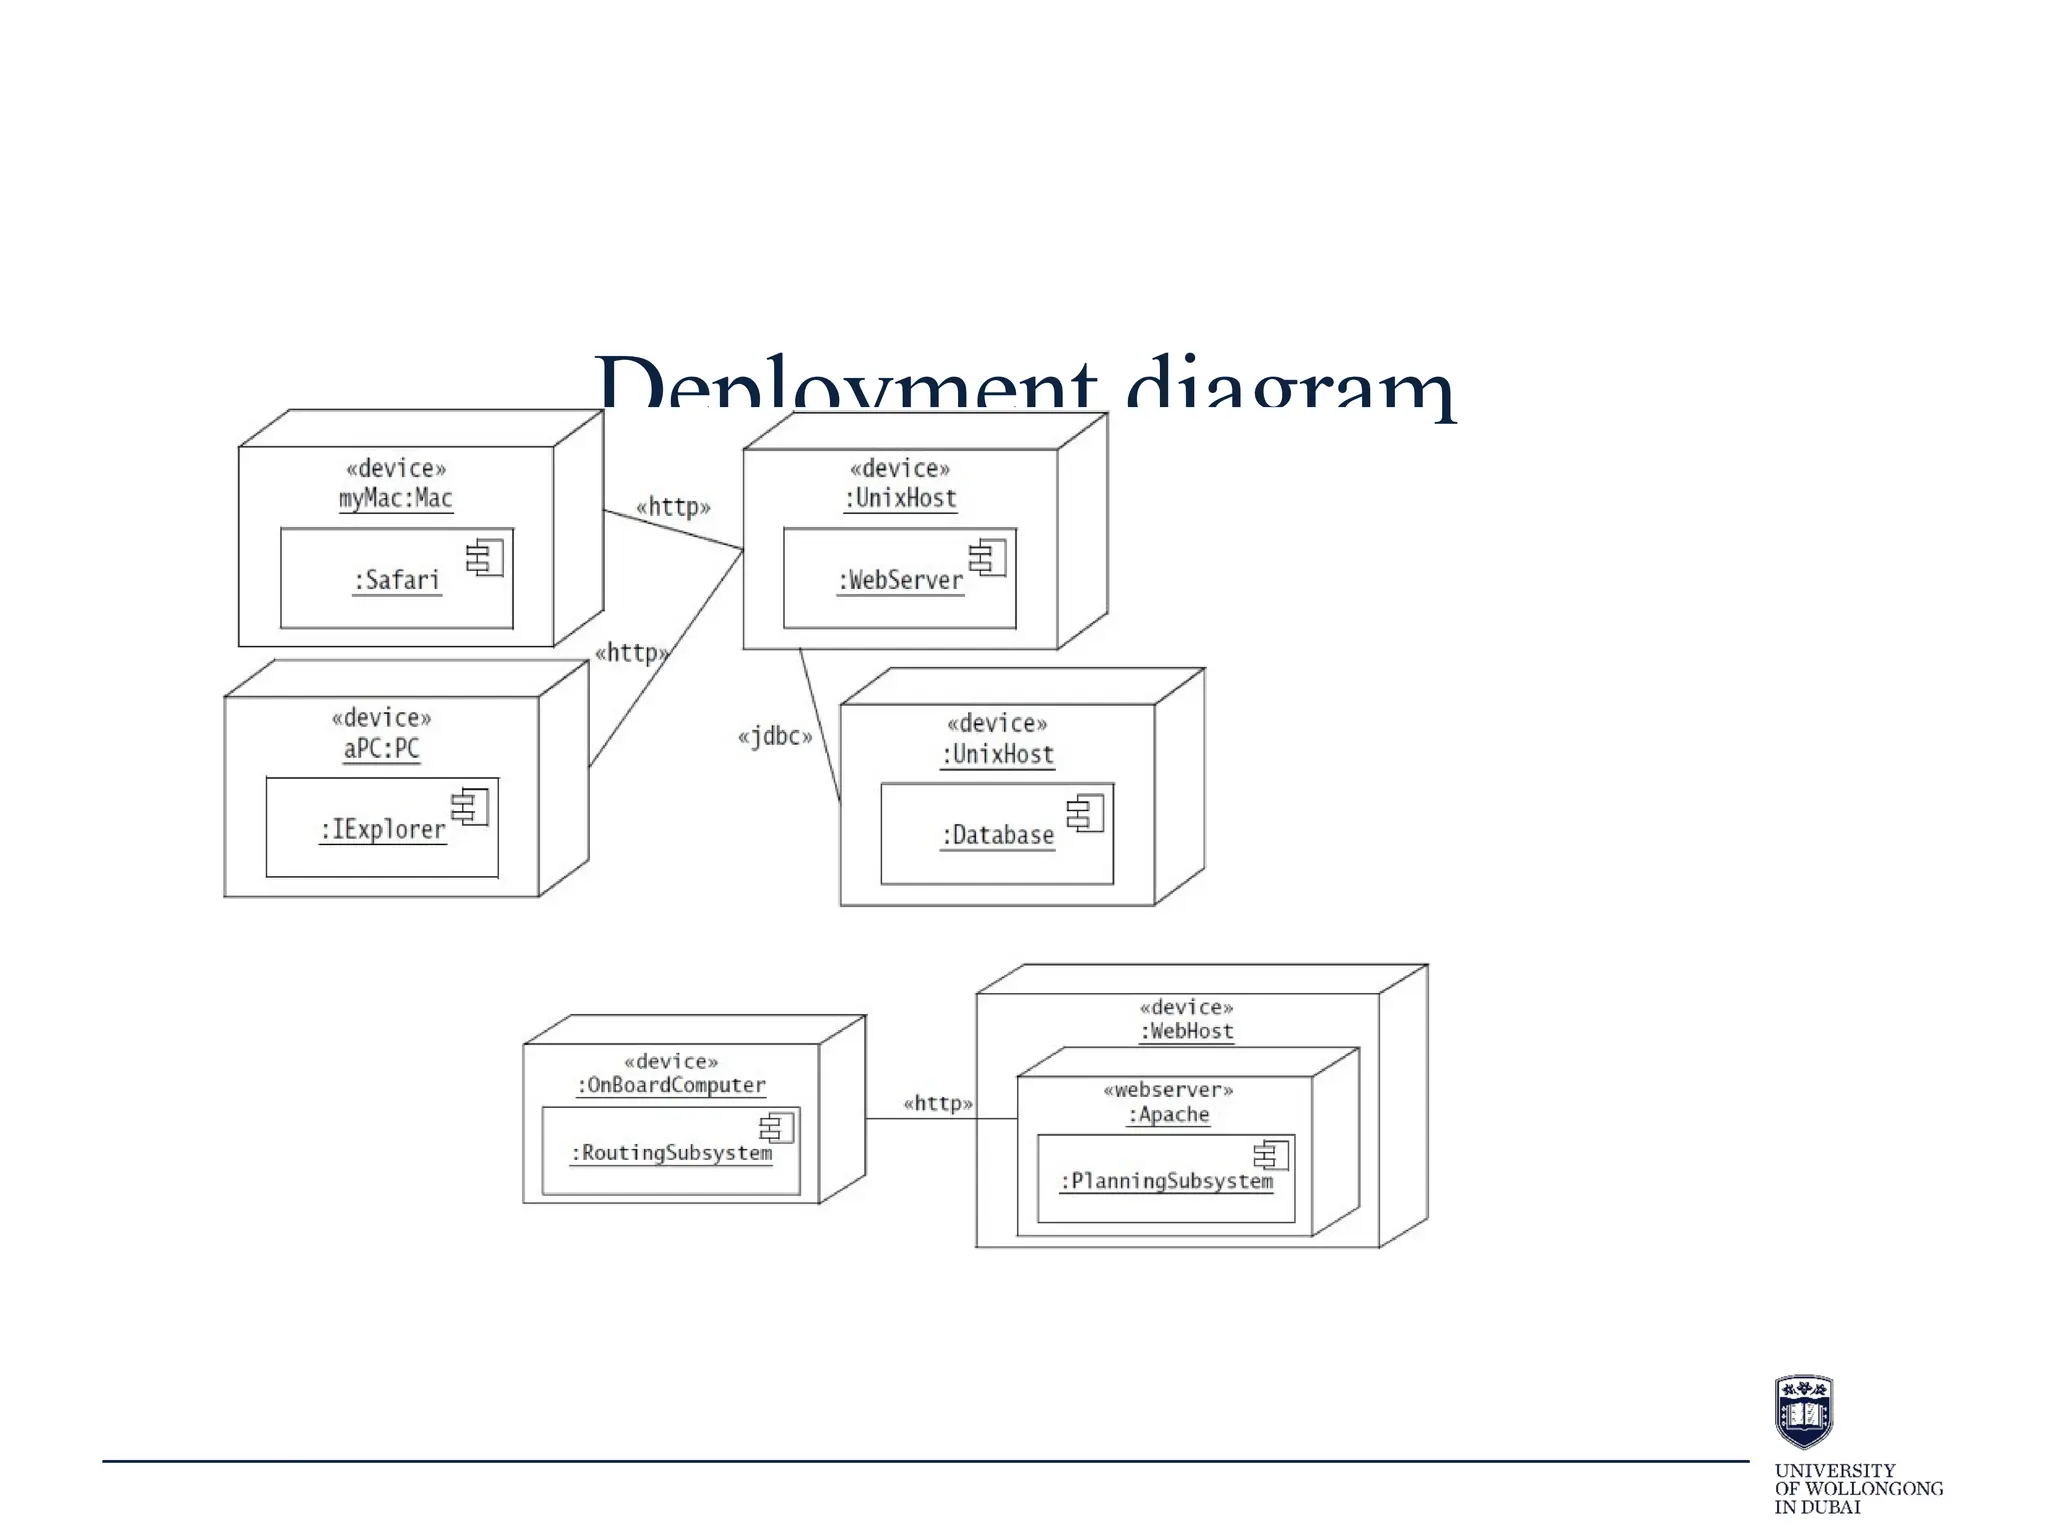
University of Wollongong in Dubai
Advanced Unified Modelling
Language
Modelling Language
• Two important components of a software development
methodology:
– Process (discussed in the previous lecture)
– Modelling language
• a well defined (modelling) language describes a system,
which has clear syntax and semantics suitable for both
human and computer interpretation (standard)
• model design (connected with actual coding)
“4+1” View
https://www.cs.ubc.ca/~gregor/teaching/papers/4+1view-architecture.pdf
• Conceptual and Physical
• We discussed logical
view so now process
view
Process View
• Model the dynamic aspects,
communication, and runtime behavior of
the system
• Use either sequence or communication
diagrams to model interactions in use
cases
• Optional:
– Activity (branching or parallel)
– Timing
– Interaction overview (simply other
scenarios)
sequence
activity timing
Interaction overview
Use case
communication
Sequence diagram
• Sequence Diagrams show how classes/objects (or groups of
objects) collaborate in some sequential behaviour.
– Which means class diagram is done!
• Used to model how objects interact together.
• Generally a Sequence Diagram describes one Use Case.
Sequence diagram
• Message exchange
– Communication between objects is achieved by
exchanging messages
• The objects send messages to each other
– These messages lead to the operations, which means that an
object understands or responses precisely those messages for
which it has operations
Sequence diagram
• Graphically, a sequence diagram :
– shows classes/objects arranged along the X axis
– messages, ordered in increasing time, along the Y axis.
• The object that initiates the action is placed on the left and
other increasingly subordinate objects to the right.
Sequence diagram
• Class/Objects
– Shows instance name and/or class name
(instance_name:class_name)
John: People
Sequence diagram
• A lifeline shows the life of an object
• The X(cross) shows the point at which the object is deleted
John: People
Sequence diagram
• Focus of control
– a long, hollow, narrow rectangle
placed over a lifeline
– shows object has control (sending or
receiving messages)
John: People
Sequence diagram
• Message
– Shown by a line with a filled in arrow
head
– Message name as the class method
– Private methods as messages
• Message return (optional)
– Shown by dotted line with empty arrow head
https://www.bing.com/videos/riverview/
relatedvideo?
q=sequence+diagram+symbols&mid=FFC23A
A53D53318904D0FFC23AA53D53318904D0&
FORM=VIRE
John: People
UOW:
University
enrol
success (return)
ATM Example
ATM
+InsertCard()
+EnterPIN()
+ValidatePIN()
+CheckAvailableCash()
+WithdrawCash()
+DispenseCash()
ATMCard
+ReadCard()
BankAccount
+GetBalance()
• Use case + class
• Sequence
• Coding work
• Notes:
– add new
sequence
diagram
– change
existing
So far…
• Use case: system functionality or user requirement
• Class/object: implement use case
• State: events change object status
• Sequence: model objects’ sequential behavior
• How to design?
B-C-E design
• Consider applying the B-C-E model (also known as MVC pattern)
– Entity layer (Model)
• Holds the data and is responsible for its persistence.
• Class, attributes, methods
– Control layer (Control)
• Contains the rules about how to combine info and how to deal with
interaction
• A third-party coordinator(sequence diagram)
– Boundary layer (View)
• Responsible for representing info to user and to receive user
interactions.
• User interface (like front-page, mobile app)
B-C-E design
• Boundary layer (View)
– The interaction between the user and the system
– A boundary class does not provide the actual behavior of the
use case - it typically represents the GUI - e.g. dialog, menu,
screen.
– Actors interact only with boundary classes, to perform the use
case
B-C-E design
• Control layer (Control)
– The main *use case* controller class to coordinates all the messaging
between the entity classes
• The use case controller implements the sequence diagram
messaging.
– They are the “glue” between boundary and entity classes – i.e. they
connect the user with the data and logic
– They contain the application-specific business rules
• A student should enroll in 4 subjects per semester; a customer
cannot withdraw more than $800 per day.
– One control class per use case (some use cases may not need one)
• They are created when the system performs the use case and
usually die when the use case is performed
B-C-E design
• Entity layer (Model)
– Coding work
– Represent business domain concepts – you will usually
have identified many in the domain class diagram
– Entity classes used to store and manage information in the
system – they map directly to database tables
– Some entity classes may be transient – i.e. they do not get
stored in DB but are only temporary
B-C-E design
• Separated roles
• Work in parallel
• Left figure shows an
alternative way,
without touching
controller, but returns
the results
B-C-E design
• 2 representations:
– Circle for class, line for association
between class
– Add prefix
B-C-E design
• Applying the B-C-E framework
– Take an ATM system. A use case has been identified called Withdraw Cash.
– A class diagram models this system. The diagram is not well
designed.
ATM B-C-E design
ATM B-C-E design
ATM B-C-E design
Process View:
Communications
diagrams
• Convey the same information as a sequence diagram – a
difference in style.
– Sequence diagrams focus on messages occurring over a
timeline
– Communication diagrams focus more on links between
participating objects
• sequence is less clear (order info can be unclear) and
relationships are more clear
Sequence vs. Communications
Process View: Interaction
Overview Diagrams
• Interaction overview diagram
– a form of activity diagram in which the nodes represent
“interaction diagrams”.
• sequence, communication, and interaction overview
diagram (from another level)
– New elements:
• interaction occurrences
• interaction elements
Process View: Interaction Overview Diagrams
“4+1” View
https://www.cs.ubc.ca/~gregor/teaching/papers/4+1view-architecture.pdf
• Conceptual and Physical
• We discussed logical
view so now process
view
Development View
• Component diagrams illustrate the pieces of software,
embedded controllers, etc., that will make up a system.
– show the relationship between different parts
– organise the system (show subsystems)
• The term "component" refers to a module of classes that represent
independent systems or subsystems with the ability to interface
with the rest of the system.
• A component is usually implemented by one or more classes (or
objects) at runtime.
Component diagrams
• Component: rectangles
– Class or (sub)system needs to communicate with others to
perform something (provide services)
– Assembly Connector
• Provided interface symbols with a complete circle at their end
represent an interface that the component provides
• Required Interface symbols with only a half circle at their end
represent an interface that the component requires
– In both cases, the interface's name is placed near the interface
symbol itself.
Component diagrams
Package: physical location of codes vs component: functionality
Component diagrams
Package: physical location of codes vs component: functionality
“4+1” View
https://www.cs.ubc.ca/~gregor/teaching/papers/4+1view-architecture.pdf
• Conceptual and Physical
• We discussed logical
view so now process
view
“4+1” View
https://www.cs.ubc.ca/~gregor/teaching/papers/4+1view-architecture.pdf
• Conceptual and Physical
• We discussed logical
view so now process
view
Physical view
Where do things run
Physical view
Where do things run
Deployment Diagrams
• Deployment Diagrams
– models the run-time architecture of a system
– shows the configuration of the hardware elements (nodes) and
shows how software elements and artifacts are mapped onto
those nodes
• A Node is a hardware or software element, shown as a
three-dimensional box shape
Deployment diagram
• Node Instance: Name and base node type
• Node types
– standard stereotypes are provided for nodes, «cdrom»,
«cd-rom», «computer», «disk array», «pc», «pc client», «pc
server», «secure», «server», «storage», «unix server», «user
pc».
Deployment diagram
• Node Instance: Name and base node type
• Node types
– standard stereotypes are provided for nodes, «cdrom»,
«cd-rom», «computer», «disk array», «pc», «pc client», «pc
server», «secure», «server», «storage», «unix server», «user
pc».
Deployment diagram
• Artifact (soft parts)
– Any product of the software development: source files,
executables, design documents, test reports, prototypes,
user manuals, etc.
– An artifact is denoted by a rectangle showing the artifact
name, the «artifact» keyword and a document icon.
Deployment diagram
• Artifact (soft parts)
– Any product of the software development: source files,
executables, design documents, test reports, prototypes,
user manuals, etc.
– An artifact is denoted by a rectangle showing the artifact
name, the «artifact» keyword and a document icon.
Deployment diagram
• Association
• – An association represents a communication path between
nodes
Deployment diagram
• Association
• – An association represents a communication path between
nodes
Deployment diagram
• Node as Container
– A node can contain other elements, such as components or
artifacts.
Deployment diagram
• Node as Container
– A node can contain other elements, such as components or
artifacts.
Deployment diagram
Deployment diagram

AN introduction to Software Engineering and Data.pptx

  • 1.
  • 2.
  • 3.
    Modelling Language • Twoimportant components of a software development methodology: – Process (discussed in the previous lecture) – Modelling language • a well defined (modelling) language describes a system, which has clear syntax and semantics suitable for both human and computer interpretation (standard) • model design (connected with actual coding)
  • 4.
  • 5.
    Process View • Modelthe dynamic aspects, communication, and runtime behavior of the system • Use either sequence or communication diagrams to model interactions in use cases • Optional: – Activity (branching or parallel) – Timing – Interaction overview (simply other scenarios) sequence activity timing Interaction overview Use case communication
  • 6.
    Sequence diagram • SequenceDiagrams show how classes/objects (or groups of objects) collaborate in some sequential behaviour. – Which means class diagram is done! • Used to model how objects interact together. • Generally a Sequence Diagram describes one Use Case.
  • 7.
    Sequence diagram • Messageexchange – Communication between objects is achieved by exchanging messages • The objects send messages to each other – These messages lead to the operations, which means that an object understands or responses precisely those messages for which it has operations
  • 8.
    Sequence diagram • Graphically,a sequence diagram : – shows classes/objects arranged along the X axis – messages, ordered in increasing time, along the Y axis. • The object that initiates the action is placed on the left and other increasingly subordinate objects to the right.
  • 9.
    Sequence diagram • Class/Objects –Shows instance name and/or class name (instance_name:class_name) John: People
  • 10.
    Sequence diagram • Alifeline shows the life of an object • The X(cross) shows the point at which the object is deleted John: People
  • 11.
    Sequence diagram • Focusof control – a long, hollow, narrow rectangle placed over a lifeline – shows object has control (sending or receiving messages) John: People
  • 12.
    Sequence diagram • Message –Shown by a line with a filled in arrow head – Message name as the class method – Private methods as messages • Message return (optional) – Shown by dotted line with empty arrow head https://www.bing.com/videos/riverview/ relatedvideo? q=sequence+diagram+symbols&mid=FFC23A A53D53318904D0FFC23AA53D53318904D0& FORM=VIRE John: People UOW: University enrol success (return)
  • 13.
  • 14.
    So far… • Usecase: system functionality or user requirement • Class/object: implement use case • State: events change object status • Sequence: model objects’ sequential behavior • How to design?
  • 15.
    B-C-E design • Considerapplying the B-C-E model (also known as MVC pattern) – Entity layer (Model) • Holds the data and is responsible for its persistence. • Class, attributes, methods – Control layer (Control) • Contains the rules about how to combine info and how to deal with interaction • A third-party coordinator(sequence diagram) – Boundary layer (View) • Responsible for representing info to user and to receive user interactions. • User interface (like front-page, mobile app)
  • 16.
    B-C-E design • Boundarylayer (View) – The interaction between the user and the system – A boundary class does not provide the actual behavior of the use case - it typically represents the GUI - e.g. dialog, menu, screen. – Actors interact only with boundary classes, to perform the use case
  • 17.
    B-C-E design • Controllayer (Control) – The main *use case* controller class to coordinates all the messaging between the entity classes • The use case controller implements the sequence diagram messaging. – They are the “glue” between boundary and entity classes – i.e. they connect the user with the data and logic – They contain the application-specific business rules • A student should enroll in 4 subjects per semester; a customer cannot withdraw more than $800 per day. – One control class per use case (some use cases may not need one) • They are created when the system performs the use case and usually die when the use case is performed
  • 18.
    B-C-E design • Entitylayer (Model) – Coding work – Represent business domain concepts – you will usually have identified many in the domain class diagram – Entity classes used to store and manage information in the system – they map directly to database tables – Some entity classes may be transient – i.e. they do not get stored in DB but are only temporary
  • 19.
    B-C-E design • Separatedroles • Work in parallel • Left figure shows an alternative way, without touching controller, but returns the results
  • 20.
    B-C-E design • 2representations: – Circle for class, line for association between class – Add prefix
  • 21.
    B-C-E design • Applyingthe B-C-E framework – Take an ATM system. A use case has been identified called Withdraw Cash. – A class diagram models this system. The diagram is not well designed.
  • 22.
  • 23.
  • 24.
  • 25.
    Process View: Communications diagrams • Conveythe same information as a sequence diagram – a difference in style. – Sequence diagrams focus on messages occurring over a timeline – Communication diagrams focus more on links between participating objects • sequence is less clear (order info can be unclear) and relationships are more clear
  • 26.
  • 27.
    Process View: Interaction OverviewDiagrams • Interaction overview diagram – a form of activity diagram in which the nodes represent “interaction diagrams”. • sequence, communication, and interaction overview diagram (from another level) – New elements: • interaction occurrences • interaction elements
  • 28.
    Process View: InteractionOverview Diagrams
  • 29.
  • 30.
    Development View • Componentdiagrams illustrate the pieces of software, embedded controllers, etc., that will make up a system. – show the relationship between different parts – organise the system (show subsystems) • The term "component" refers to a module of classes that represent independent systems or subsystems with the ability to interface with the rest of the system. • A component is usually implemented by one or more classes (or objects) at runtime.
  • 31.
    Component diagrams • Component:rectangles – Class or (sub)system needs to communicate with others to perform something (provide services) – Assembly Connector • Provided interface symbols with a complete circle at their end represent an interface that the component provides • Required Interface symbols with only a half circle at their end represent an interface that the component requires – In both cases, the interface's name is placed near the interface symbol itself.
  • 32.
    Component diagrams Package: physicallocation of codes vs component: functionality
  • 33.
    Component diagrams Package: physicallocation of codes vs component: functionality
  • 34.
  • 35.
  • 36.
  • 37.
  • 38.
    Deployment Diagrams • DeploymentDiagrams – models the run-time architecture of a system – shows the configuration of the hardware elements (nodes) and shows how software elements and artifacts are mapped onto those nodes • A Node is a hardware or software element, shown as a three-dimensional box shape
  • 39.
    Deployment Diagrams • DeploymentDiagrams – models the run-time architecture of a system – shows the configuration of the hardware elements (nodes) and shows how software elements and artifacts are mapped onto those nodes • A Node is a hardware or software element, shown as a three-dimensional box shape
  • 40.
    Deployment diagram • NodeInstance: Name and base node type • Node types – standard stereotypes are provided for nodes, «cdrom», «cd-rom», «computer», «disk array», «pc», «pc client», «pc server», «secure», «server», «storage», «unix server», «user pc».
  • 41.
    Deployment diagram • NodeInstance: Name and base node type • Node types – standard stereotypes are provided for nodes, «cdrom», «cd-rom», «computer», «disk array», «pc», «pc client», «pc server», «secure», «server», «storage», «unix server», «user pc».
  • 42.
    Deployment diagram • Artifact(soft parts) – Any product of the software development: source files, executables, design documents, test reports, prototypes, user manuals, etc. – An artifact is denoted by a rectangle showing the artifact name, the «artifact» keyword and a document icon.
  • 43.
    Deployment diagram • Artifact(soft parts) – Any product of the software development: source files, executables, design documents, test reports, prototypes, user manuals, etc. – An artifact is denoted by a rectangle showing the artifact name, the «artifact» keyword and a document icon.
  • 44.
    Deployment diagram • Association •– An association represents a communication path between nodes
  • 45.
    Deployment diagram • Association •– An association represents a communication path between nodes
  • 46.
    Deployment diagram • Nodeas Container – A node can contain other elements, such as components or artifacts.
  • 47.
    Deployment diagram • Nodeas Container – A node can contain other elements, such as components or artifacts.
  • 48.
  • 49.