This document discusses random variables, probability types, and related concepts such as independent and dependent events, probability distributions, and Bayes' theorem. It also covers the significance of data analysis and advanced analytics in deriving insights, as well as techniques for exploratory data analysis, including handling missing values and visualizing data through plots. Lastly, it emphasizes the importance of understanding distributions in both statistics and machine learning applications.
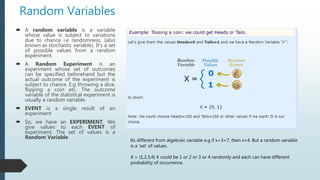
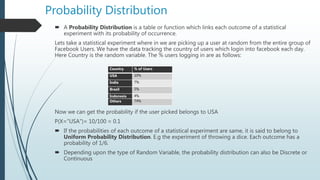
![Types of Random Variables
It can be of 3 types:
> Discrete: It can take only integer values e.g [0,1,-1,2,3,4]
> Continuous: It can take any value from a range of values
> Categorical: It can only take a value from a fixed set of values
The actual value of a random variable can not be determined beforehand. However the range
of values it can take, can be pre-determined. E.g the roll of a dice, length of a tweet etc](https://image.slidesharecdn.com/machinelearning-session2-180915175530/85/Machine-learning-session2-2-320.jpg)


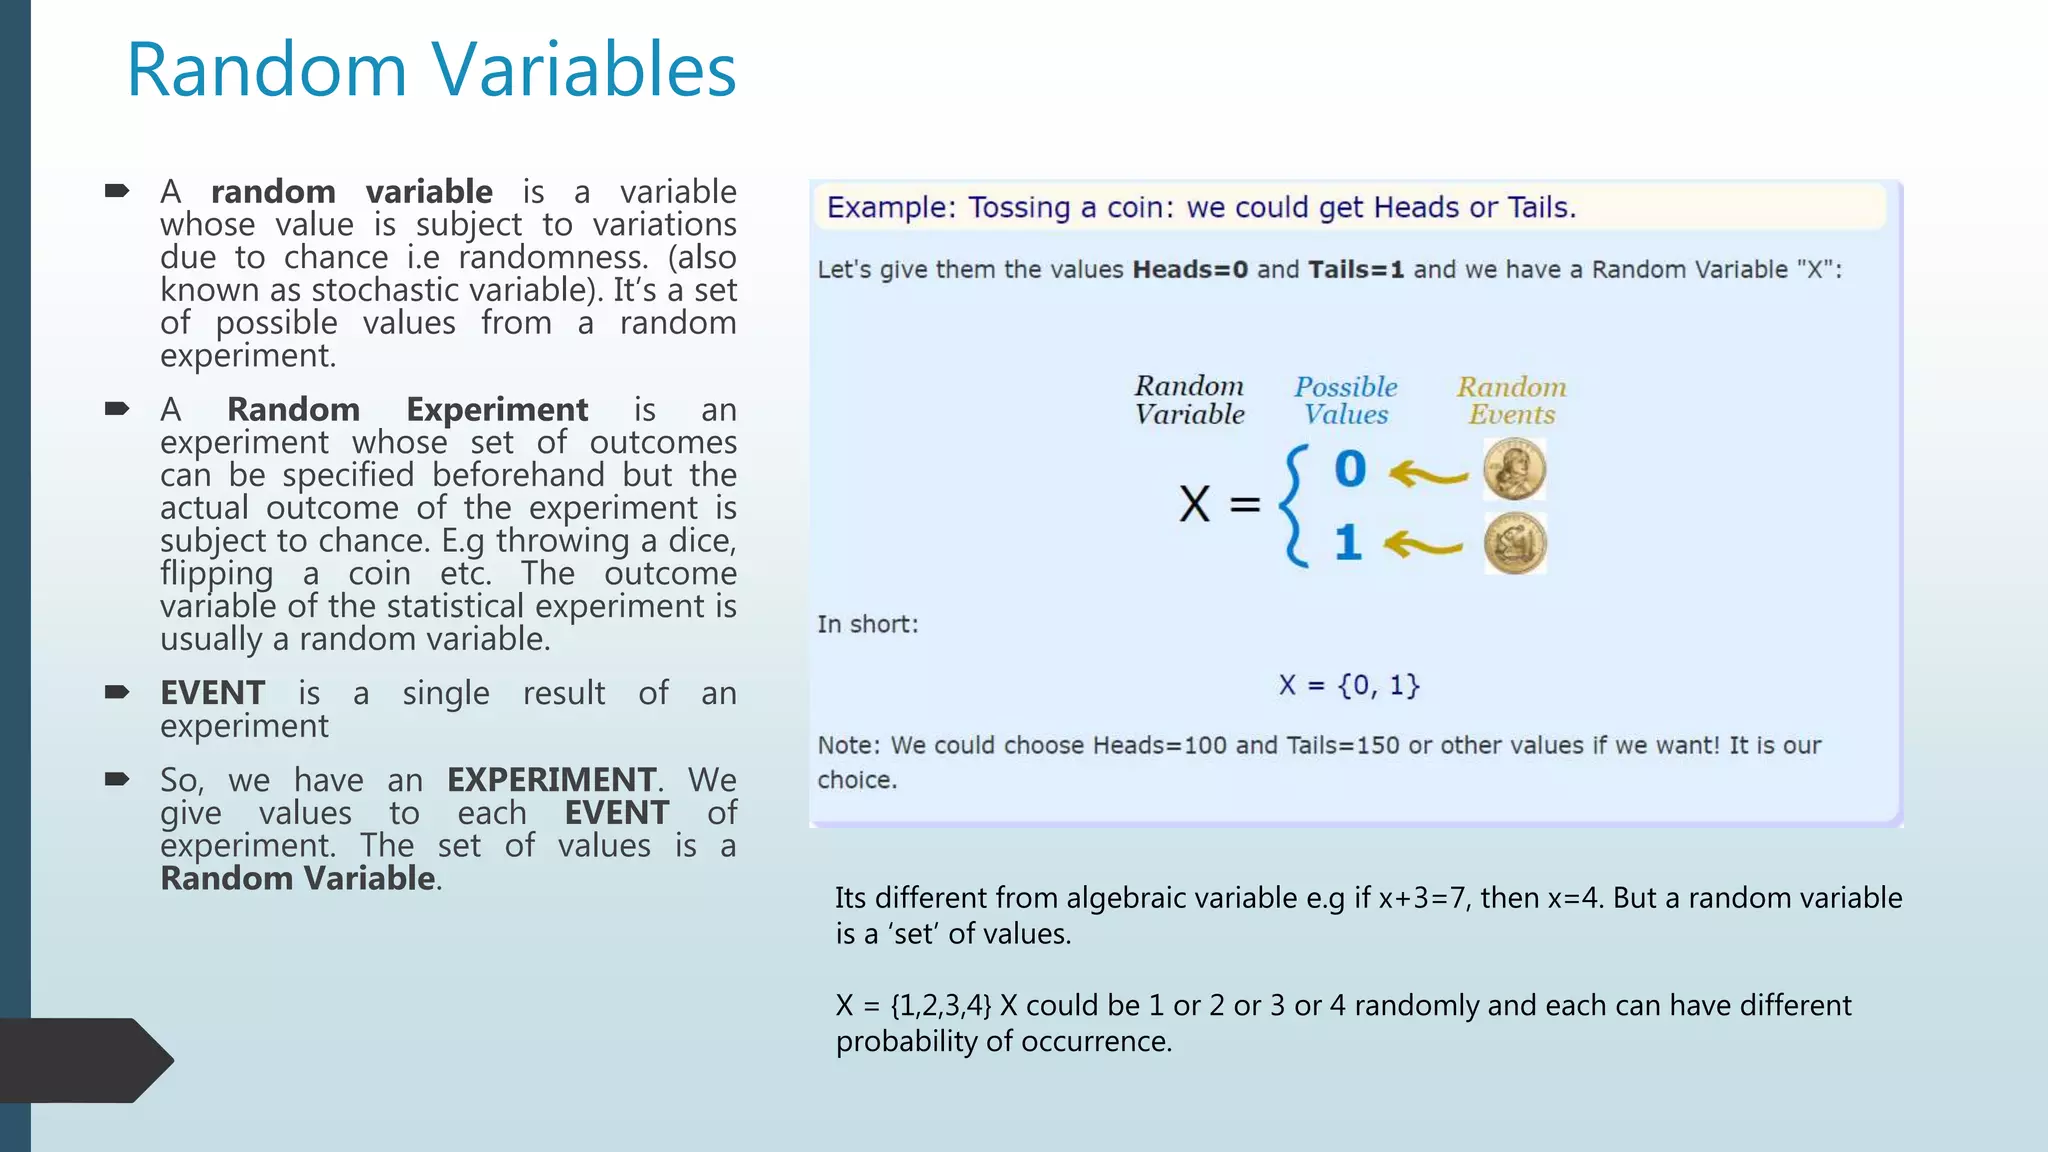
![Bayes Theorem
P(disease) = 0.008
P(~disease) = 0.992
P(POS|disease) = 0.98
P(NEG|disease) = 0.02
P(NEG|~disease)=0.97
P(POS|~disease) = 0.03
P(disease|POS) = ??
As per Bayes Theorm:
P(disease|POS) = [P(POS|disease)* P(disease)]/P(POS)
P(POS) = P(POS|disease)* P(disease)] + P(POS|~disease)* P(~disease)]
P(disease|POS) = 0.98*0.008/(0.98*0.008 + 0.03*0.992) = 0.21
P(~disease|POS) = 0.03*0.992/(0.98*0.008 + 0.03*0.992) = 0.79
The person has only 21% chance of getting the disease](https://image.slidesharecdn.com/machinelearning-session2-180915175530/85/Machine-learning-session2-13-320.jpg)