Downloaded 58 times

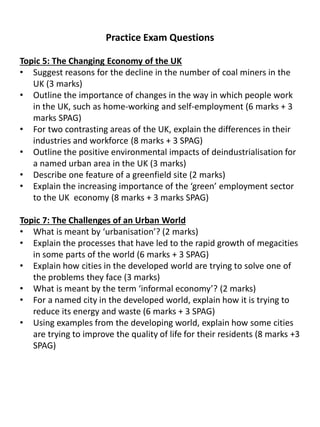
![Key terms
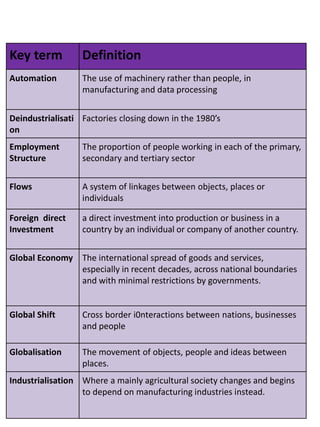
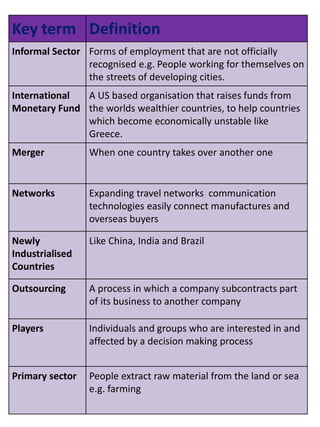
Automated Using machinery rather than people in manufacturing and data processing
Knowledge economy Based on knowledge and mental skills
Biotechnology Application of science to global problems [examples on p 221]
Household income Total income earned by everyone in a household, after paying tax.
Public sector Local and national government organisations, e.g. NHS
Domino effect A chain reaction that occurs when a small change causes a similar change
nearby, which then causes another similar change, and so on in linear
sequence.
Economic Diversification Creating varied industries and economic activities ; then if one fails, it won’t
affect the others
Brownfield site An area of land that has been built on before and can be built on again
Greenfield site An area of land which has not previously been built upon
Digital economy Based on digital technology
Green employment Jobs that are created to improve the environment - e.g. building wind
turbines
Deprived area An area in which there is a damaging lack of the material benefits that are
considered to be basic necessities e.g. employment, housing etc.
Derelict land Land on which factories or houses have been demolished
Employment structure The proportions of people who work in primary, secondary, tertiary or
quaternary jobs
Formal sector Work where people are formally employed, with permanent jobs and
regular pay
Informal sector Forms of employment that are not officially recognised e.g. people working
for themselves on the streets of developing cities
Regeneration Growth in areas that have experienced decline in the past
Telecommuter Person who works away from the office through the use of the internet](https://image.slidesharecdn.com/gcse-unit2revision-editedfor2014-161005212140/85/Gcse-unit-2-revision-edited-for-2014-55-320.jpg)
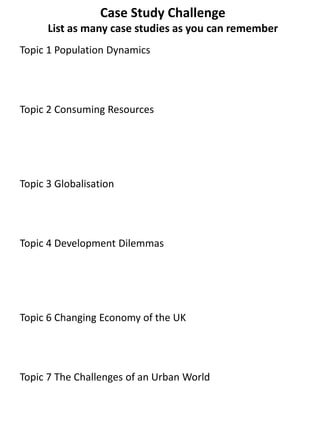
![Key terms
Urbanisation The rise in the percentage of people living in urban areas, in
comparison with rural areas.
Rural-urban migration The movement of people from the countryside to cities.
Natural increase (internal
growth)
The birth rate minus the death rate for a place. In cities this helps to
drive up the population.
Megacities Cities with a population of over 10 million people.
Spatial growth City growth in space (where they grow)
Conurbations When cities merge with other growing cities nearby.
Informal economy Refers to jobs that have little, or no, job security (e.g. street trading). No
tax is paid.
Formal economy Refers to jobs with contracts of employment and more job security.
Hyperurbanisation Where the urban population is growing so fast that the city can’t cope
with people’s needs.
Concentrated Resource
Consumption
Cities represent 2% of the Earth’s surface, but consume 75% of its
resources.
Counter-urbanisation Where people migrate out of cities to live in rural areas
Eco-footprint Measures the area of land needed to provide all the resources and
services consumed and absorb all the waste produced (measured in
global hectares per person [gha])
Retro-fitting Adding new energy-saving and energy-efficiency features to existing
homes and public buildings
Congestion charge A fee for motorists travelling within a city. The main aims are to reduce
traffic congestion and to raise funds for investment in the city’s transport
system. London’s congestion charge was one of the first to be
introduced.
Quality of life About more than how much money people have. It can include things
like housing, employment, the environment, access to services and so
on.
Favela The words used in Brazil for shanty town (area of slum housing)
NGOs Non-governmental Organisations – develop small scale sustainable
solutions to local problems in developing countries e.g. Oxfam, the Red
Cross, and WaterAid are examples of NGOs
Maternal death The death of a woman during pregnancy or shortly after childbirth.
Urban planning Determining and drawing up plans for the future physical arrangement
and condition of a community.](https://image.slidesharecdn.com/gcse-unit2revision-editedfor2014-161005212140/85/Gcse-unit-2-revision-edited-for-2014-64-320.jpg)


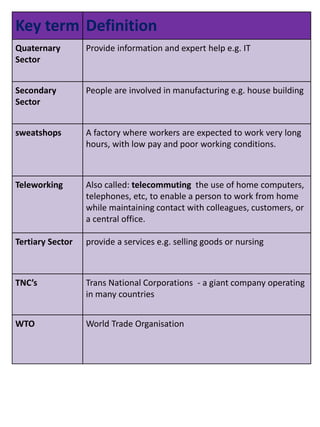
The document provides information about revising for the GCSE Geography exam on People and the Planet. It outlines the exam structure, with sections on population dynamics, consuming resources, and globalization. For population dynamics, it discusses topics like population trends, theories of population change, and case studies on population policies. It also provides information on defining and classifying different resource types, renewable and non-renewable resources, and ways to reduce resource demand.


![Population policies of develovping countries [autosaved]](https://cdn.slidesharecdn.com/ss_thumbnails/populationpoliciesofdevelovpingcountriesautosaved-181125073711-thumbnail.jpg?width=640&height=640&fit=bounds)


