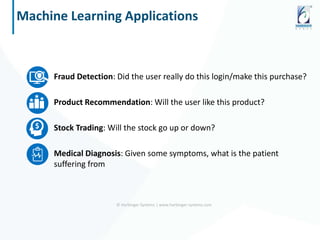
Harbinger Systems conducted a session on ‘Application of Data Science in Government Service’ at the IPMA Forum 2016 conference and expo in Lacey, WA. Read through the conference highlights.
Data Mining in Healthcare: How Health Systems Can Improve Quality and Reduce...Health Catalyst
This is the complete 4-part series demonstrating real-world examples of the power of data mining in healthcare. Effective data mining requires a three-system approach: the analytics system (including an EDW), the content system (and systematically applying evidence-based best practices to care delivery), and the deployment system (driving change management throughout the organization and implementing a dedicated team structure). Here, we also show organizations with successful data-mining-application in critical areas such as: tracking fee-for-service and value-based payer contracts, population health management initiatives involving primary care reporting, and reducing hospital readmissions. Having the data and tools to use data mining and predict trends is giving these health systems a big advantage.
The goal of this workshop is to introduce fundamental capabilities of R as a tool for performing data analysis. Here, we learn about the most comprehensive statistical analysis language R, to get a basic idea how to analyze real-word data, extract patterns from data and find causality.
This document provides an overview of data mining applications in healthcare. It discusses how electronic health records have increased the amount of patient data available and how healthcare organizations are now using data mining and predictive analytics to optimize efficiency and quality. The document outlines several common uses of data mining in healthcare, such as predictive medicine, fraud detection, and measuring treatment effectiveness. It also describes some common data mining algorithms like decision trees and neural networks that are applied in healthcare. Finally, the document discusses future opportunities for data mining in healthcare like improved data sharing and more integrated web mining tools.
HEALTH PREDICTION ANALYSIS USING DATA MININGAshish Salve
Data mining techniques are used for a variety of applications. In healthcare industry, datamining plays an important
role in predicting diseases. For detecting a disease number of tests should be required from the patient. But using data
mining technique the number of tests can be reduced. This reduced test plays an important role in time and performance.
This report analyses data mining techniques which can be used for predicting different types of diseases. This report reviewed
the research papers which mainly concentrate on predicting various disease
Exploratory data analysis data visualization:
Exploratory Data Analysis (EDA) is an approach/philosophy for data analysis that employs a variety of techniques (mostly graphical) to
Maximize insight into a data set.
Uncover underlying structure.
Extract important variables.
Detect outliers and anomalies.
Test underlying assumptions.
Develop parsimonious models.
Determine optimal factor settings
Statistics For Data Science | Statistics Using R Programming Language | Hypot...Edureka!
( ** Data Science Certification Using R: https://www.edureka.co/data-science ** )
This Edureka tutorial on "Statistics for Data Science" talks about the basic concepts of Statistics, which is primarily an applied branch of mathematics, that attempts to make sense of observations in the real world. Statistics is generally regarded as one of the most crucial aspects of data science.
Introduction to statistics
Basic Terminology
Categories in Statistics
Descriptive Statistics
Reasons for moving to R
Descriptive Statistics in R Studio
Inferential Statistics
Inferential Statistics using R Studio
Check out our Data Science Tutorial blog series: http://bit.ly/data-science-blogs
Check out our complete Youtube playlist here: http://bit.ly/data-science-playlist
This document discusses the Green Grid framework and concepts related to green computing such as virtualization, telecommuting, and data centers. It covers virtualization of IT systems and how virtualization can promote green computing by improving server utilization rates and eliminating planned downtime. The document also discusses the role of electric utilities, power management at different levels including hardware, firmware, operating system, virtualization and data center levels, and defines key terms like hypervisor, virtual machine, and telecommuting.
Machine Learning for Disease PredictionMustafa Oğuz
A great application field of machine learning is predicting diseases. This presentation introduces what is preventable diseases and deaths. Then examines three diverse papers to explain what has been done in the field and how the technology works. Finishes with future possibilities and enablers of the disease prediction technology.
Big data comes from a variety of sources such as sensors, social media, digital pictures, purchase transactions, and cell phone GPS signals. The volume of data created each day is vast, with 2.5 quintillion bytes created daily, 90% of which has been created in just the last two years. Big data is characterized by its volume, variety, velocity and value. It requires new tools like Hadoop and MapReduce to store and analyze data across distributed systems. When dealing with big data, once complex modeling can sometimes be replaced by simple counting techniques due to the large amount of data available. Companies are beginning to generate value from big data through new insights and business models.
Artificial Intelligence: Introduction, Typical Applications. State Space Search: Depth Bounded
DFS, Depth First Iterative Deepening. Heuristic Search: Heuristic Functions, Best First Search,
Hill Climbing, Variable Neighborhood Descent, Beam Search, Tabu Search. Optimal Search: A
*
algorithm, Iterative Deepening A*
, Recursive Best First Search, Pruning the CLOSED and OPEN
Lists
The document discusses database management systems (DBMS). It defines key concepts like data, databases, and DBMS. It explains that a DBMS is software that manages databases and makes data storage and retrieval easier. The document also covers database models like relational, network and hierarchical, different types of DBMS languages, purposes of DBMS, advantages and disadvantages. It provides examples of database usage in domains like banking, airlines, universities etc.
This document outlines the requirements specification for a research project on video watermarking. The main aims of the project are to address copyright protection of digital video and develop a video watermarking scheme based on the Discrete Wavelet Transform using Matlab Simulink. The goals are to embed a watermark imperceptibly into video while making it robust against various attacks. The justification is that video faces increased attacks compared to other media. The work schedule outlines tasks from February to June 2015 including research, planning, analysis, design, coding and testing.
This document provides an overview of pattern recognition techniques. It begins with an introduction to pattern recognition and its applications. It then outlines the syllabus, which includes topics like design principles, statistical pattern recognition, parameter estimation methods, principal component analysis, linear discriminant analysis, and classification techniques. Under each topic, it provides further details and explanations.
It is an introduction to Data Analytics, its applications in different domains, the stages of Analytics project and the different phases of Data Analytics life cycle.
I deeply acknowledge the sources from which I could consolidate the material.
Chapter - 5 Data Mining Concepts and Techniques 2nd Ed slides Han & Kambererror007
The document discusses Chapter 5 from the book "Data Mining: Concepts and Techniques" which covers frequent pattern mining, association rule mining, and correlation analysis. It provides an overview of basic concepts such as frequent patterns and association rules. It also describes efficient algorithms for mining frequent itemsets such as Apriori and FP-growth, and discusses challenges and improvements to frequent pattern mining.
Statistics And Probability Tutorial | Statistics And Probability for Data Sci...Edureka!
Here are the steps to calculate the standard deviation of the numbers:
1) Find the mean (average) of the numbers: (9 + 2 + 5 + ... + 10 + 9 + 6 + 9 + 4) / 20 = 7
2) For each number, subtract the mean and square the result:
(9 - 7)2 = 4
(2 - 7)2 = 49
...
(4 - 7)2 = 9
3) Sum all the squared differences: 4 + 49 + ... + 9 = S
4) Divide the sum by the number of values minus 1: S / (20 - 1)
5) Take the square root. This is the standard
A MapReduce job usually splits the input data-set into independent chunks which are processed by the map tasks in a completely parallel manner. The framework sorts the outputs of the maps, which are then input to the reduce tasks. Typically both the input and the output of the job are stored in a file-system.
MapReduce is a programming framework that allows for distributed and parallel processing of large datasets. It consists of a map step that processes key-value pairs in parallel, and a reduce step that aggregates the outputs of the map step. As an example, a word counting problem is presented where words are counted by mapping each word to a key-value pair of the word and 1, and then reducing by summing the counts of each unique word. MapReduce jobs are executed on a cluster in a reliable way using YARN to schedule tasks across nodes, restarting failed tasks when needed.
This document discusses association rule mining. Association rule mining finds frequent patterns, associations, correlations, or causal structures among items in transaction databases. The Apriori algorithm is commonly used to find frequent itemsets and generate association rules. It works by iteratively joining frequent itemsets from the previous pass to generate candidates, and then pruning the candidates that have infrequent subsets. Various techniques can improve the efficiency of Apriori, such as hashing to count itemsets and pruning transactions that don't contain frequent itemsets. Alternative approaches like FP-growth compress the database into a tree structure to avoid costly scans and candidate generation. The document also discusses mining multilevel, multidimensional, and quantitative association rules.
This document discusses objectives and techniques for data exploration, including understanding data, preparation for data mining, and interpreting results. It outlines univariate and multivariate descriptive statistics, various data visualization techniques like histograms and scatter plots, and provides a roadmap for exploring a data set through organizing, finding central points, understanding attribute spreads, visualizing distributions, pivoting data, identifying outliers, understanding relationships between attributes, visualizing those relationships, and visualizing high-dimensional data sets.
MRUnit is a testing library that makes it easier to test Hadoop jobs. It allows programmatically specifying test input and output, reducing the need for external test files. Tests can focus on individual map and reduce functions. MRUnit abstracts away much of the boilerplate test setup code, though it has some limitations like a lack of distributed testing. Overall though, the benefits of using MRUnit to test Hadoop jobs outweigh the problems.
The document provides an introduction to data analytics, including defining key terms like data, information, and analytics. It outlines the learning outcomes which are the basic definition of data analytics concepts, different variable types, types of analytics, and the analytics life cycle. The analytics life cycle is described in detail and involves problem identification, hypothesis formulation, data collection, data exploration, model building, and model validation/evaluation. Different variable types like numerical, categorical, and ordinal variables are also defined.
Artificial intelligence and knowledge representationSajan Sahu
The document discusses artificial intelligence and knowledge representation. It describes how computers can be made intelligent through speed of computation, filtering responses, using algorithms and neural networks. It also discusses knowledge representation techniques in AI like propositional logic, semantic networks, frames, predicate logic and nonmonotonic reasoning. The document provides examples and applications of AI like pattern recognition, robotics and natural language processing. It also discusses some fundamental problems of AI.
Boolean,vector space retrieval Models Primya Tamil
The document discusses various information retrieval models including Boolean, vector space, and probabilistic models. It provides details on how documents and queries are represented and compared in the vector space model. Specifically, it explains that in this model, documents and queries are represented as vectors of term weights in a multi-dimensional space. The similarity between a document and query vector is calculated using measures like the inner product or cosine similarity to retrieve and rank documents.
Green computing aims to reduce the environmental impact of computing through more efficient use of computing resources and design of environmentally friendly computing technologies. Virtualization allows for server consolidation which reduces energy consumption by increasing hardware utilization. A green data center uses energy efficient technologies and design to minimize its environmental footprint.
This document is a question paper for the subject of Green Computing. It contains questions assessing students' knowledge of key concepts in green computing. The questions are divided into three parts - Part A contains 10 multiple choice questions worth 2 marks each, Part B contains 5 questions worth 13 marks each, and Part C contains 1 question worth 15 marks.
The questions in Part A cover topics such as green IT metrics, carbon footprint, green assets, data centers, teleporting, material recycling, greenwashing, ISO 14000 standards, 'As Is' state in organizations, and advantages of green IT at home. Part B questions involve explaining concepts such as the relationship between business/environment and IT, green IT strategy benefits, major
This is a deck of slides from a recent meetup of AWS Usergroup Greece, presented by Ioannis Konstantinou from the National Technical University of Athens.
The presentation gives an overview of the Map Reduce framework and a description of its open source implementation (Hadoop). Amazon's own Elastic Map Reduce (EMR) service is also mentioned. With the growing interest on Big Data this is a good introduction to the subject.
Create your Big Data vision and Hadoop-ify your data warehouseJeff Kelly
The document discusses big data market trends and provides advice on how organizations can develop a big data strategy and implementation plan. It outlines a 5 step approach for modernizing an organization's data warehouse with new big data technologies: 1) enhancing the data warehouse with unstructured data, 2) extending it with data virtualization, 3) increasing scalability with MPP databases, 4) accelerating analytics with in-database processing, and 5) creating an operational data store with Hadoop. The document also provides tips for selecting big data vendors, such as evaluating a vendor's ability to integrate with existing systems and make analytics accessible to both power users and business users.
Big Data Day LA 2016/ Data Science Track - Backstage to a Data Driven Culture...Data Con LA
When you're the first data professional at the organization there are technical, process, and qualitative considerations for analytics and data science to address (A/DS). This talk is an overview of strategy, infrastructure, and tools for creating your first A/DS stacks. At this stage, the range of problems that you are able to solve relate to organization, operational, data engineering, business intelligence, and communication. Creating the optimal A/DS stack can seamlessly pave the way to big data and integrating the newest technologies in the future. Please share your stories and experience with us as well. Outline of talk, where sections intend to be interactive and get feedback from the audience:
1. So you're the first Data Scientist
2. Setting Their Expectations
3. Lay of the Land - Data requirements and organizational survey
4. Setting Your Expectations
5. Infrastructure - Your Stack Options
6. Resources: Get Help, Get a Team
7. Discussion
Lecture on Data Science in a Data-Driven Culture Johan Himberg
The document discusses the importance of a data-driven culture for businesses. It provides the following key points:
1. Research has shown that companies that emphasize data-driven decision making have 5-6% higher productivity and output than comparable companies. This relationship also appears in other financial metrics like return on equity.
2. Data science draws from various fields like operations research, probability theory, analytics, and computer science. It is used for optimal decision making, handling uncertainties, generating insights from data, and implementing analytical solutions.
3. When adopting a data-driven approach, companies should focus on specific business goals and KPIs rather than just collecting data. Iterative testing is also important to measure impact
"Using Data Science to Design Effective Precision Preventative Behavioral Med...Hyper Wellbeing
"Using Data Science to Design Effective Precision Preventative Behavioral Medicine" - Ryan Quan (Data Scientist, Omada Health)
Delivered at the inaugural Hyper Wellbeing Summit, 14th November 2016, Mountain View, California.
For more information including details of subsequent events, please visit http://hyperwellbeing.com
The summit was created to foster a community around an emerging industry - Wellness as a Service (WaaS). Consumer technologies, in particular wearables and mobile, are powering a consumer revolution. A revolution to turn health and wellness into platform delivered services. A revolution enabling consumer data-driven disease risk reduction. A revolution extending health care past sick care towards consumer-led lifelong health, wellness and lifestyle optimization.
WaaS newsletter sign-up http://eepurl.com/b71fdr
@hyperwellbeing
Content management systems (CMS) make it super easy for you to manage the website content, its structure and design; thus saving your precious time and efforts, which you would rather focus to grow your business.
Furthermore, when the amazing looking design mock-ups are integrated into a CMS, it simply does not feel at par to provide the seamless experience across various devices, you aspired for.
UI/UX plays a critical role in your organization's success and has the capability to provide a significant and distinct competitive advantage when implemented in the right way. Harbinger Systems hosted an informative webinar on "UI/UX best practices in CMS based web design" on December 3rd, 2015. Attendees gained insights on various practices, processes and design strategies to create and deliver a rich and exceptional UI/UX for your CMS based website.
This document discusses machine learning and its applications. It begins with defining machine learning as a type of artificial intelligence that allows computers to learn from data without being explicitly programmed. It then discusses how machine learning can help extract useful information from enterprise data. Several examples of machine learning problems are presented, such as price prediction, targeted marketing, and personalized recommendations. The document also covers common machine learning algorithms, tools, and real-world use cases.
Gain New Insights by Analyzing Machine Logs using Machine Data Analytics and BigInsights.
Half of Fortune 500 companies experience more than 80 hours of system down time annually. Spread evenly over a year, that amounts to approximately 13 minutes every day. As a consumer, the thought of online bank operations being inaccessible so frequently is disturbing. As a business owner, when systems go down, all processes come to a stop. Work in progress is destroyed and failure to meet SLA’s and contractual obligations can result in expensive fees, adverse publicity, and loss of current and potential future customers. Ultimately the inability to provide a reliable and stable system results in loss of $$$’s. While the failure of these systems is inevitable, the ability to timely predict failures and intercept them before they occur is now a requirement.
A possible solution to the problem can be found is in the huge volumes of diagnostic big data generated at hardware, firmware, middleware, application, storage and management layers indicating failures or errors. Machine analysis and understanding of this data is becoming an important part of debugging, performance analysis, root cause analysis and business analysis. In addition to preventing outages, machine data analysis can also provide insights for fraud detection, customer retention and other important use cases.
AlgoAnalytics is the “one stop AI shop”. We are the best organization in India as far as applied machine learning expertise is considered. We aim to be the one of the best in the world.
We work at the intersection of mathematics, computer science and specific domain knowledge like finance, retail, healthcare, manufacturing and others. We have developed expertise in handling structured/numerical, image and text data and integrating the intelligence gathered from heterogeneous data which is combination of structured and un-structured.
We integrate the cutting edge tools and technologies with our strong domain expertise to design predictive analytics solutions for businesses.We are proficient in classical as well as deep learning methodologies. In AlgoAnalytics we extensively use tools like R-Caret, Scikit-learn, Tensorflow, Theano and Microsoft Cognitive toolkit (CNTK).
How To Pick The Best Analytics Tools: Product Analytics Landscape
Here, we’ll talk about assessment criteria, key features, and greater for deciding on systems and gear that match your enterprise app development desires.
Choosing the right solution for your data
Because massive facts apply to the sort of huge spectrum of use app development instances, packages, and industries, it’s difficult to nail down a definitive listing of choice criteria.
Types of data analytics tools & key features
What is the gear used for massive facts analytics? Data analytics tools gear constitute a huge category, though they have a tendency to fall into some key groups.
Customer data platforms
Customer data platforms like customer relationship management platforms (CRM) seize purchaser facts that may be used to enhance strategies or promote products. However, CDPs take matters to the following level.
Core capabilities:
• 360-diploma view of the purchaser.
• Connect more than one fact source.
• Unifies purchaser facts throughout all linked structures.
• Improve concentrated on for advertising campaigns.
Business intelligence (BI) tools
Today’s business intelligence (BI) assists companies to see iOS app development and apprehend facts. According to gartner, BI gear span 3 major categories. Online analytical processing, or OLAP, permits fact discovery, ad-hoc reporting, simulation fashions, overall performance control, and different complicated evaluation abilities. There’s additionally statistics transport–which serves up insights within the shape of visualizations, reports, and dashboards. And finally, BI integration–which offers metadata control and imparting app developers surroundings to assist your method.
Core capabilities:
• Data visualization.
• Predictive modeling.
• Data mining.
• Forecasting.
Customer analytics tools
Customer analytics is designed to control the overall analytics technique from guidance to perception generation. In maximum instances, purchaser analytics systems include web development pre-built facts fashions for forecasting, propensity to buy, and numerous statistical evaluation strategies to apprehend purchaser conduct and optimize products, offerings, and reports.
Core capabilities:
• Granular segmentation.
• Customer satisfaction Insights.
• Statistical modeling.
• Acquisition, retention, & churn metrics.
Digital experience platforms
Digital experience platforms is a new kind of enterprise-grade software development designed to optimize the purchaser revel in at each touchpoint. While DXPs overlap with purchasers revel in control systems, DXPs cognizance greater on streamlining strategies, coordinating and personalizing content material to customers throughout an extensive variety of channels which include the Internet of Things (IoT), virtual assistants, VR reports, and greater.
Core capabilities:
• API-first structure.
• Multi-touchpoint control.
• Dynamic templates for automating personalization.
• Content control and transport.
The document discusses data analytics and its evolution from relying on past experiences to using data-driven insights. It covers the types of analytics including descriptive, diagnostic, predictive, and prescriptive analytics. Descriptive analytics summarize past data, diagnostic analytics determine factors influencing outcomes, predictive analytics make future predictions, and prescriptive analytics identify best courses of action. The document also discusses data analysis tools, natural language processing, applications of analytics, benefits of analytics for IoT, and issues with big data in IoT contexts like smart agriculture.
Learn the advantages and disadvantages of machine learning algorithms versus traditional statistical modelling approaches to solve complex business problems.
A complete brief introduction and importance on Data Science, Data Analytics, Business Analytics, Tools used for Analytics, Artificial Intelligence and Machine Learning.
The document discusses how utilities are increasingly collecting and generating large amounts of data from smart meters and other sensors. It notes that utilities must learn to leverage this "big data" by acquiring, organizing, and analyzing different types of structured and unstructured data from various sources in order to make more informed operational and business decisions. Effective use of big data can help utilities optimize operations, improve customer experience, and increase business performance. However, most utilities currently underutilize data analytics capabilities and face challenges in integrating diverse data sources and systems. The document advocates for a well-designed data management platform that can consolidate utility data to facilitate deeper analysis and more valuable insights.
Using Machine Learning to Understand and Predict Marketing ROIDATAVERSITY
Marketing is all about attracting, retaining and building profitable relationships with your customers, but how do you know which customers to target, which campaigns to run, and which marketing programs to invest in, to get most return for your dollar?
Join Alteryx and Keyrus as we demonstrate how to combine all relevant marketing, sales and customer data, and perform sophisticated analytics to deepen customer insight and calculate ROI of marketing programs.
You’ll walk away knowing how to:
Segment and profile your customers – take that raw data and translate it into real value
Build a marketing attribution model within Alteryx, creating a personal answer engine for your company.
Leverage R or Python code in an Alteryx workflow so data scientists can collaborate with non-coding stake holders in a code-friendly and code-free environment.
Join Alteryx and Keyrus and get the actionable insights you need to drive marketing ROI analytics, and answer million-dollar questions without spending millions of dollars on standardized solutions.
TDWI Checklist - The Automation and Optimization of Advanced Analytics Based ...Vasu S
A whitepaper of TDWI checklist, drills into the data, tools, and platform requirements for machine learning to to identify goals and areas of improvement for current project
https://www.qubole.com/resources/white-papers/tdwi-checklist-the-automation-and-optimzation-of-advanced-analytics-based-on-machine-learning
The document discusses the importance of aligning business processes and information technology (IT) in supply chain management. It explains that investing in both business processes and IT leads to better supply chain performance than investing in only one. The goals of supply chain IT are described as providing visibility of supply chain data, enabling analysis of that data, and facilitating collaboration with partners. Different components of supply chain management systems are outlined, including decision support systems, enterprise resource planning software, and the use of analytics and artificial intelligence.
This document discusses trends in data analytics. It begins by defining big data and how it differs from traditional data approaches in terms of size, techniques, and ability to solve new problems. It then provides examples of big data applications across various industries like retail, automotive, healthcare, and insurance. Specifically, it outlines how big data is used for predictive analytics, personalization, fraud detection, and risk adjustment. Finally, it discusses some risks of big data like privacy issues and ensuring the right problems are addressed.
What are the the main areas of analytics and how can they benefit your business? Learn the value of SAS analytics and how you can get better insight into your data to make more profitable decisions.
By getting a better understanding of your data you will know which part of the data can be reliably forecast using time series methods and which cannot. You will also gain an understanding of any hierarchical structure in the data that can be used.
Big Data, Physics, and the Industrial Internet: How Modeling & Analytics are ...mattdenesuk
1) The document discusses how big data, analytics, and physics-based modeling can transform industrial sectors like power, manufacturing, and transportation by making machines more intelligent and efficient.
2) It argues that connecting millions of industrial machines to collect massive amounts of data, and applying advanced analytics, will improve productivity, optimize operations, and reduce costs across industries.
3) A key enabler is developing "software-defined machines" that can easily connect to the internet, run analytics apps in the cloud to become self-aware, and update capabilities without hardware changes.
Big Data Tools PowerPoint Presentation SlidesSlideTeam
The document discusses big data analysis requirements and tools. It covers where big data comes from both internally and externally. It then discusses tools for analyzing big data such as BI tools, in-database analytics, Hadoop, decision management, and discovery tools. Techniques for analyzing big data like classification tree analysis, genetic algorithms, regression analysis, machine learning, and sentiment analysis are also covered. The key benefits and a successful implementation roadmap for big data in an organization are summarized.
Big Data Analytics Architecture PowerPoint Presentation SlidesSlideTeam
Presenting this set of slides with name - Big Data Analytics Architecture Powerpoint Presentation Slides. This PPT deck displays twenty six slides with in depth research. Our topic oriented Big Data Analytics Architecture Powerpoint Presentation Slides presentation deck is a helpful tool to plan, prepare, document and analyse the topic with a clear approach. We provide a ready to use deck with all sorts of relevant topics subtopics templates, charts and graphs, overviews, analysis templates. Outline all the important aspects without any hassle. It showcases of all kind of editable templates infographs for an inclusive and comprehensive Big Data Analytics Architecture Powerpoint Presentation Slides presentation. Professionals, managers, individual and team involved in any company organization from any field can use them as per requirement.
This document provides an overview of data science tools, techniques, and applications. It begins by defining data science and explaining why it is an important and in-demand field. Examples of applications in healthcare, marketing, and logistics are given. Common computational tools for data science like RapidMiner, WEKA, R, Python, and Rattle are described. Techniques like regression, classification, clustering, recommendation, association rules, outlier detection, and prediction are explained along with examples of how they are used. The advantages of using computational tools to analyze data are highlighted.
The document discusses how traditional sources of competitive advantage are diminishing, and that data and predictive analytics now represent an opportunity for companies to gain a unique advantage. Specifically:
- Costs of data storage, processing and predictive tools are falling rapidly, allowing companies to leverage large amounts of data.
- Combining internal data sources with customer and third-party data, then developing predictive models and actuating on those predictions can provide significant competitive differentiation.
- To take advantage of this opportunity, companies need to build a data-centric culture, train staff in data and analytics, and focus on competencies like data capture, integration, modeling and engineering data-driven interventions.
Similar to Application of Data Science in Government Services – IPMA Forum 2016 Speaker Session (20)
This document discusses using people analytics for a sustainable remote workforce. It outlines how people analytics can help frontline managers with decision making, monitoring operations, productivity, safety and recruitment using metrics from applicant tracking systems. It also discusses the challenges faced by Chief Data Science Officers in areas like data wrangling, mature AI operations and building skilled teams. Emerging technologies around hyperautomation, internet of behaviors and total experience will facilitate real-time analytics and seamless workflows across HR and collaboration tools to drive business outcomes.
EdTech advanced rapidly in 2020 as schools switched to remote learning due to Covid-19. In 2021, 5 trends will drive further transformation: 1) AI will help identify skill gaps and recommend content; 2) Educators will need more professional development and user-friendly tools; 3) Digital transformation will create hybrid learning ecosystems; 4) Systems will integrate data to personalize learning; 5) Equity will require asynchronous learning and addressing the digital divide. EdTech providers must prepare for continued growth by addressing these trends and challenges.
In this webinar you will,
- Identify what kind of content is a good candidate for transformation to learning
- Understand the ecosystem to transform content to learning experiences
- Know how to harness technology and content services to provide a rich learning experience to your employees
- Learn about some tools that can expedite your content transformation journey
Find out the opportunities to build integrations that facilitate seamless exchange of information across internal and external HR applications.
In this webcast we have discussed the below pointers,
• Need for Data-Driven HR and its relevance in organizations
• Aspects of Workplace Analytics Maturity Model and how to correlate it with your needs
• Understand typical challenges in data integrations and how to solve them
• How to decide on an integration approach for your organization
This webcast is in collaboration with HR.com
In this session get to know,
- Why is HR Product Selection so Important?
- How to choose between 'Build' versus 'Buy’?
- 5 key parameters to evaluate for each technology
- How to Bridge Gaps between Products through Customizations?
With the growing need for integration between different HR applications, many leading vendors have now started following the marketplace based integration approach. This kind of an approach helps immensely in managing, streamlining, and monetizing the integrations. It also adds a lot of complexity and challenges.
Every marketplace differs from the other in terms of quality standards followed (interoperability, security, quality, etc.) and the overall integration process. For seamless integration with such marketplaces, it is essential to consider all these variations and differences.
In this webinar, our speakers Maheshkumar Kharade, AGM – Technology, and Mahesh Keni, President – Harbinger Inc, will discuss best practices for integration between different HR applications using a Marketplace Integration approach.
During this HR Tech Integration Masterclass webinar, you will understand:
• Integration scenarios between different HR applications using marketplace
• Walkthrough of integration between Background Screening Platform and Salesforce Marketplace
• Best practices to follow while integrating using marketplace
In the current job market, more than 70% of eligible candidates are part of a passive candidate pool. To effectively find and target such candidates, multiple sourcing applications and channels are the best media. If you don’t have a seamless integration between ATS/HRIS platforms and sourcing tools, then your ability to source eligible candidates from this passive pool can be drastically impacted.
In this webinar, our speakers Parag Pradhan, SVP – Sales and Maheshkumar Kharade, AGM – Technology, will discuss integration scenarios between different talent acquisition solutions and sourcing tools.
During this HRTech Integration Masterclass webinar, you will understand:
· Integration scenarios between ATS/HRIS and Candidate Sourcing Platforms
· Walkthrough of integration between ATS/HRIS and Job Board
· Best practices to follow while integrating with sourcing tools
Existing times are making us think beyond the immediate needs and instead consider different possibilities for the future. This makes recalibration the need of the hour. We have identified four areas where technology product owners can do with some insights – how to change product strategy according to changing demands; how to position a popular product in a new market; how to build a new product for an unmet need; and, finally, how to introduce something new for your existing customers.
In this webinar, our experts will address these points as well as guide you on the new challenges and behaviors of remote users. We will also have Jeremy Tillman of TrainUp share his thoughts as a guest speaker.
Key Takeaways:
- Types of recalibrations which can be considered according to market situations
- How to structure plans to fulfill unanticipated demand changes
- Tried and tested approaches that have worked for some customers, even in tough times
Have you experienced the need to collect data from different HR systems for measuring business outcomes? If yes, the struggle is real – most HR Tech applications offer different analytics support. Some with basic predefined reports, others with interactive dashboards,and the rest with self-service BI. Architecting and integrating these types of analytical capabilities needs understanding of how deeper integrations between different HR systems are done at the data layer.
Join our speakers Prachi Kulkarni, Senior General Manager - Technology and Maheshkumar Kharade, AGM - Technology, to decode this integration puzzle with powerful insights on how to deliver integrated analytical capabilities, overcome challenges in collecting data from multiple HR applications, and more. Further, attendees will get an opportunity to experience a walkthrough of how one such data warehouse implementation was done for our customers –for improved, seamless analytical capabilities.
During this HR Tech Integration Masterclass webinar, you will understand:
· How to collect data from different HR applications via integrations
· Challenges one may encounter in making HR data ready for analytics
· A tried-and-tested business case walkthrough
Learning and Development tools have seen a huge transformation over the last couple of years. Learning is not restricted to a single channel like an LMS or a repository of content. It is now a complex ecosystem of Learning Experience Platforms (LXP), Microlearning tools, Collaboration Tools, and multiple content sources. In order to deliver a seamless learning experience to organizations, one needs a sound integration strategy.
In this webinar, our speakers Bharti Satpute, General Manager – Projects, and Maheshkumar Kharade, AGM – Technology, will discuss common scenarios where we have helped our customers successfully integrate multiple learning tools into their ecosystem of HR applications. Participants will also get insights into data exchange, progress tracking, modes and levels of integration.
In these 30 minutes, you will understand:
· Different integration scenarios
· Data exchange between LMS, LXP, and HR Apps
· Learning content integration using standards
Product engineering is every software product owner’s mainstay. During normal times, product owners find the balance between market demands and their product offerings by banking on suitable design features. However, in times of disruptions, such as the current one caused by COVID-19 pandemic, it is critical to make the choice between adapting to the market needs or to go with the existing product design.
In this webinar, we will focus on how technology product owners can implement the right product strategy to address customer pain points. The session will serve as a guide for owners to structure their plans to fulfil unanticipated demand changes.
Key takeaways
- A glimpse of Harbinger's framework for selecting between market demands and product offerings
- Success stories of some technology product companies which focused on the same market with new products
- Snapshot of Harbinger's product strategy consulting service
In today’s pressing times, remote working plays a critical role for organizations to function smoothly. Harbinger Systems brings to you a comprehensive webinar on integrations – how the systems of records such as HRIS, LMS, and project management; and systems of engagements such as collaboration tools and engagement platforms can effectively work together to make lives easier.
Our speakers, Dr. Vikas Joshi, CEO - Harbinger Group and Maheshkumar Kharade, AGM Technology - Harbinger Systems, will share insights on the ways in which different platforms can be integrated with organization-specific scenarios and workflows. This will prove to be vital as companies will be required to opt for collaboration tools in the post-pandemic circumstances as well.
In this 30-minute webinar you will understand:
• Emerging integration requirements in HR Tech due to impact of COVID-19
• Multiple integration approaches and examples
• How to create a checklist for your integration workflows
The document discusses key trends in applying artificial intelligence to human resources technologies. It outlines how AI is increasingly being used in talent acquisition, training and development, compensation and other HR functions. The top expectations for AI-enabled HR applications are the ability to analyze data, predict outcomes, personalize experiences, and automate tasks. Examples of AI applications described include candidate matching and scoring, personalized learning experiences, and AI-based HR help desks. Challenges to the adoption of AI include ensuring data quality, explaining AI results, and addressing potential bias. Overcoming these challenges requires transforming raw data, providing insights into how AI models work, and creating explainable interfaces.
Employee Engagement is at the heart of Continuous Performance Management products and chatbot helps reinforce employee engagement across the organization.
The document discusses how mobile apps can be used to support key HR functions. It describes features for recruiting, onboarding, performance management, learning and development, payroll, core HR, leave management, time and attendance, approvals, scheduling, employee self-service, manager self-service, company communication, and help desk tools. For each function, it provides usage statistics, key mobile features, and mockups of device-specific features like push notifications and location services. The overall document examines how a mobile HR app can enable employees to access HR services anytime from any device.
A webinar on HR Tech chatbots - Guide to automate HR applications using AI and ML by Harbinger Systems.
What You Will Learn
• AI and ML trends related to HR tech applications
• Examples of chatbots in Recruitment, Time Off, Payroll and Benefits
• Insights and comparison of available AI tools and technologies for building chatbots
• Challenges in adoption and deployment of chatbots and how to overcome those
Presented by Shrikant Pattathil - President and Mahesh Kharade - AGM, Technology at Harbinger Systems.
Harbinger Systems, a technology partner to leading product companies, in its zeal to foster a work environment where employees feel engaged and motivated, has been utilizing various innovative methods to promote continuous dialog with employees and provide continuous feedback. The results are striking! These efforts improved productivity on business deliverables, increased customer satisfaction enabling multi-year engagements and minimized employee turnover.
Maintaining employee engagement has been ranked as one of the top priorities of organizations for years. It has been clearly established that when employees are given regular feedback (be it positive or adjusting), they feel cared for. Such employees who feel valued are often the most engaged employees.
The real challenge lies in the effective implementation of continuous feedback approach. Due to the increasing demands of their role, managers/leaders find it arduous to engage with their employees on a regular basis.
Technology can really play a pivotal role in simplifying and facilitating open dialog and continuous feedback in organizations, by building on ideas of One-on-One's and Pulse meetings. Technology can also aid in generating and bringing out meaningful, actionable insights by analyzing data gathered from the various feedback channels.
Thank you for joining us for an insightful webinar on " Engage for Success: Improve Workforce Engagement with Open Communication and Continuous Feedback". Attendees got insights on the cost of employee disengagement, The relation between continuous feedback and workforce engagement, and how Harbinger improved employee engagement through open communication. We would also conduct a demo of system to manage and track such communication.
The document discusses how people analytics can help modernize HR solutions and enable data-driven decision making. It provides examples of how people analytics improved talent acquisition quality at one company by profiling candidates and analyzing sentiment, and how it helped another company bridge skill gaps and boost employee engagement in training programs. The methodology section outlines common people analytics problem types and how insights can be extracted from HR data sources to inform strategic HR and business decisions.
Ivanti’s Patch Tuesday breakdown goes beyond patching your applications and brings you the intelligence and guidance needed to prioritize where to focus your attention first. Catch early analysis on our Ivanti blog, then join industry expert Chris Goettl for the Patch Tuesday Webinar Event. There we’ll do a deep dive into each of the bulletins and give guidance on the risks associated with the newly-identified vulnerabilities.
AI 101: An Introduction to the Basics and Impact of Artificial IntelligenceIndexBug
Imagine a world where machines not only perform tasks but also learn, adapt, and make decisions. This is the promise of Artificial Intelligence (AI), a technology that's not just enhancing our lives but revolutionizing entire industries.
OpenID AuthZEN Interop Read Out - AuthorizationDavid Brossard
During Identiverse 2024 and EIC 2024, members of the OpenID AuthZEN WG got together and demoed their authorization endpoints conforming to the AuthZEN API
Threats to mobile devices are more prevalent and increasing in scope and complexity. Users of mobile devices desire to take full advantage of the features
available on those devices, but many of the features provide convenience and capability but sacrifice security. This best practices guide outlines steps the users can take to better protect personal devices and information.
Main news related to the CCS TSI 2023 (2023/1695)Jakub Marek
An English 🇬🇧 translation of a presentation to the speech I gave about the main changes brought by CCS TSI 2023 at the biggest Czech conference on Communications and signalling systems on Railways, which was held in Clarion Hotel Olomouc from 7th to 9th November 2023 (konferenceszt.cz). Attended by around 500 participants and 200 on-line followers.
The original Czech 🇨🇿 version of the presentation can be found here: https://www.slideshare.net/slideshow/hlavni-novinky-souvisejici-s-ccs-tsi-2023-2023-1695/269688092 .
The videorecording (in Czech) from the presentation is available here: https://youtu.be/WzjJWm4IyPk?si=SImb06tuXGb30BEH .
Digital Marketing Trends in 2024 | Guide for Staying AheadWask
https://www.wask.co/ebooks/digital-marketing-trends-in-2024
Feeling lost in the digital marketing whirlwind of 2024? Technology is changing, consumer habits are evolving, and staying ahead of the curve feels like a never-ending pursuit. This e-book is your compass. Dive into actionable insights to handle the complexities of modern marketing. From hyper-personalization to the power of user-generated content, learn how to build long-term relationships with your audience and unlock the secrets to success in the ever-shifting digital landscape.
Generating privacy-protected synthetic data using Secludy and MilvusZilliz
During this demo, the founders of Secludy will demonstrate how their system utilizes Milvus to store and manipulate embeddings for generating privacy-protected synthetic data. Their approach not only maintains the confidentiality of the original data but also enhances the utility and scalability of LLMs under privacy constraints. Attendees, including machine learning engineers, data scientists, and data managers, will witness first-hand how Secludy's integration with Milvus empowers organizations to harness the power of LLMs securely and efficiently.
In the rapidly evolving landscape of technologies, XML continues to play a vital role in structuring, storing, and transporting data across diverse systems. The recent advancements in artificial intelligence (AI) present new methodologies for enhancing XML development workflows, introducing efficiency, automation, and intelligent capabilities. This presentation will outline the scope and perspective of utilizing AI in XML development. The potential benefits and the possible pitfalls will be highlighted, providing a balanced view of the subject.
We will explore the capabilities of AI in understanding XML markup languages and autonomously creating structured XML content. Additionally, we will examine the capacity of AI to enrich plain text with appropriate XML markup. Practical examples and methodological guidelines will be provided to elucidate how AI can be effectively prompted to interpret and generate accurate XML markup.
Further emphasis will be placed on the role of AI in developing XSLT, or schemas such as XSD and Schematron. We will address the techniques and strategies adopted to create prompts for generating code, explaining code, or refactoring the code, and the results achieved.
The discussion will extend to how AI can be used to transform XML content. In particular, the focus will be on the use of AI XPath extension functions in XSLT, Schematron, Schematron Quick Fixes, or for XML content refactoring.
The presentation aims to deliver a comprehensive overview of AI usage in XML development, providing attendees with the necessary knowledge to make informed decisions. Whether you’re at the early stages of adopting AI or considering integrating it in advanced XML development, this presentation will cover all levels of expertise.
By highlighting the potential advantages and challenges of integrating AI with XML development tools and languages, the presentation seeks to inspire thoughtful conversation around the future of XML development. We’ll not only delve into the technical aspects of AI-powered XML development but also discuss practical implications and possible future directions.
Your One-Stop Shop for Python Success: Top 10 US Python Development Providersakankshawande
Simplify your search for a reliable Python development partner! This list presents the top 10 trusted US providers offering comprehensive Python development services, ensuring your project's success from conception to completion.
How to Interpret Trends in the Kalyan Rajdhani Mix Chart.pdfChart Kalyan
A Mix Chart displays historical data of numbers in a graphical or tabular form. The Kalyan Rajdhani Mix Chart specifically shows the results of a sequence of numbers over different periods.
Taking AI to the Next Level in Manufacturing.pdfssuserfac0301
Read Taking AI to the Next Level in Manufacturing to gain insights on AI adoption in the manufacturing industry, such as:
1. How quickly AI is being implemented in manufacturing.
2. Which barriers stand in the way of AI adoption.
3. How data quality and governance form the backbone of AI.
4. Organizational processes and structures that may inhibit effective AI adoption.
6. Ideas and approaches to help build your organization's AI strategy.
Salesforce Integration for Bonterra Impact Management (fka Social Solutions A...Jeffrey Haguewood
Sidekick Solutions uses Bonterra Impact Management (fka Social Solutions Apricot) and automation solutions to integrate data for business workflows.
We believe integration and automation are essential to user experience and the promise of efficient work through technology. Automation is the critical ingredient to realizing that full vision. We develop integration products and services for Bonterra Case Management software to support the deployment of automations for a variety of use cases.
This video focuses on integration of Salesforce with Bonterra Impact Management.
Interested in deploying an integration with Salesforce for Bonterra Impact Management? Contact us at sales@sidekicksolutionsllc.com to discuss next steps.
Programming Foundation Models with DSPy - Meetup SlidesZilliz
Prompting language models is hard, while programming language models is easy. In this talk, I will discuss the state-of-the-art framework DSPy for programming foundation models with its powerful optimizers and runtime constraint system.
UiPath Test Automation using UiPath Test Suite series, part 6DianaGray10
Welcome to UiPath Test Automation using UiPath Test Suite series part 6. In this session, we will cover Test Automation with generative AI and Open AI.
UiPath Test Automation with generative AI and Open AI webinar offers an in-depth exploration of leveraging cutting-edge technologies for test automation within the UiPath platform. Attendees will delve into the integration of generative AI, a test automation solution, with Open AI advanced natural language processing capabilities.
Throughout the session, participants will discover how this synergy empowers testers to automate repetitive tasks, enhance testing accuracy, and expedite the software testing life cycle. Topics covered include the seamless integration process, practical use cases, and the benefits of harnessing AI-driven automation for UiPath testing initiatives. By attending this webinar, testers, and automation professionals can gain valuable insights into harnessing the power of AI to optimize their test automation workflows within the UiPath ecosystem, ultimately driving efficiency and quality in software development processes.
What will you get from this session?
1. Insights into integrating generative AI.
2. Understanding how this integration enhances test automation within the UiPath platform
3. Practical demonstrations
4. Exploration of real-world use cases illustrating the benefits of AI-driven test automation for UiPath
Topics covered:
What is generative AI
Test Automation with generative AI and Open AI.
UiPath integration with generative AI
Speaker:
Deepak Rai, Automation Practice Lead, Boundaryless Group and UiPath MVP
Project Management Semester Long Project - Acuityjpupo2018
Acuity is an innovative learning app designed to transform the way you engage with knowledge. Powered by AI technology, Acuity takes complex topics and distills them into concise, interactive summaries that are easy to read & understand. Whether you're exploring the depths of quantum mechanics or seeking insight into historical events, Acuity provides the key information you need without the burden of lengthy texts.
Applying data science to gain insights, improve efficiency and deliver higher value services.
What skillsets, technologies and practices are required to deliver the best value?
What you will learn
What do you do with the data?
What skillsets do you need in order to use the data?
How to map data analytics to deliver higher value services and gain efficiencies?
Retrospective analysis
Dashboarding - Real-time processing
Prediction
#8 Optimization: How do we do things better? E.g. price optimization, markdown optimization and size optimization
Big data forces you to wrestle with key strategic and operational challenges
Find new ways to leverage information sources to drive growth
improve your strategic decision making? You need to know which investments will deliver the most business value and ROI
Are there new expectations for information quality and management
Known, Known Unknowns and Unknown Unknowns (Insights)
Tom Mitchell – Professor at the Carnegie Mellon University
Automating Automata
Adjusts for large amount of data
Product Recommendation
Regressional Analysis - regression analysis helps one understand how the typical value of the dependent variable (or 'criterion variable') changes when any one of the independent variables is varied, while the other independent variables are held fixed
XGBoost is an optimized distributed gradient boosting system designed to be highly efficient, flexible and portable. It implements machine learning algorithms under the Gradient Boosting framework
http://dmlc.cs.washington.edu/xgboost.html
K-Means - k-means clustering aims to partition n observations into k clusters in which each observation belongs to the cluster with the nearest mean, serving as a prototype of the cluster. This results in a partitioning of the data space into Voronoi cells (Lloyd's algorithm, also known as Voronoi iteration )
https://www.data.gov/impact/
U.S. Postal Service was one of the early pioneers in implementing machine learning at a large scale – Reading postal addresses
Fishing services
Population Health Management
Agriculture
Crime mapping
Education