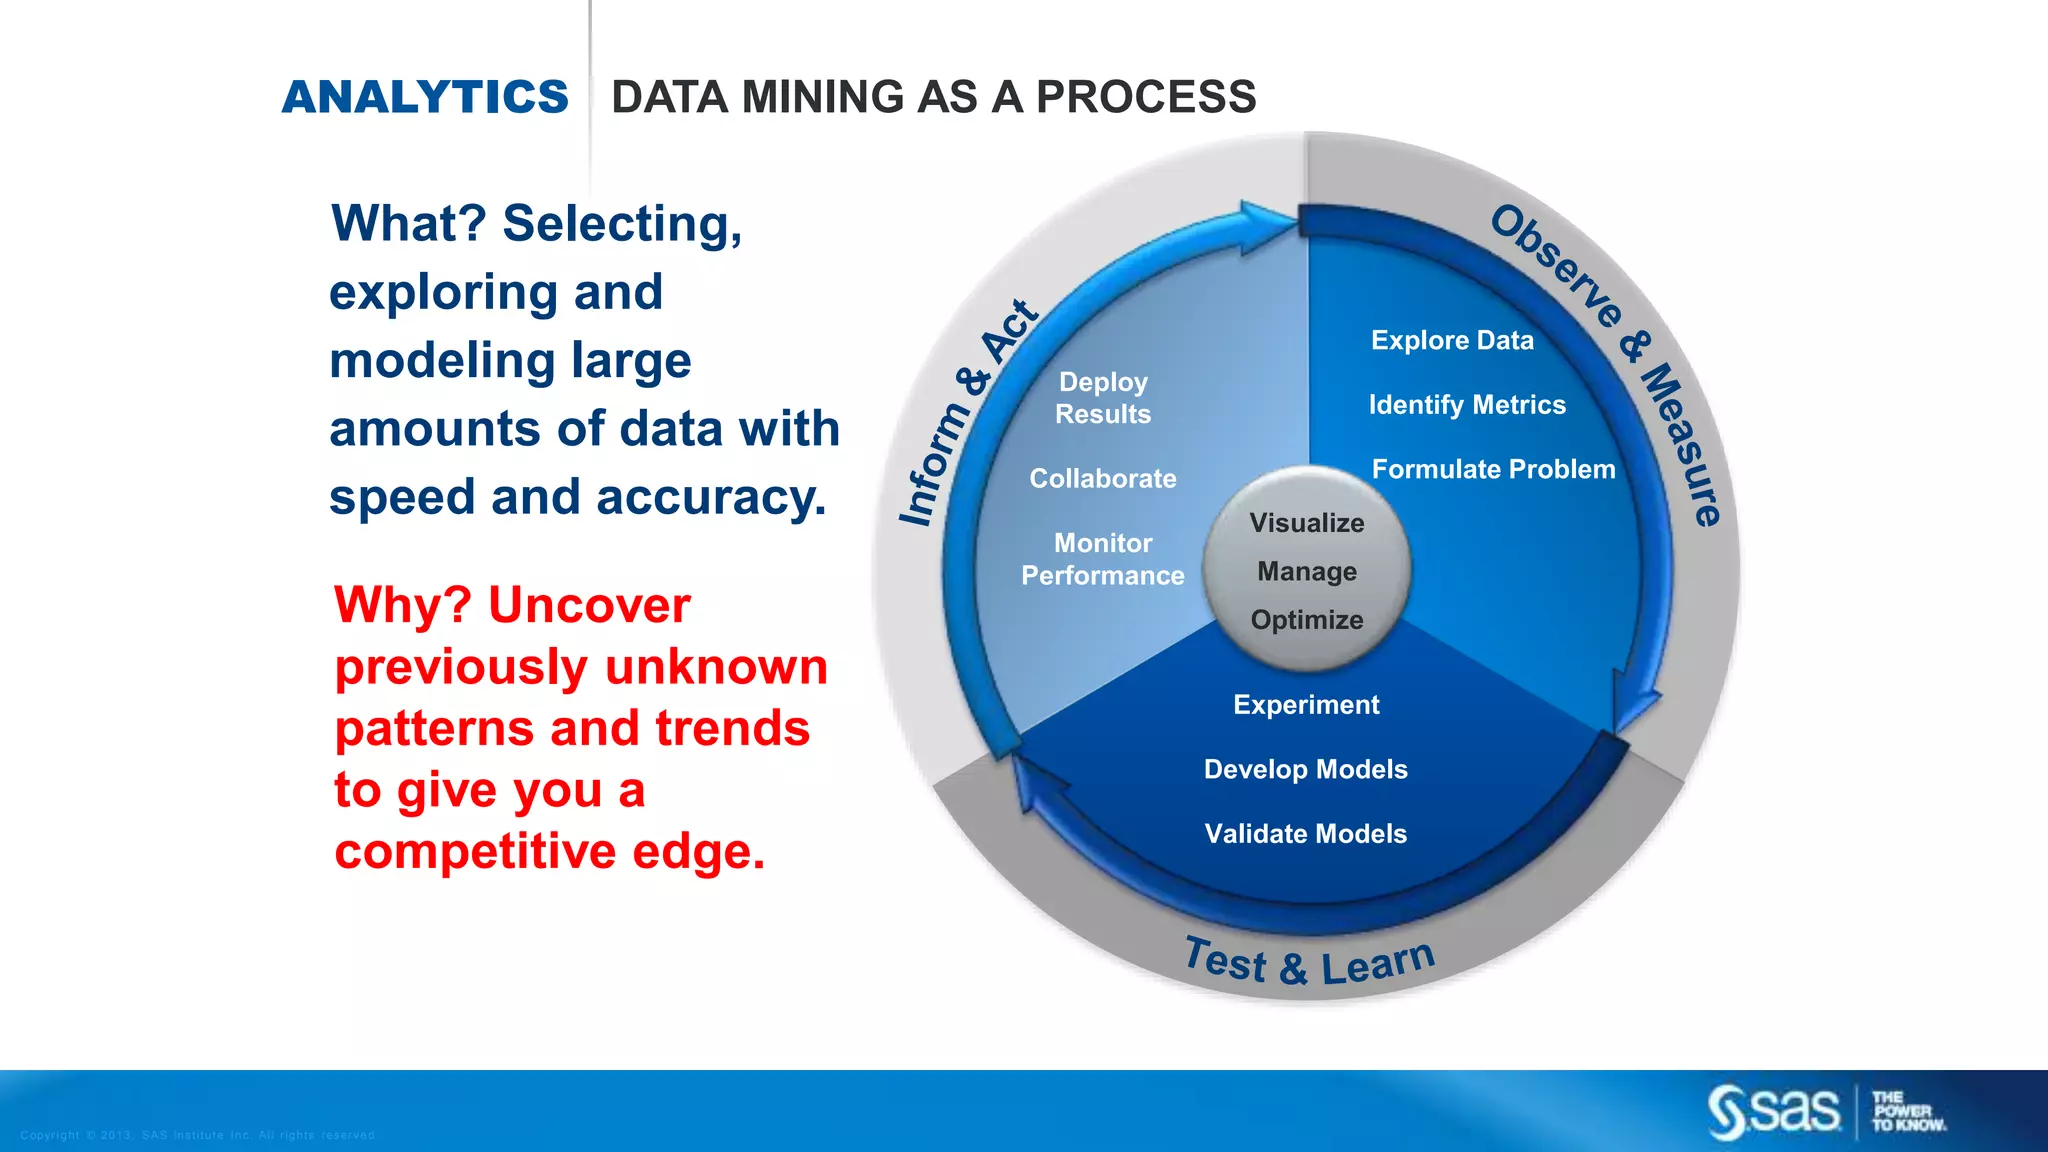
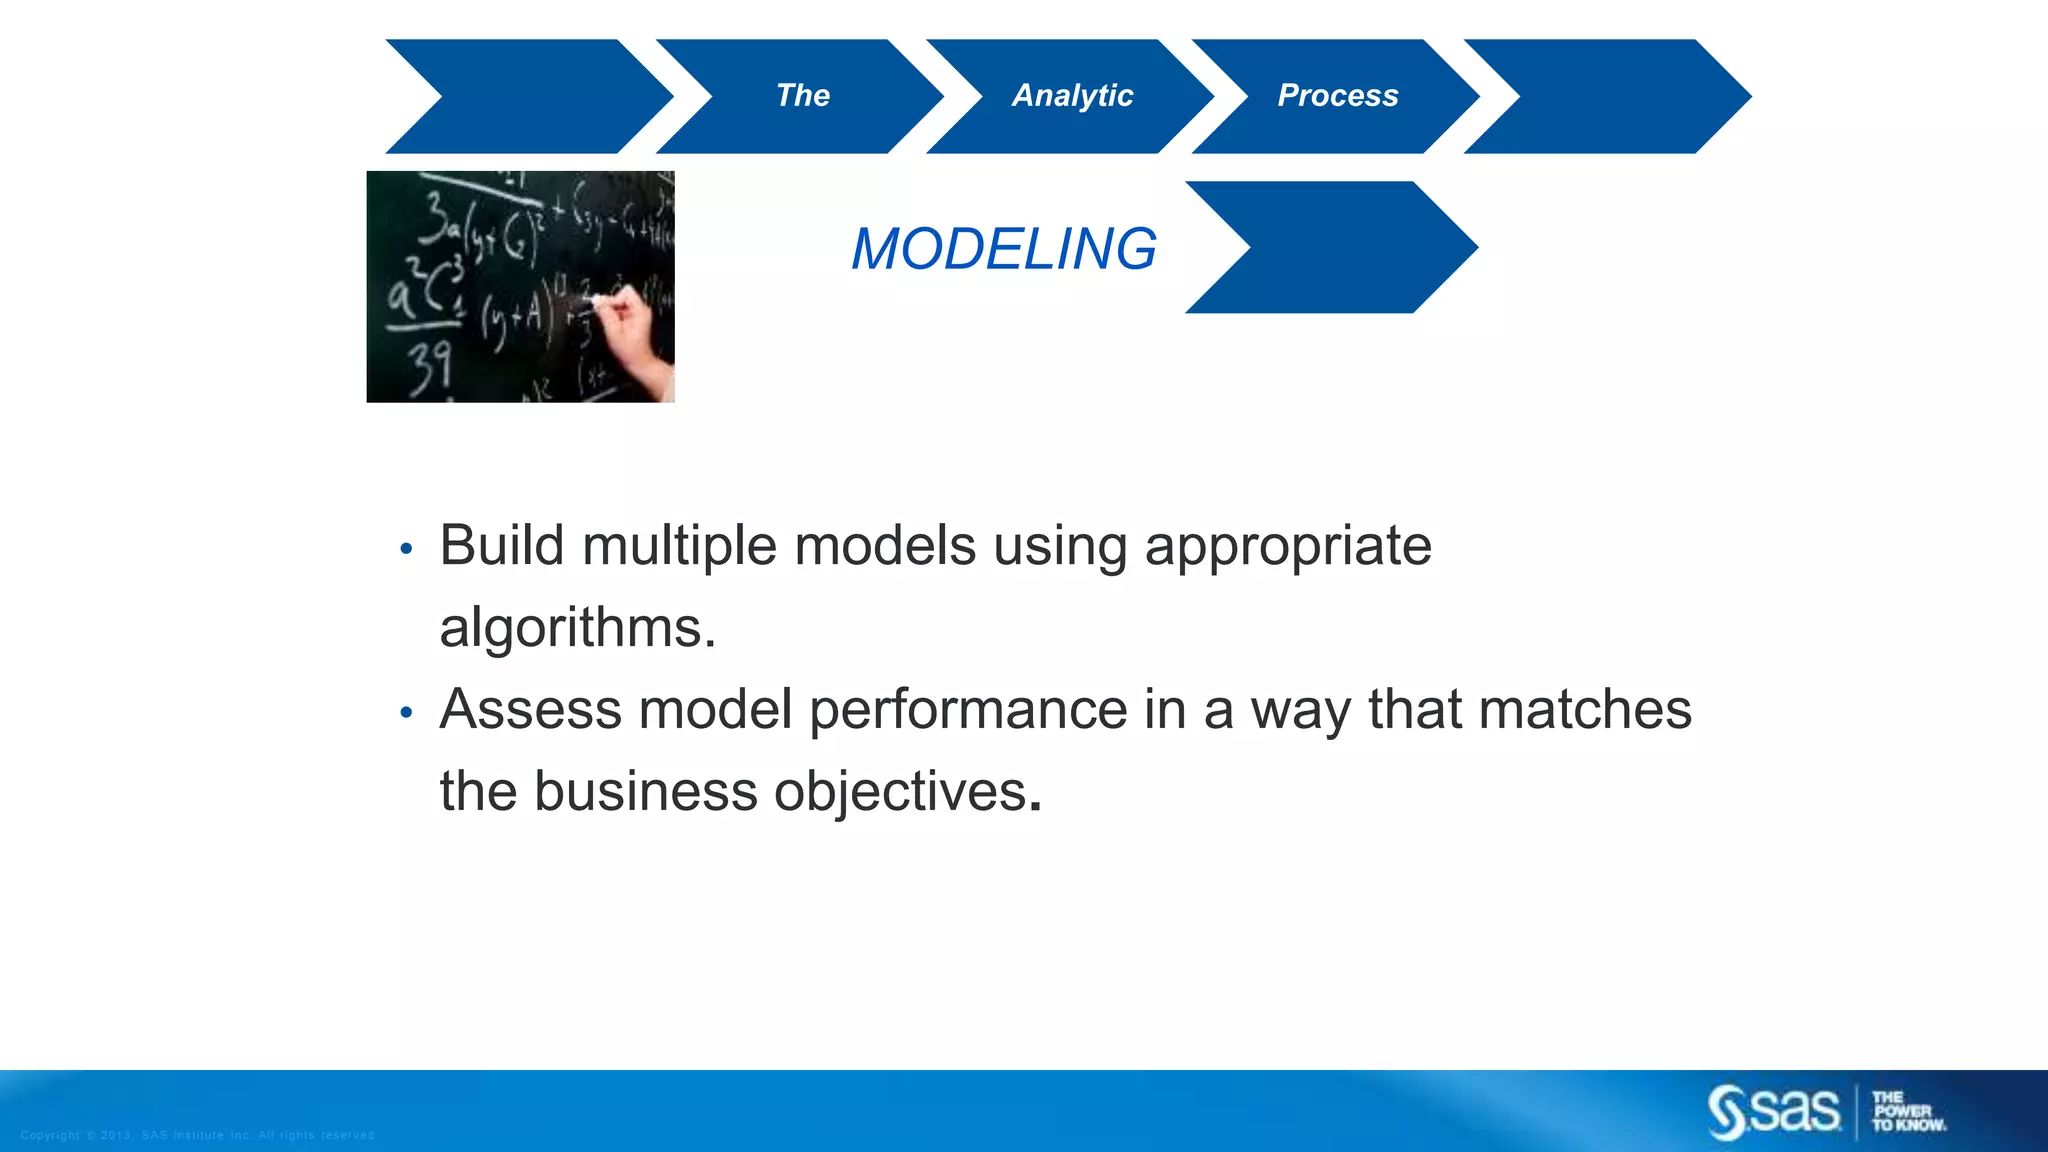
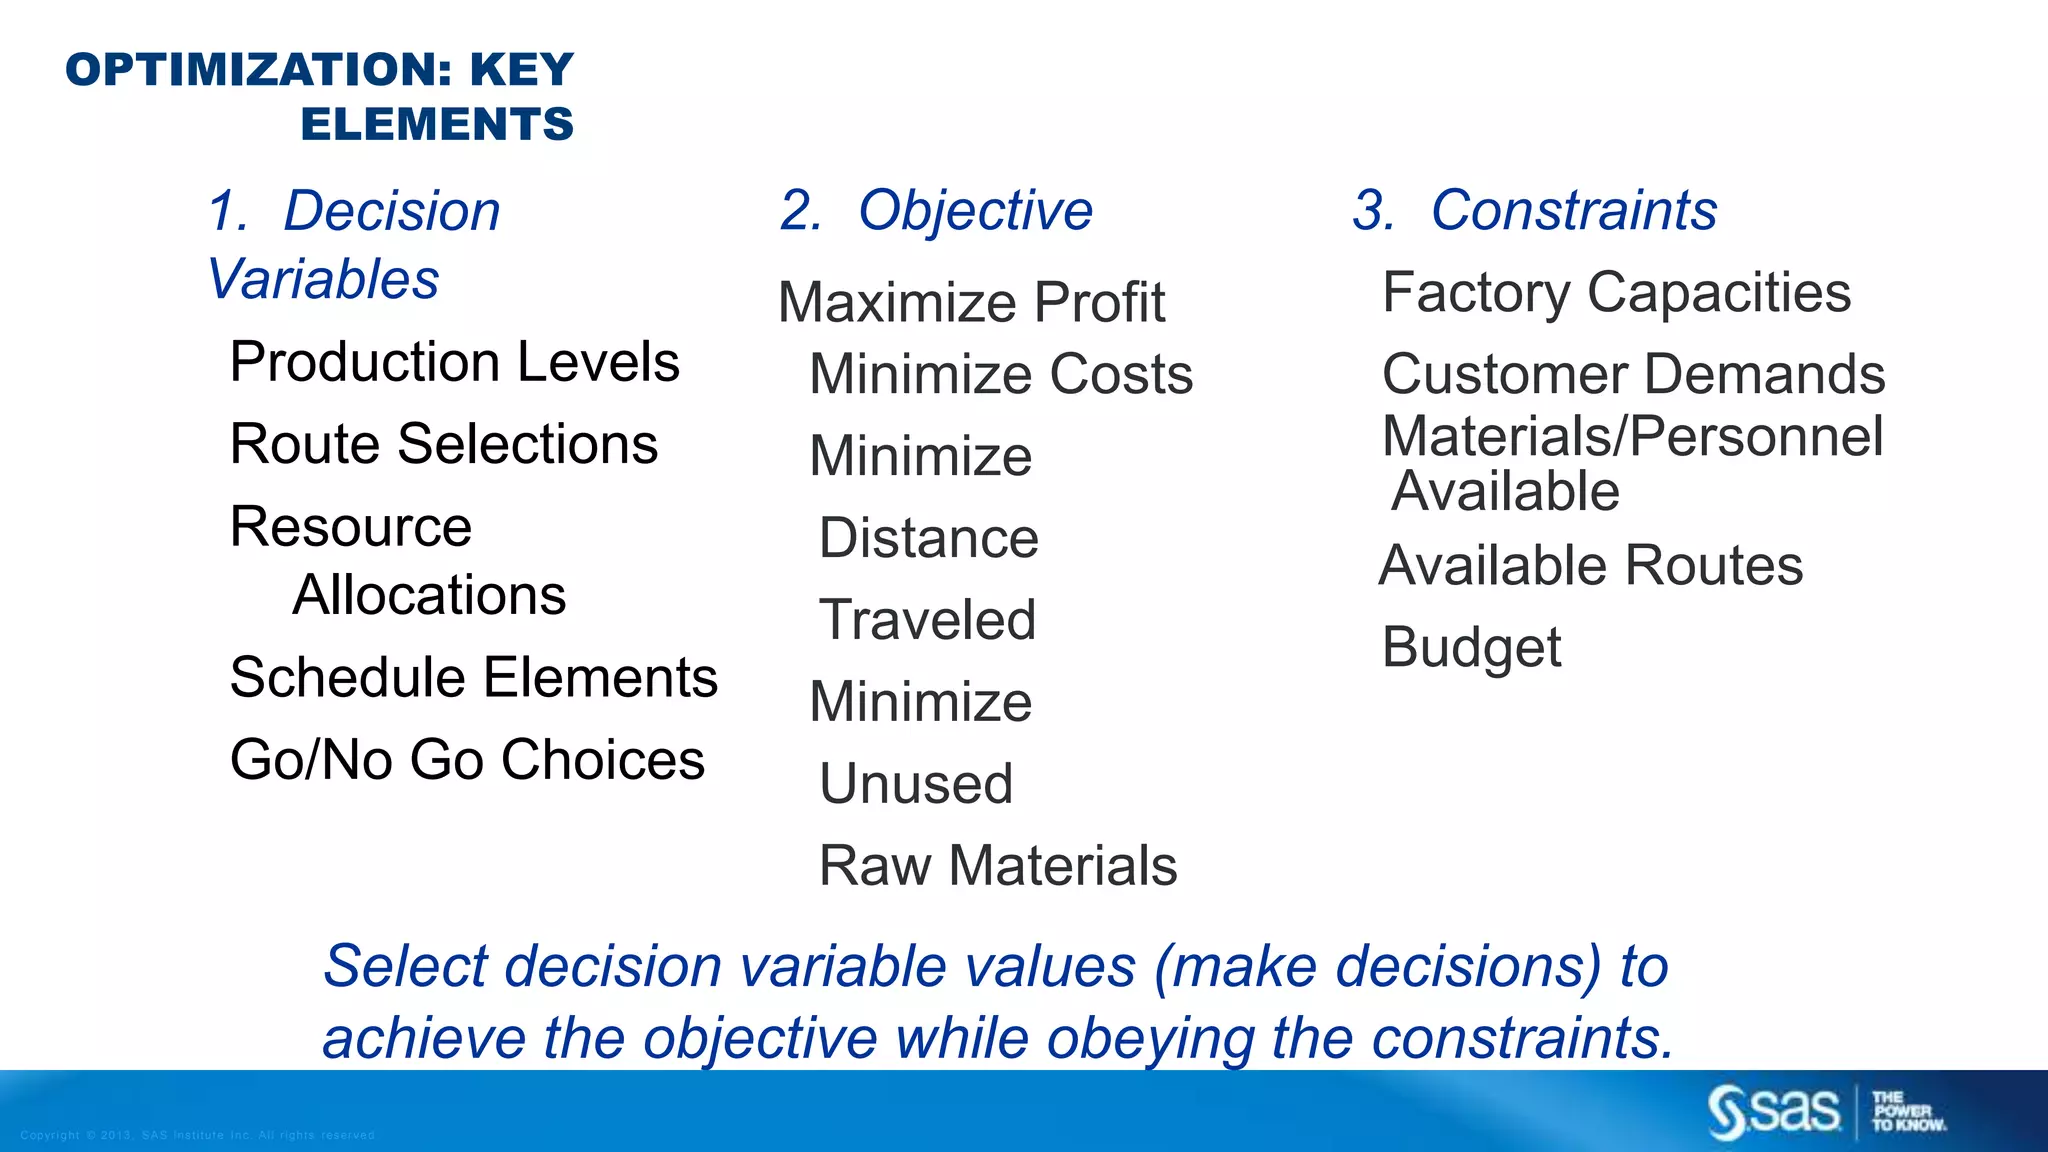
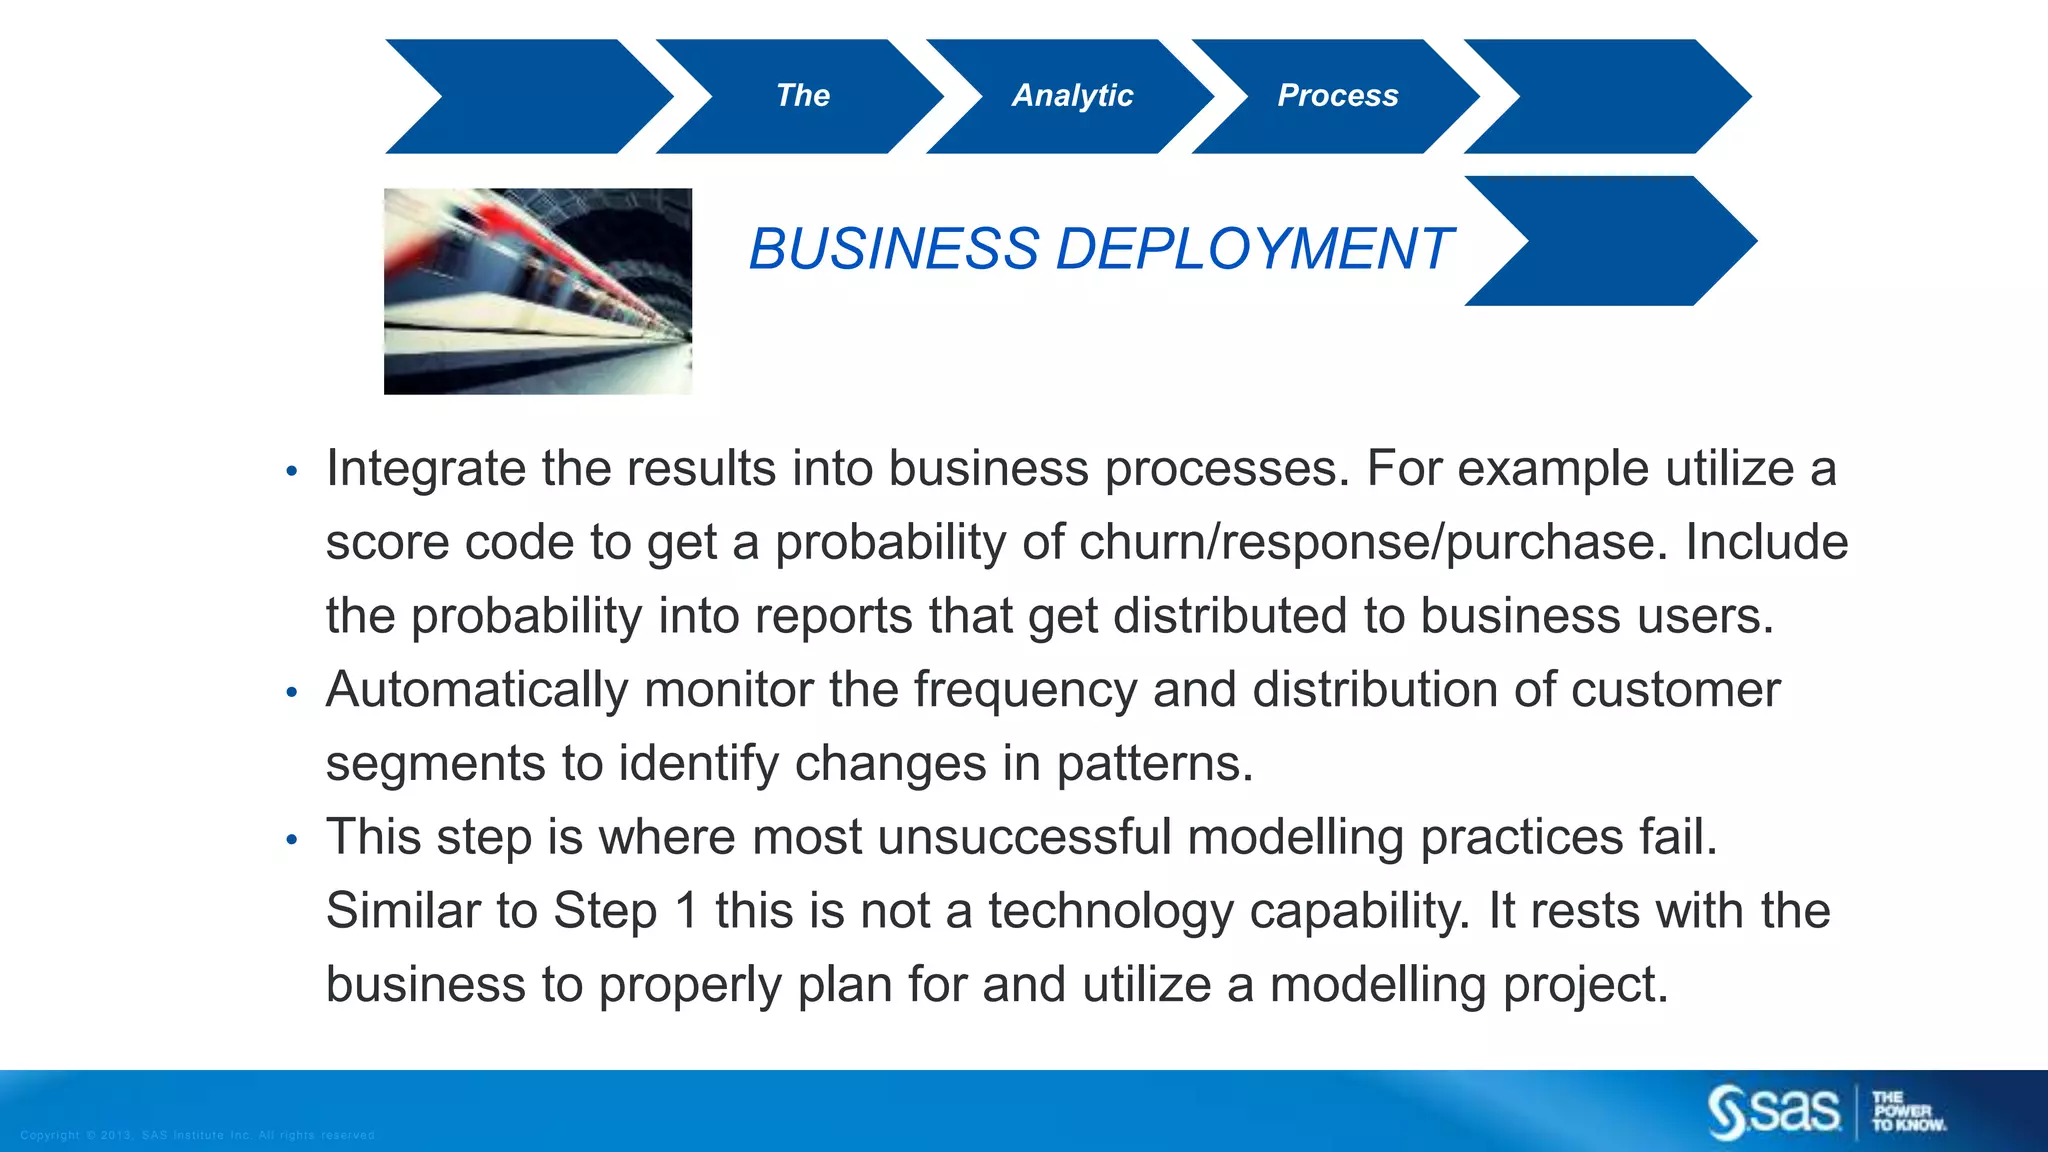
Copyr ight © 2013, SAS Institute Inc. All rights reser ved.
SAS ANALYTIC VALUE
Copyr ight © 2013, SAS Institute Inc. All rights reser ved.
SAS ANALYTIC AREAS
Copyr ight © 2013, SAS Institute Inc. All rights reser ved.
ANALYTICS LIFECYCLE OF ANALYTICS
IntelligenceIntelligence
BusinessValueBusinessValue
Industry ExpertiseIndustry Expertise
OptimizationOptimization
Predictive ModelingPredictive Modeling
ForecastingForecasting
Reporting / OLAPReporting / OLAP
Data ManagementData Management
Data AccessData Access
Beyond BI™
What’s the best that can happen?
How much and where?
What will happen next?
What happened?
How many, how often?
Copyr ight © 2013, SAS Institute Inc. All rights reser ved.
ANALYTICS
WHAT’S THE FIRST THING YOU WOULD DO WHEN
PRESENTED WITH DATA?
Copyr ight © 2013, SAS Institute Inc. All rights reser ved.
DETERMINE BUSINESS OBJECTIVE
• Overall: What are we trying to accomplish?
• Data: What data is required and what is available?
• Modelling: What models can be built?
• Scoring: How will models be evaluated?
• Deployment: How will results be communicated
back to the business?
The Analytic Process
Copyr ight © 2013, SAS Institute Inc. All rights reser ved.
ANALYTICS NOW ON TO THE DATA
Target Variable(s) – What do you wish to measure or predict (i.e. Sales,
Revenue) and what format does it take (numeric, binary etc.)
ID Variable(s) – What unique identifiers are in your data the help you to identify
distinct observations (i.e. Transaction #s, Test #s, client ID #s, Visit #s, etc.)
Explanatory Variables – What variables do you have that might impact your target
(i.e. customer demographic, timeframes, ratings, prior ratings/spend etc.)
Classification Variables – What information do you have that would help in
splitting out the data into distinct groups – could be segment specific data that
can be used to build hierarchies that you can drill down into (i.e. Country
ProvinceCity)
Copyr ight © 2013, SAS Institute Inc. All rights reser ved.
DATA UNDERSTANDING
• Describe the Data: Create summary statistics and
correlations.
• Explore the Data: Make discoveries about data patterns.
• Verify Data Quality: Assess missing, un-standardized and
data with large numbers of categories.
The Analytic Process
Copyr ight © 2013, SAS Institute Inc. All rights reser ved.
DATA
PREPARATION
• Clean Data: What steps are required to clean up missing
values and transform information.
• Construct Data: Modify and compute new columns for
better modelling.
Data Mining Process
Copyr ight © 2013, SAS Institute Inc. All rights reser ved.
ANALYTICS STATISTICS
Statistics that are used to:
 describe sample characteristics are called descriptive statistics
 draw conclusions about the population are called inferential
statistics.
Copyr ight © 2013, SAS Institute Inc. All rights reser ved.
ANALYTICS DATA MINING AS A PROCESS
What? Selecting,
exploring and
modeling large
amounts of data with
speed and accuracy.
Why? Uncover
previously unknown
patterns and trends
to give you a
competitive edge.
Visualize
Manage
Optimize
Deploy
Results
Collaborate
Monitor
Performance
Explore Data
Identify Metrics
Formulate Problem
Experiment
Develop Models
Validate Models
Copyr ight © 2013, SAS Institute Inc. All rights reser ved.
DATA MINING TWO PASSAGES
Predictive
 Predict or estimate an outcome Describe patterns in data
Descriptive
Copyr ight © 2013, SAS Institute Inc. All rights reser ved.
ANALYTICAL
TECHNIQUES
 BUSINESS PROBLEM
 Segmentation
 Predictive Modeling
 Text Mining
 Association Analysis
Copyr ight © 2013, SAS Institute Inc. All rights reser ved.
MODELING
• Build multiple models using appropriate
algorithms.
• Assess model performance in a way that matches
the business objectives.
The Analytic Process
Copyr ight © 2013, SAS Institute Inc. All rights reser ved.
FORECASTING IS UBIQUITOUS
Copyr ight © 2013, SAS Institute Inc. All rights reser ved.
WHAT IS A TIME
SERIES?
•Anything measured over time…
 Weekly sales
 Daily interest rates
 Annual income
 Hourly call center volume
Copyr ight © 2013, SAS Institute Inc. All rights reser ved.
ANALYTICS TIME SERIES FORECASTING
• Before commencing any time series
forecasting task it is important to get a better
understanding of the data at hand
• This will help you answer questions such as
• What is the degree of seasonality?
• Is there an underlying trend?
• Is there a hierarchy in my data I should use?
• Would it make more sense to try and segment
my data and model each segment separately?
• Are there time series which are not suitable for
time series modeling?
• Are there indications that my forecast is
influenced by external factors?
Copyr ight © 2013, SAS Institute Inc. All rights reser ved.
TEXT ANALYTICS WHAT IS IT AND WHY NOW?
 Using statistical methods to analyze and
interpret the meaning of textual data.
 Automated solutions went mainstream in
early 2000’s. Unstructured data now
accounts for 80% of all data being created.
 Social Media has kicked off a race to
capture the broad and vast content now
being exposed by the web.
 Text Analytics is useful when it is part of a
complete data mining process.
Copyr ight © 2013, SAS Institute Inc. All rights reser ved.
WHAT IS TEXT
MINING?
•The process of discovering and extracting
•meaningful patterns and relationships from text collections
 Uncovering underlying themes or concepts in large document
collections
 Uses descriptive modeling to discover themes and concepts in a
document collection
 Uses predictive modeling to classify documents into categories
 Converts unstructured text into structured data objects (converts
text to numbers!)
 Combining free-form text and quantitative variables to derive
information
Knowledge
Copyr ight © 2013, SAS Institute Inc. All rights reser ved.
ANALYTICS MORE TEXT
Content Categorization works from the top down and
categorizes documents based on what you do know – on
categories that you have previously set up. The two
technologies augment each other leading to better
categorization and of text documents.
Sentiment Analysis collects text inputs from Web sites and
internal files systems, converts different text formats, and
automatically assesses the positive, negative and neutral
opinions contained within electronic unstructured data.
Copyr ight © 2013, SAS Institute Inc. All rights reser ved.
OPTIMIZATION:
DEFINITION
• Optimization is the process of choosing the actions that result in the best
outcome
• Optimization is a technology for calculating the best possible utilization of
resources needed to achieve a desired result
Copyr ight © 2013, SAS Institute Inc. All rights reser ved.
OPTIMIZATION: KEY
ELEMENTS
2. Objective
Maximize Profit
Minimize Costs
Minimize
Distance
Traveled
Minimize
Unused
Raw Materials
3. Constraints
Factory Capacities
Customer Demands
Materials/Personnel
Available
Available Routes
Budget
Select decision variable values (make decisions) to
achieve the objective while obeying the constraints.
1. Decision
Variables
Production Levels
Route Selections
Resource
Allocations
Schedule Elements
Go/No Go Choices
Copyr ight © 2013, SAS Institute Inc. All rights reser ved.
BUSINESS DEPLOYMENT
• Integrate the results into business processes. For example utilize a
score code to get a probability of churn/response/purchase. Include
the probability into reports that get distributed to business users.
• Automatically monitor the frequency and distribution of customer
segments to identify changes in patterns.
• This step is where most unsuccessful modelling practices fail.
Similar to Step 1 this is not a technology capability. It rests with the
business to properly plan for and utilize a modelling project.
The Analytic Process
Copyr ight © 2012, SAS Institute Inc. All rights reser ved. www.SAS.com
DISCUSSION

What is the Value of SAS Analytics?

  • 1.
    Copyr ight ©2013, SAS Institute Inc. All rights reser ved. SAS ANALYTIC VALUE
  • 2.
    Copyr ight ©2013, SAS Institute Inc. All rights reser ved. SAS ANALYTIC AREAS
  • 3.
    Copyr ight ©2013, SAS Institute Inc. All rights reser ved. ANALYTICS LIFECYCLE OF ANALYTICS IntelligenceIntelligence BusinessValueBusinessValue Industry ExpertiseIndustry Expertise OptimizationOptimization Predictive ModelingPredictive Modeling ForecastingForecasting Reporting / OLAPReporting / OLAP Data ManagementData Management Data AccessData Access Beyond BI™ What’s the best that can happen? How much and where? What will happen next? What happened? How many, how often?
  • 4.
    Copyr ight ©2013, SAS Institute Inc. All rights reser ved. ANALYTICS WHAT’S THE FIRST THING YOU WOULD DO WHEN PRESENTED WITH DATA?
  • 5.
    Copyr ight ©2013, SAS Institute Inc. All rights reser ved. DETERMINE BUSINESS OBJECTIVE • Overall: What are we trying to accomplish? • Data: What data is required and what is available? • Modelling: What models can be built? • Scoring: How will models be evaluated? • Deployment: How will results be communicated back to the business? The Analytic Process
  • 6.
    Copyr ight ©2013, SAS Institute Inc. All rights reser ved. ANALYTICS NOW ON TO THE DATA Target Variable(s) – What do you wish to measure or predict (i.e. Sales, Revenue) and what format does it take (numeric, binary etc.) ID Variable(s) – What unique identifiers are in your data the help you to identify distinct observations (i.e. Transaction #s, Test #s, client ID #s, Visit #s, etc.) Explanatory Variables – What variables do you have that might impact your target (i.e. customer demographic, timeframes, ratings, prior ratings/spend etc.) Classification Variables – What information do you have that would help in splitting out the data into distinct groups – could be segment specific data that can be used to build hierarchies that you can drill down into (i.e. Country ProvinceCity)
  • 7.
    Copyr ight ©2013, SAS Institute Inc. All rights reser ved. DATA UNDERSTANDING • Describe the Data: Create summary statistics and correlations. • Explore the Data: Make discoveries about data patterns. • Verify Data Quality: Assess missing, un-standardized and data with large numbers of categories. The Analytic Process
  • 8.
    Copyr ight ©2013, SAS Institute Inc. All rights reser ved. DATA PREPARATION • Clean Data: What steps are required to clean up missing values and transform information. • Construct Data: Modify and compute new columns for better modelling. Data Mining Process
  • 9.
    Copyr ight ©2013, SAS Institute Inc. All rights reser ved. ANALYTICS STATISTICS Statistics that are used to:  describe sample characteristics are called descriptive statistics  draw conclusions about the population are called inferential statistics.
  • 10.
    Copyr ight ©2013, SAS Institute Inc. All rights reser ved. ANALYTICS DATA MINING AS A PROCESS What? Selecting, exploring and modeling large amounts of data with speed and accuracy. Why? Uncover previously unknown patterns and trends to give you a competitive edge. Visualize Manage Optimize Deploy Results Collaborate Monitor Performance Explore Data Identify Metrics Formulate Problem Experiment Develop Models Validate Models
  • 11.
    Copyr ight ©2013, SAS Institute Inc. All rights reser ved. DATA MINING TWO PASSAGES Predictive  Predict or estimate an outcome Describe patterns in data Descriptive
  • 12.
    Copyr ight ©2013, SAS Institute Inc. All rights reser ved. ANALYTICAL TECHNIQUES  BUSINESS PROBLEM  Segmentation  Predictive Modeling  Text Mining  Association Analysis
  • 13.
    Copyr ight ©2013, SAS Institute Inc. All rights reser ved. MODELING • Build multiple models using appropriate algorithms. • Assess model performance in a way that matches the business objectives. The Analytic Process
  • 14.
    Copyr ight ©2013, SAS Institute Inc. All rights reser ved. FORECASTING IS UBIQUITOUS
  • 15.
    Copyr ight ©2013, SAS Institute Inc. All rights reser ved. WHAT IS A TIME SERIES? •Anything measured over time…  Weekly sales  Daily interest rates  Annual income  Hourly call center volume
  • 16.
    Copyr ight ©2013, SAS Institute Inc. All rights reser ved. ANALYTICS TIME SERIES FORECASTING • Before commencing any time series forecasting task it is important to get a better understanding of the data at hand • This will help you answer questions such as • What is the degree of seasonality? • Is there an underlying trend? • Is there a hierarchy in my data I should use? • Would it make more sense to try and segment my data and model each segment separately? • Are there time series which are not suitable for time series modeling? • Are there indications that my forecast is influenced by external factors?
  • 17.
    Copyr ight ©2013, SAS Institute Inc. All rights reser ved. TEXT ANALYTICS WHAT IS IT AND WHY NOW?  Using statistical methods to analyze and interpret the meaning of textual data.  Automated solutions went mainstream in early 2000’s. Unstructured data now accounts for 80% of all data being created.  Social Media has kicked off a race to capture the broad and vast content now being exposed by the web.  Text Analytics is useful when it is part of a complete data mining process.
  • 18.
    Copyr ight ©2013, SAS Institute Inc. All rights reser ved. WHAT IS TEXT MINING? •The process of discovering and extracting •meaningful patterns and relationships from text collections  Uncovering underlying themes or concepts in large document collections  Uses descriptive modeling to discover themes and concepts in a document collection  Uses predictive modeling to classify documents into categories  Converts unstructured text into structured data objects (converts text to numbers!)  Combining free-form text and quantitative variables to derive information Knowledge
  • 19.
    Copyr ight ©2013, SAS Institute Inc. All rights reser ved. ANALYTICS MORE TEXT Content Categorization works from the top down and categorizes documents based on what you do know – on categories that you have previously set up. The two technologies augment each other leading to better categorization and of text documents. Sentiment Analysis collects text inputs from Web sites and internal files systems, converts different text formats, and automatically assesses the positive, negative and neutral opinions contained within electronic unstructured data.
  • 20.
    Copyr ight ©2013, SAS Institute Inc. All rights reser ved. OPTIMIZATION: DEFINITION • Optimization is the process of choosing the actions that result in the best outcome • Optimization is a technology for calculating the best possible utilization of resources needed to achieve a desired result
  • 21.
    Copyr ight ©2013, SAS Institute Inc. All rights reser ved. OPTIMIZATION: KEY ELEMENTS 2. Objective Maximize Profit Minimize Costs Minimize Distance Traveled Minimize Unused Raw Materials 3. Constraints Factory Capacities Customer Demands Materials/Personnel Available Available Routes Budget Select decision variable values (make decisions) to achieve the objective while obeying the constraints. 1. Decision Variables Production Levels Route Selections Resource Allocations Schedule Elements Go/No Go Choices
  • 22.
    Copyr ight ©2013, SAS Institute Inc. All rights reser ved. BUSINESS DEPLOYMENT • Integrate the results into business processes. For example utilize a score code to get a probability of churn/response/purchase. Include the probability into reports that get distributed to business users. • Automatically monitor the frequency and distribution of customer segments to identify changes in patterns. • This step is where most unsuccessful modelling practices fail. Similar to Step 1 this is not a technology capability. It rests with the business to properly plan for and utilize a modelling project. The Analytic Process
  • 23.
    Copyr ight ©2012, SAS Institute Inc. All rights reser ved. www.SAS.com DISCUSSION