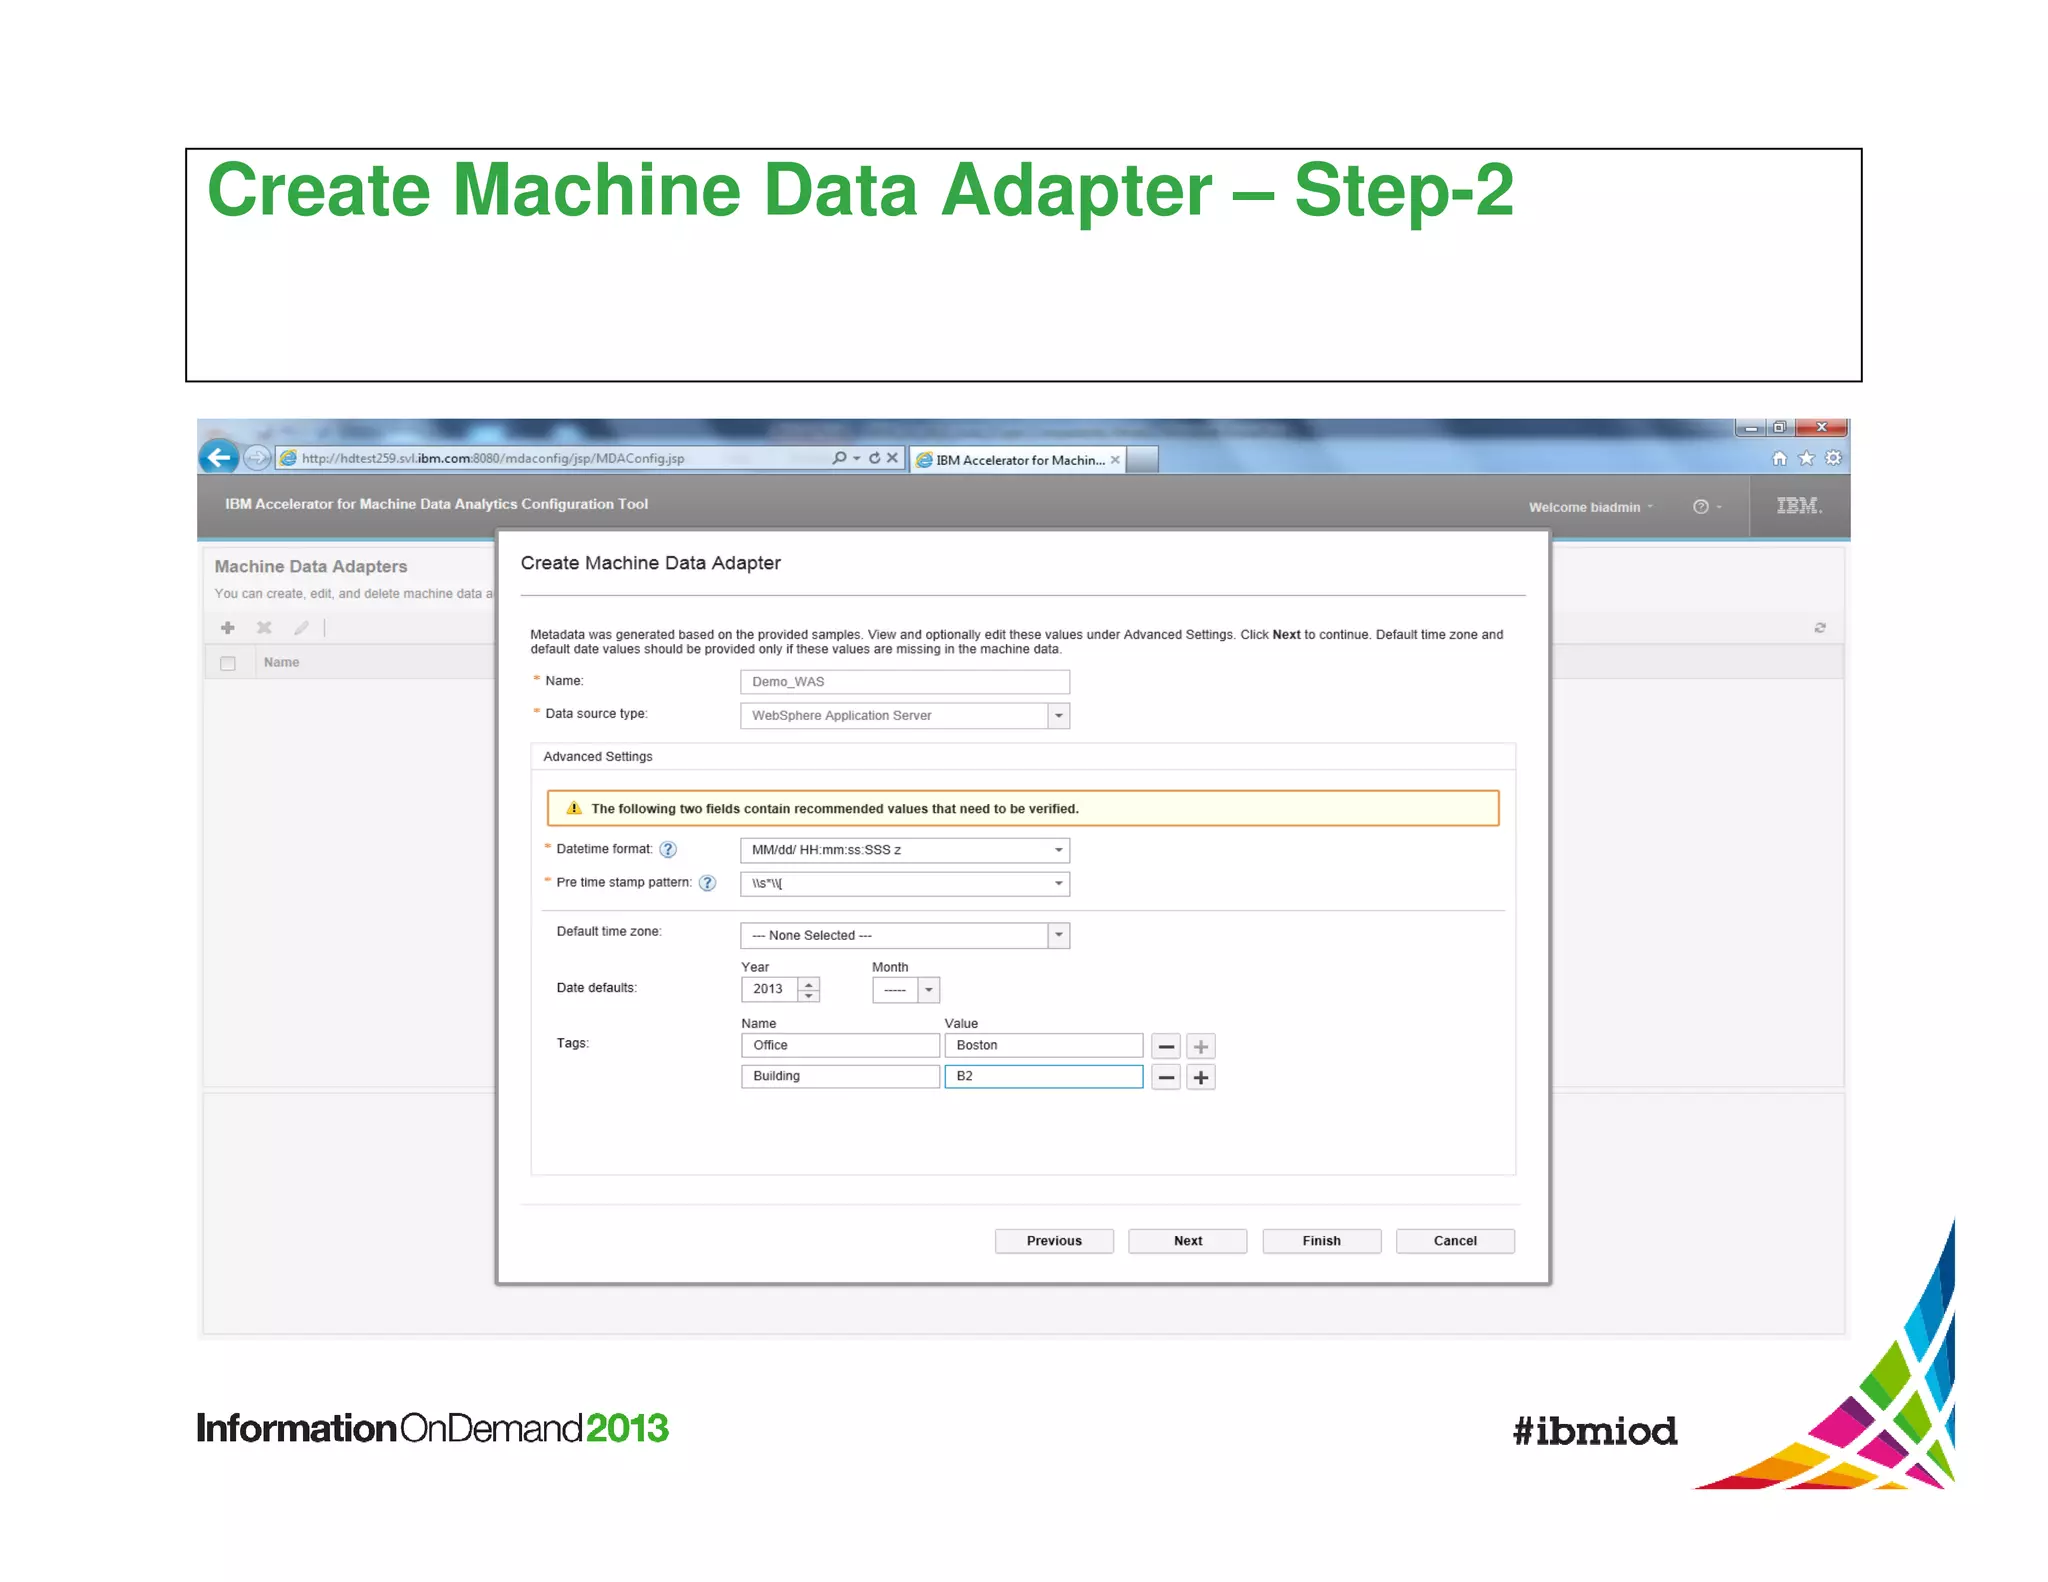
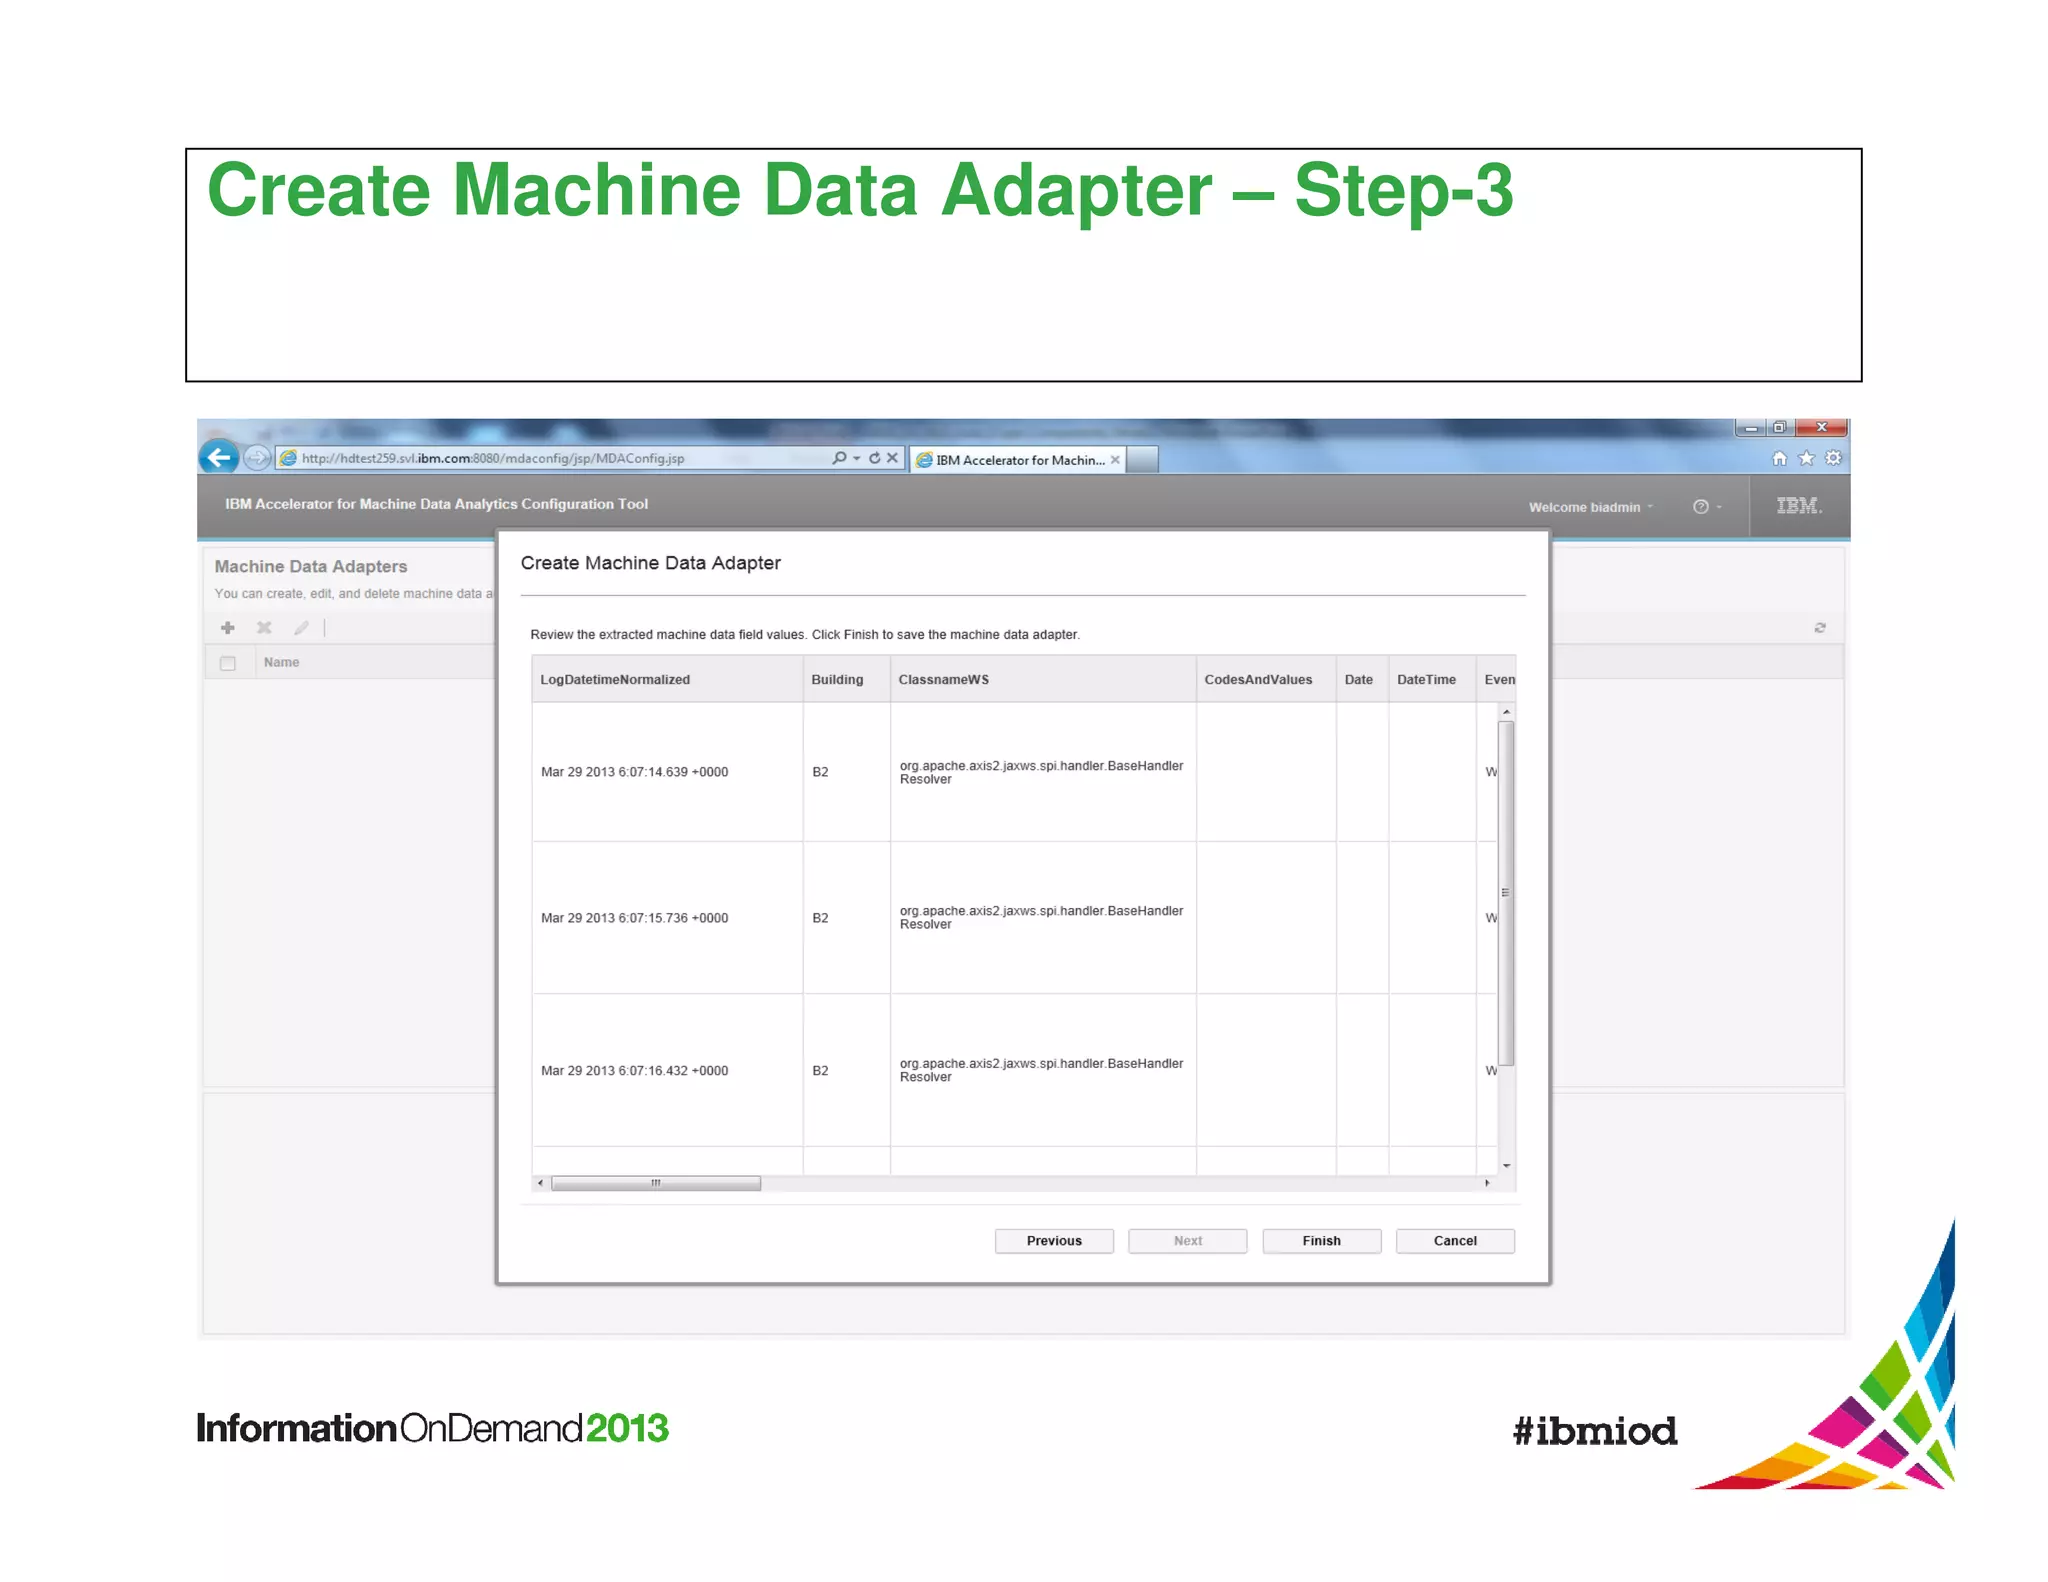
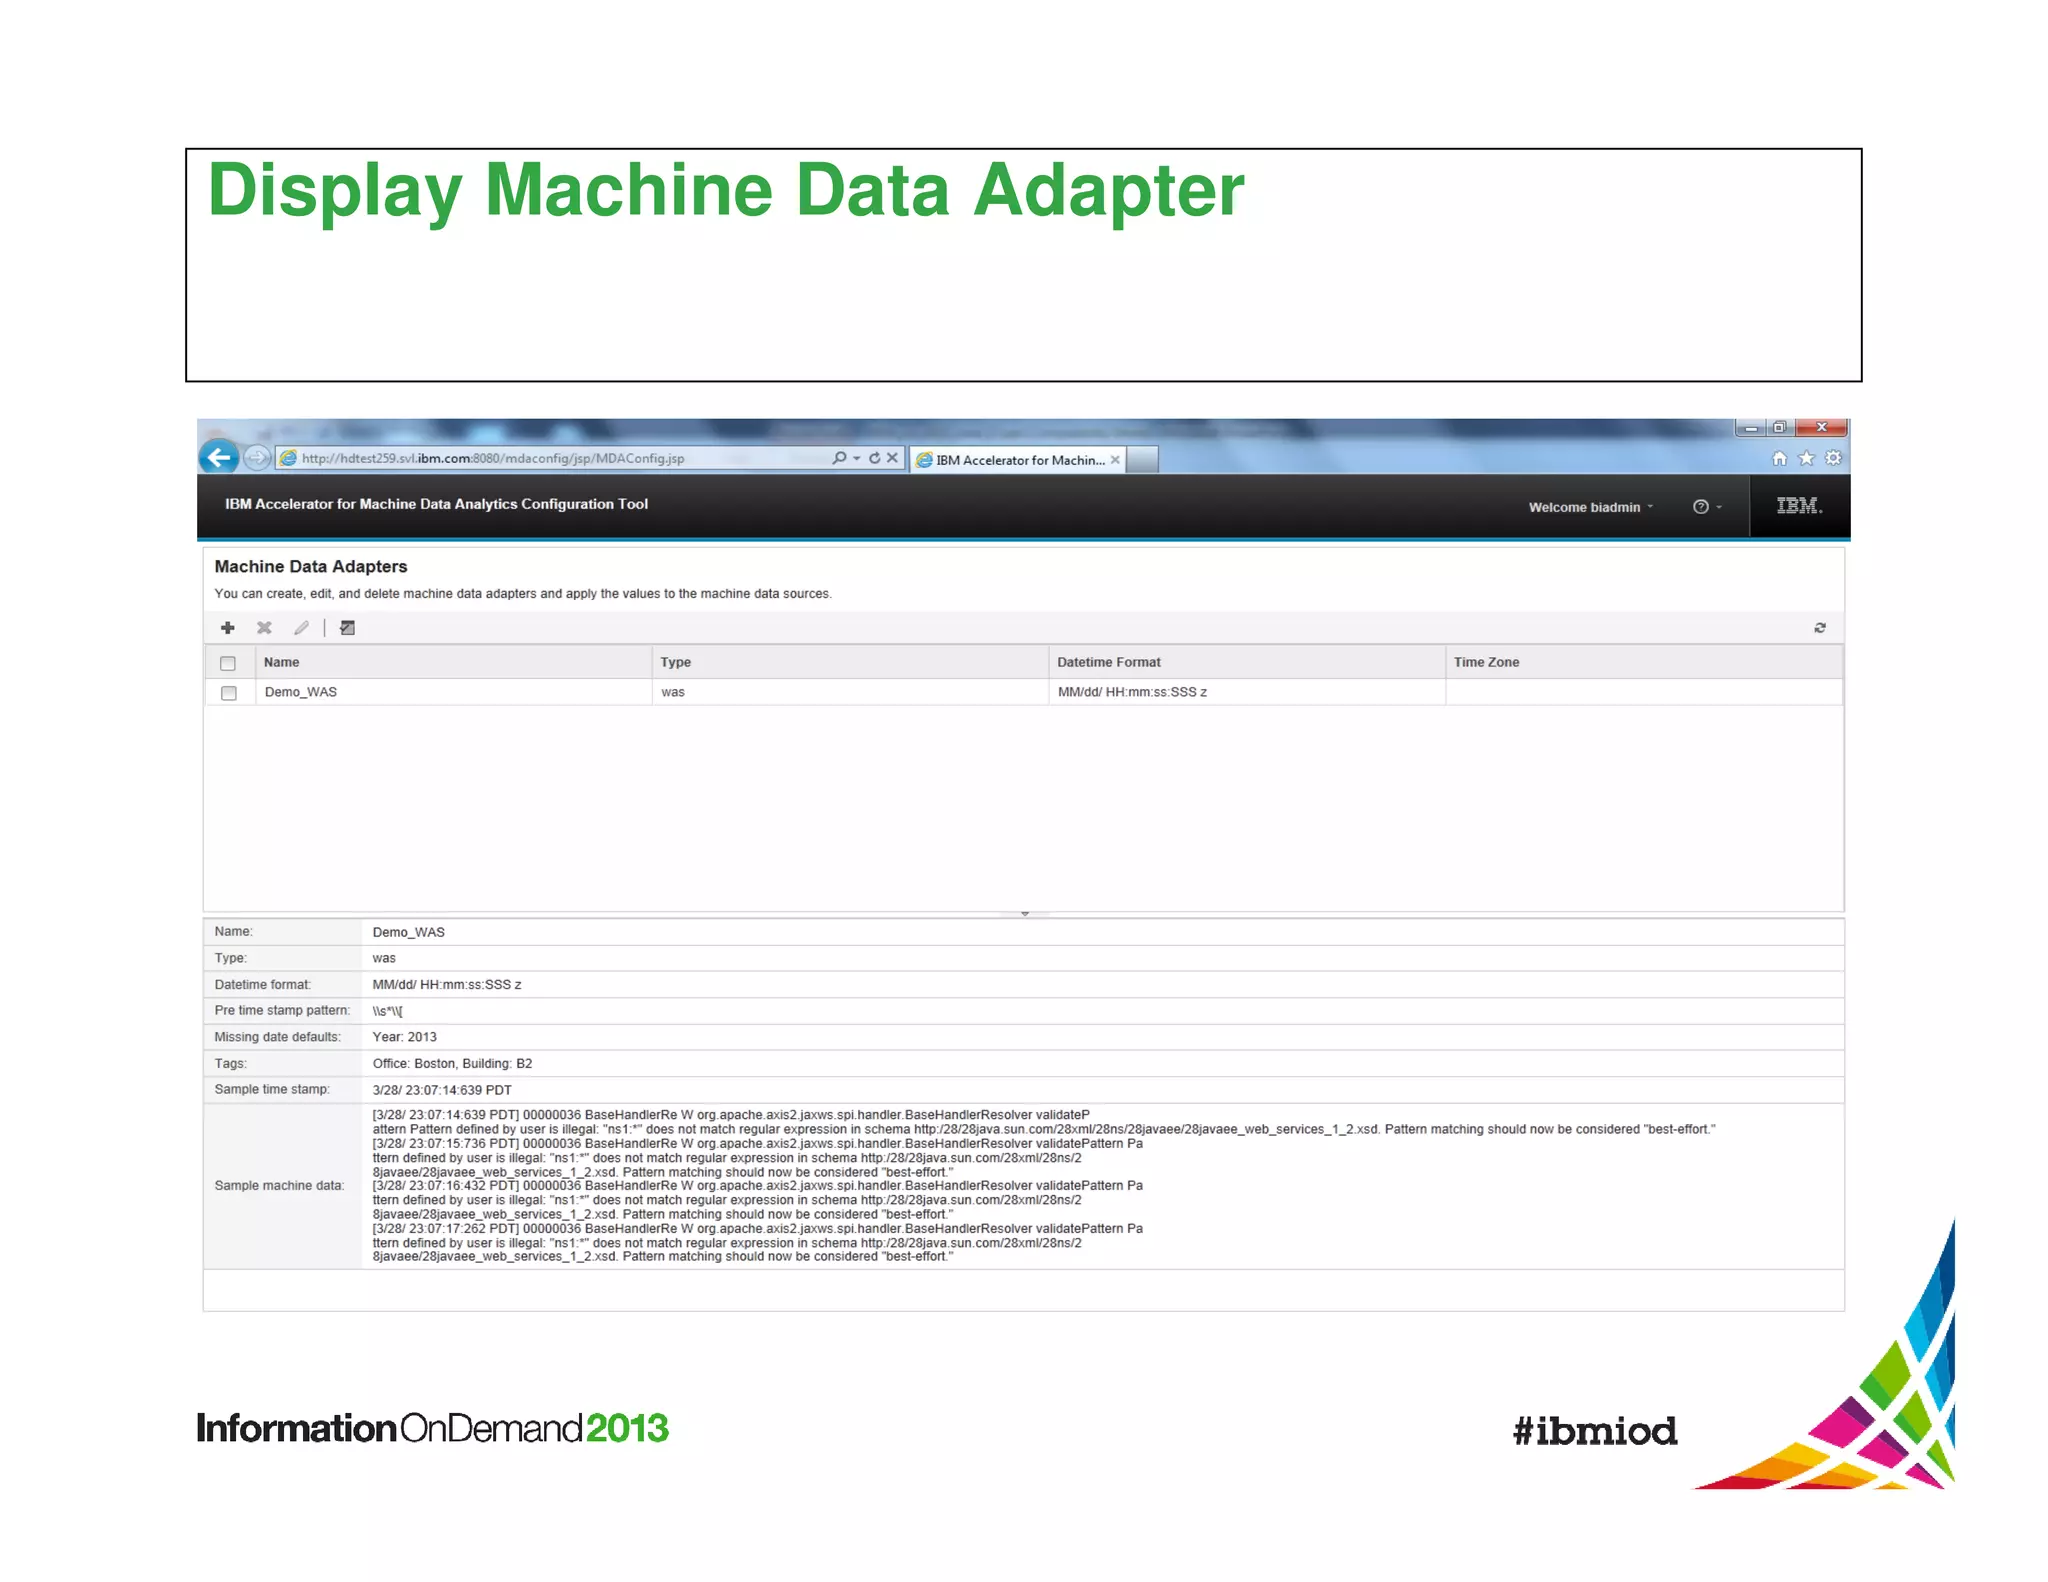
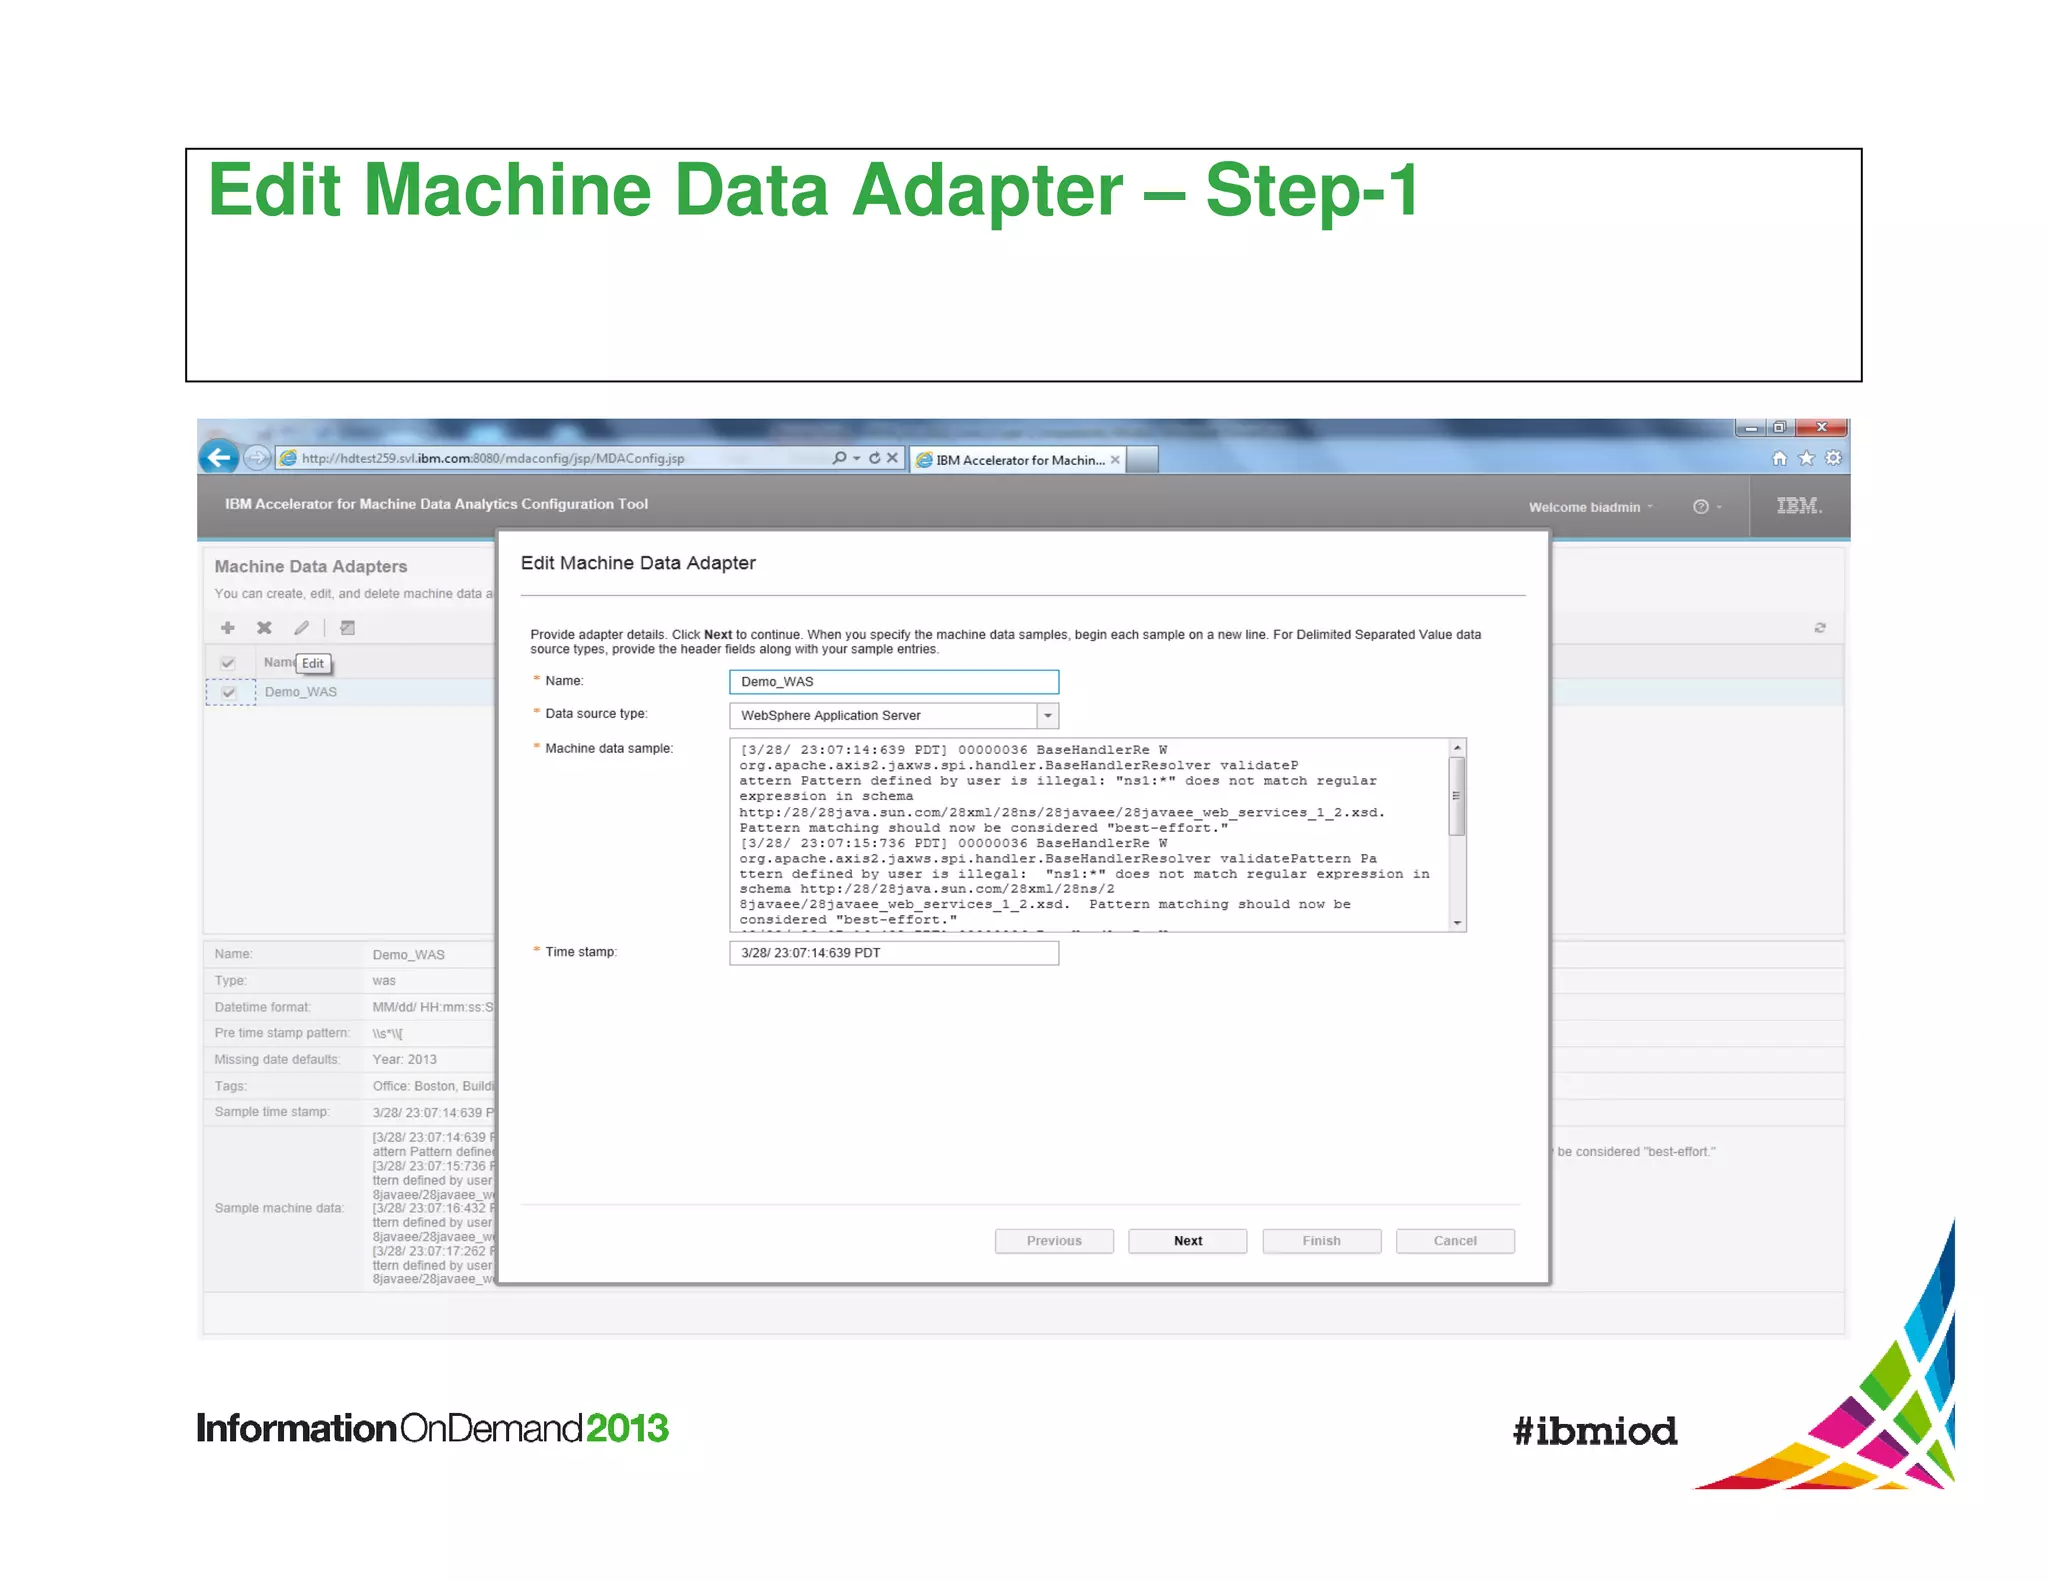
Download as PDF, PPTX
![The Extract Stage: Text analytics applied to log files
Field and
Entity
Extraction
Record
Splitting
(HDFS/GPFS)
Log
Records
(text)
Raw Log
Files
AQL
To
Transform
Stage
SemiStructured
Data
(JSON)
AQL
AQL extractors available
for many common formats
[syslog, websphere, csv,
...] BigInsights ships with
tools for creating new
extractors.](https://image.slidesharecdn.com/ibmmachinedataanalytics-140115180907-phpapp02/75/Machine-Data-Analytics-26-2048.jpg)

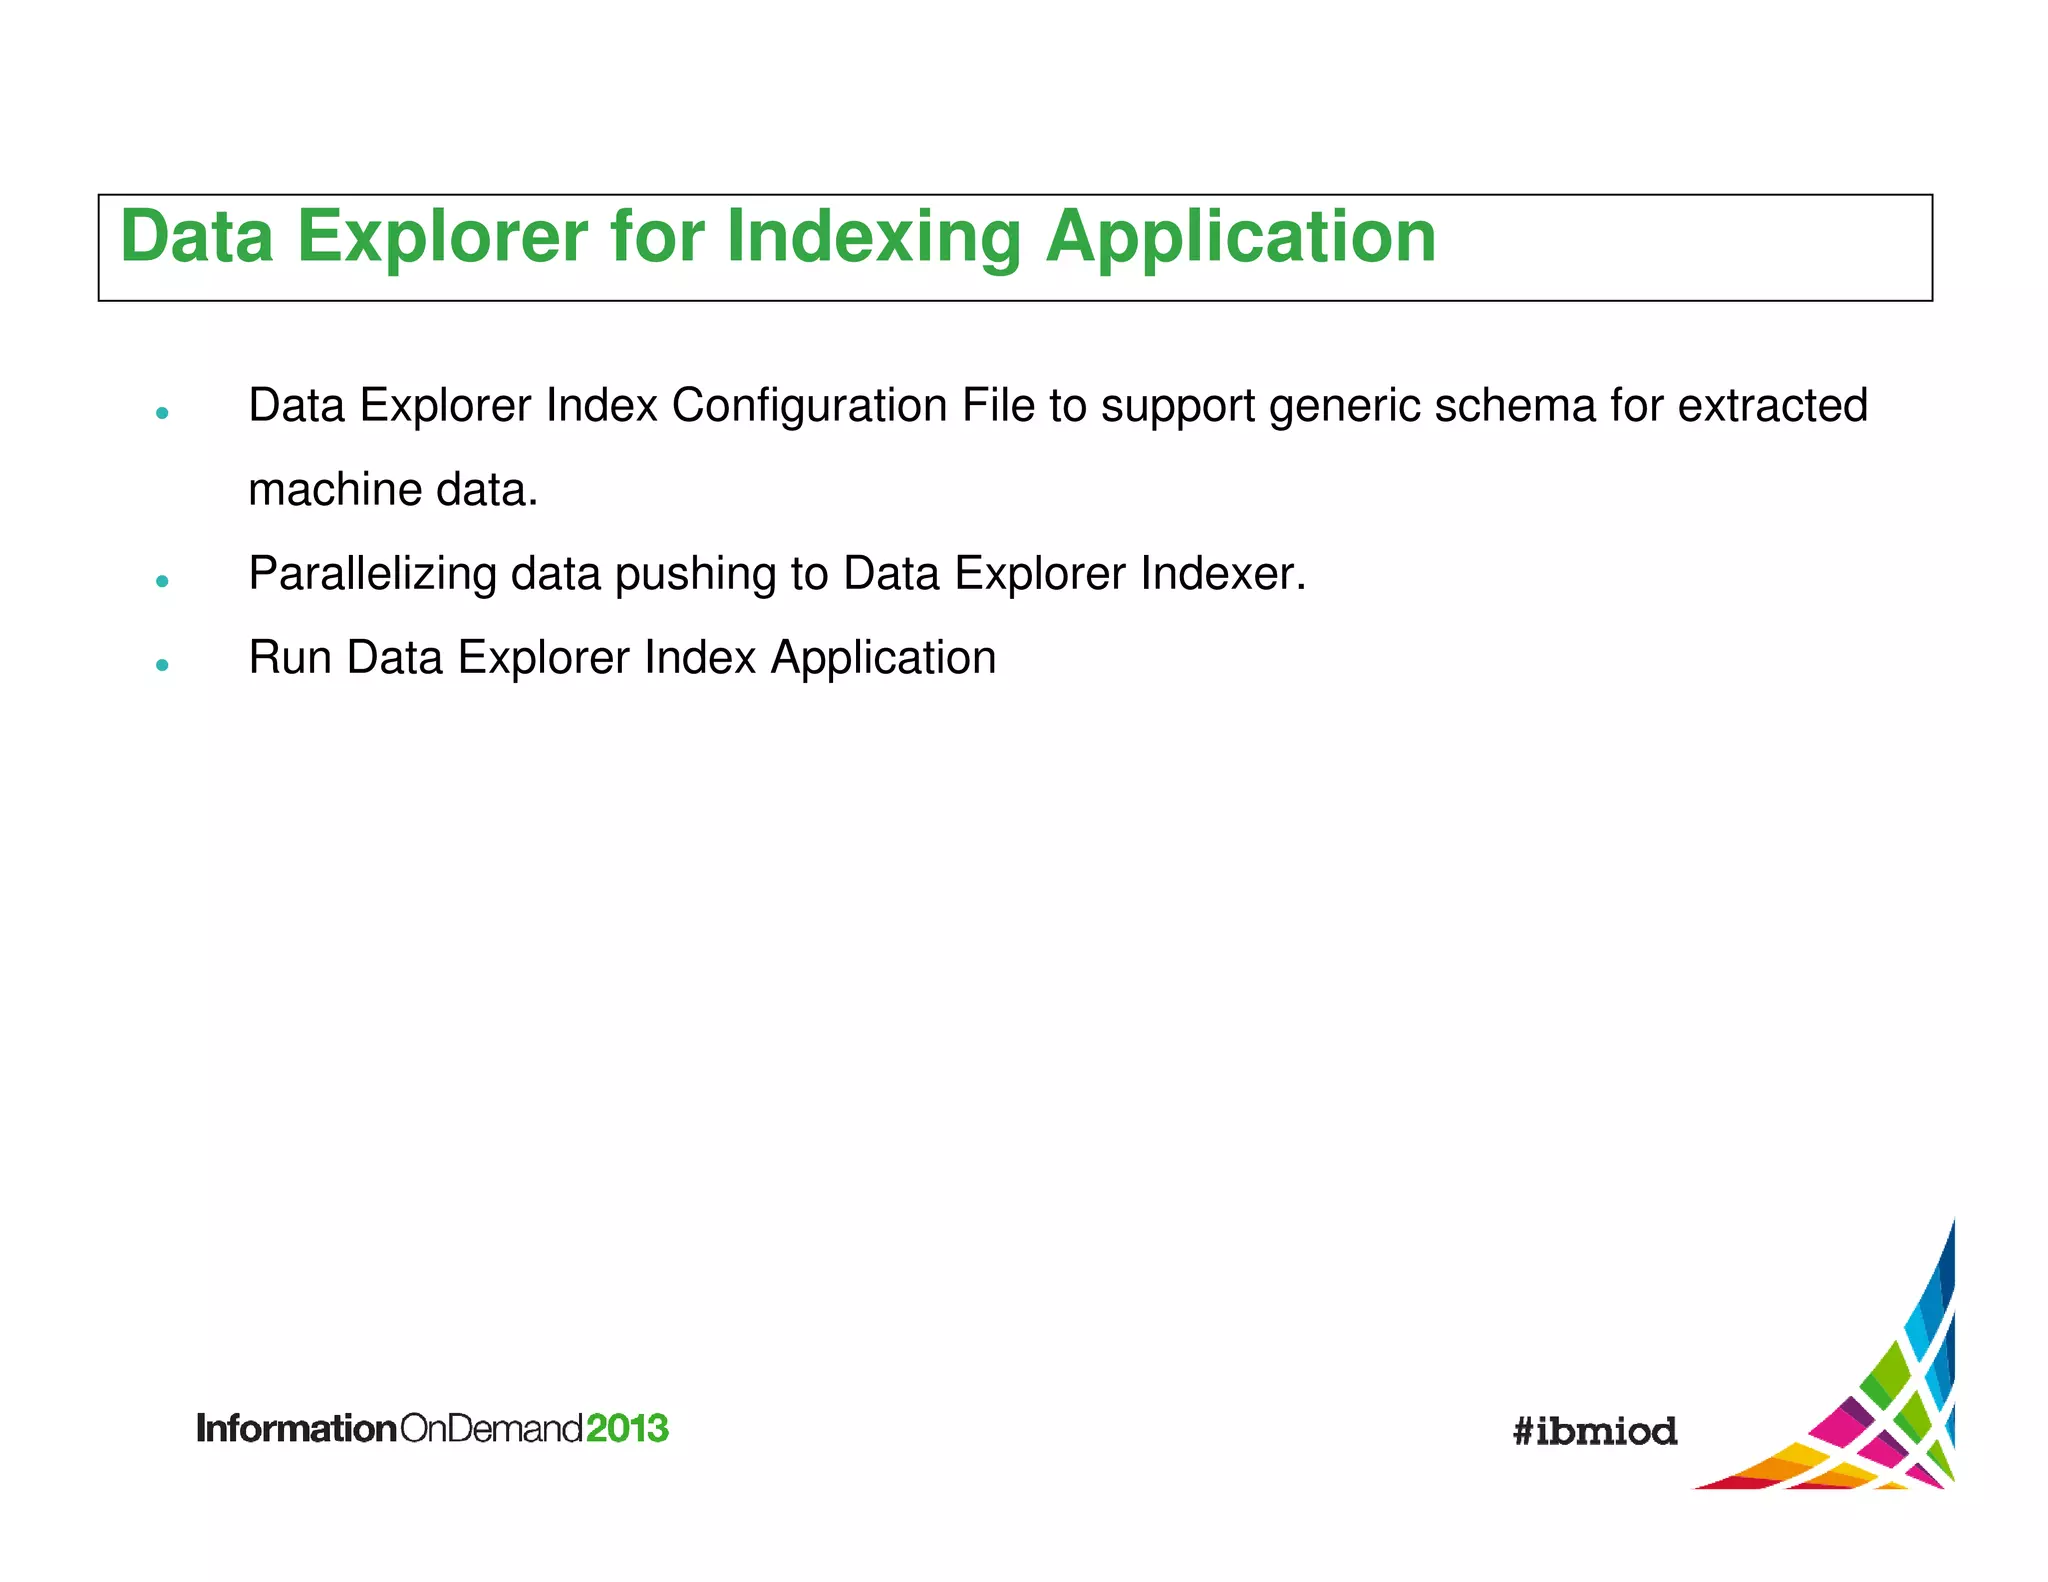
![Data Explorer Index Configuration File
The Data Explorer index config file specifies which fields to index, which field
contains record ID as well as Data Explorer index field definitions: field name,
type, searchable, retrievable, filterable and sortable.
Example:
{ "source": {
"dateFormat": "MMM dd yyyy HH:mm:ss.SSS Z",
"LogDatetime[].normalized_text",
"deFieldName": "LogDatetime",
"retrievable": true,
"fieldName":
"suppress": false }, "target": {
"filterable": true,
"searchable": true,
"isRecordID": false,
"sortable": true,
Default Index Configuration file is provided.
"type": "Date" }}](https://image.slidesharecdn.com/ibmmachinedataanalytics-140115180907-phpapp02/75/Machine-Data-Analytics-47-2048.jpg)

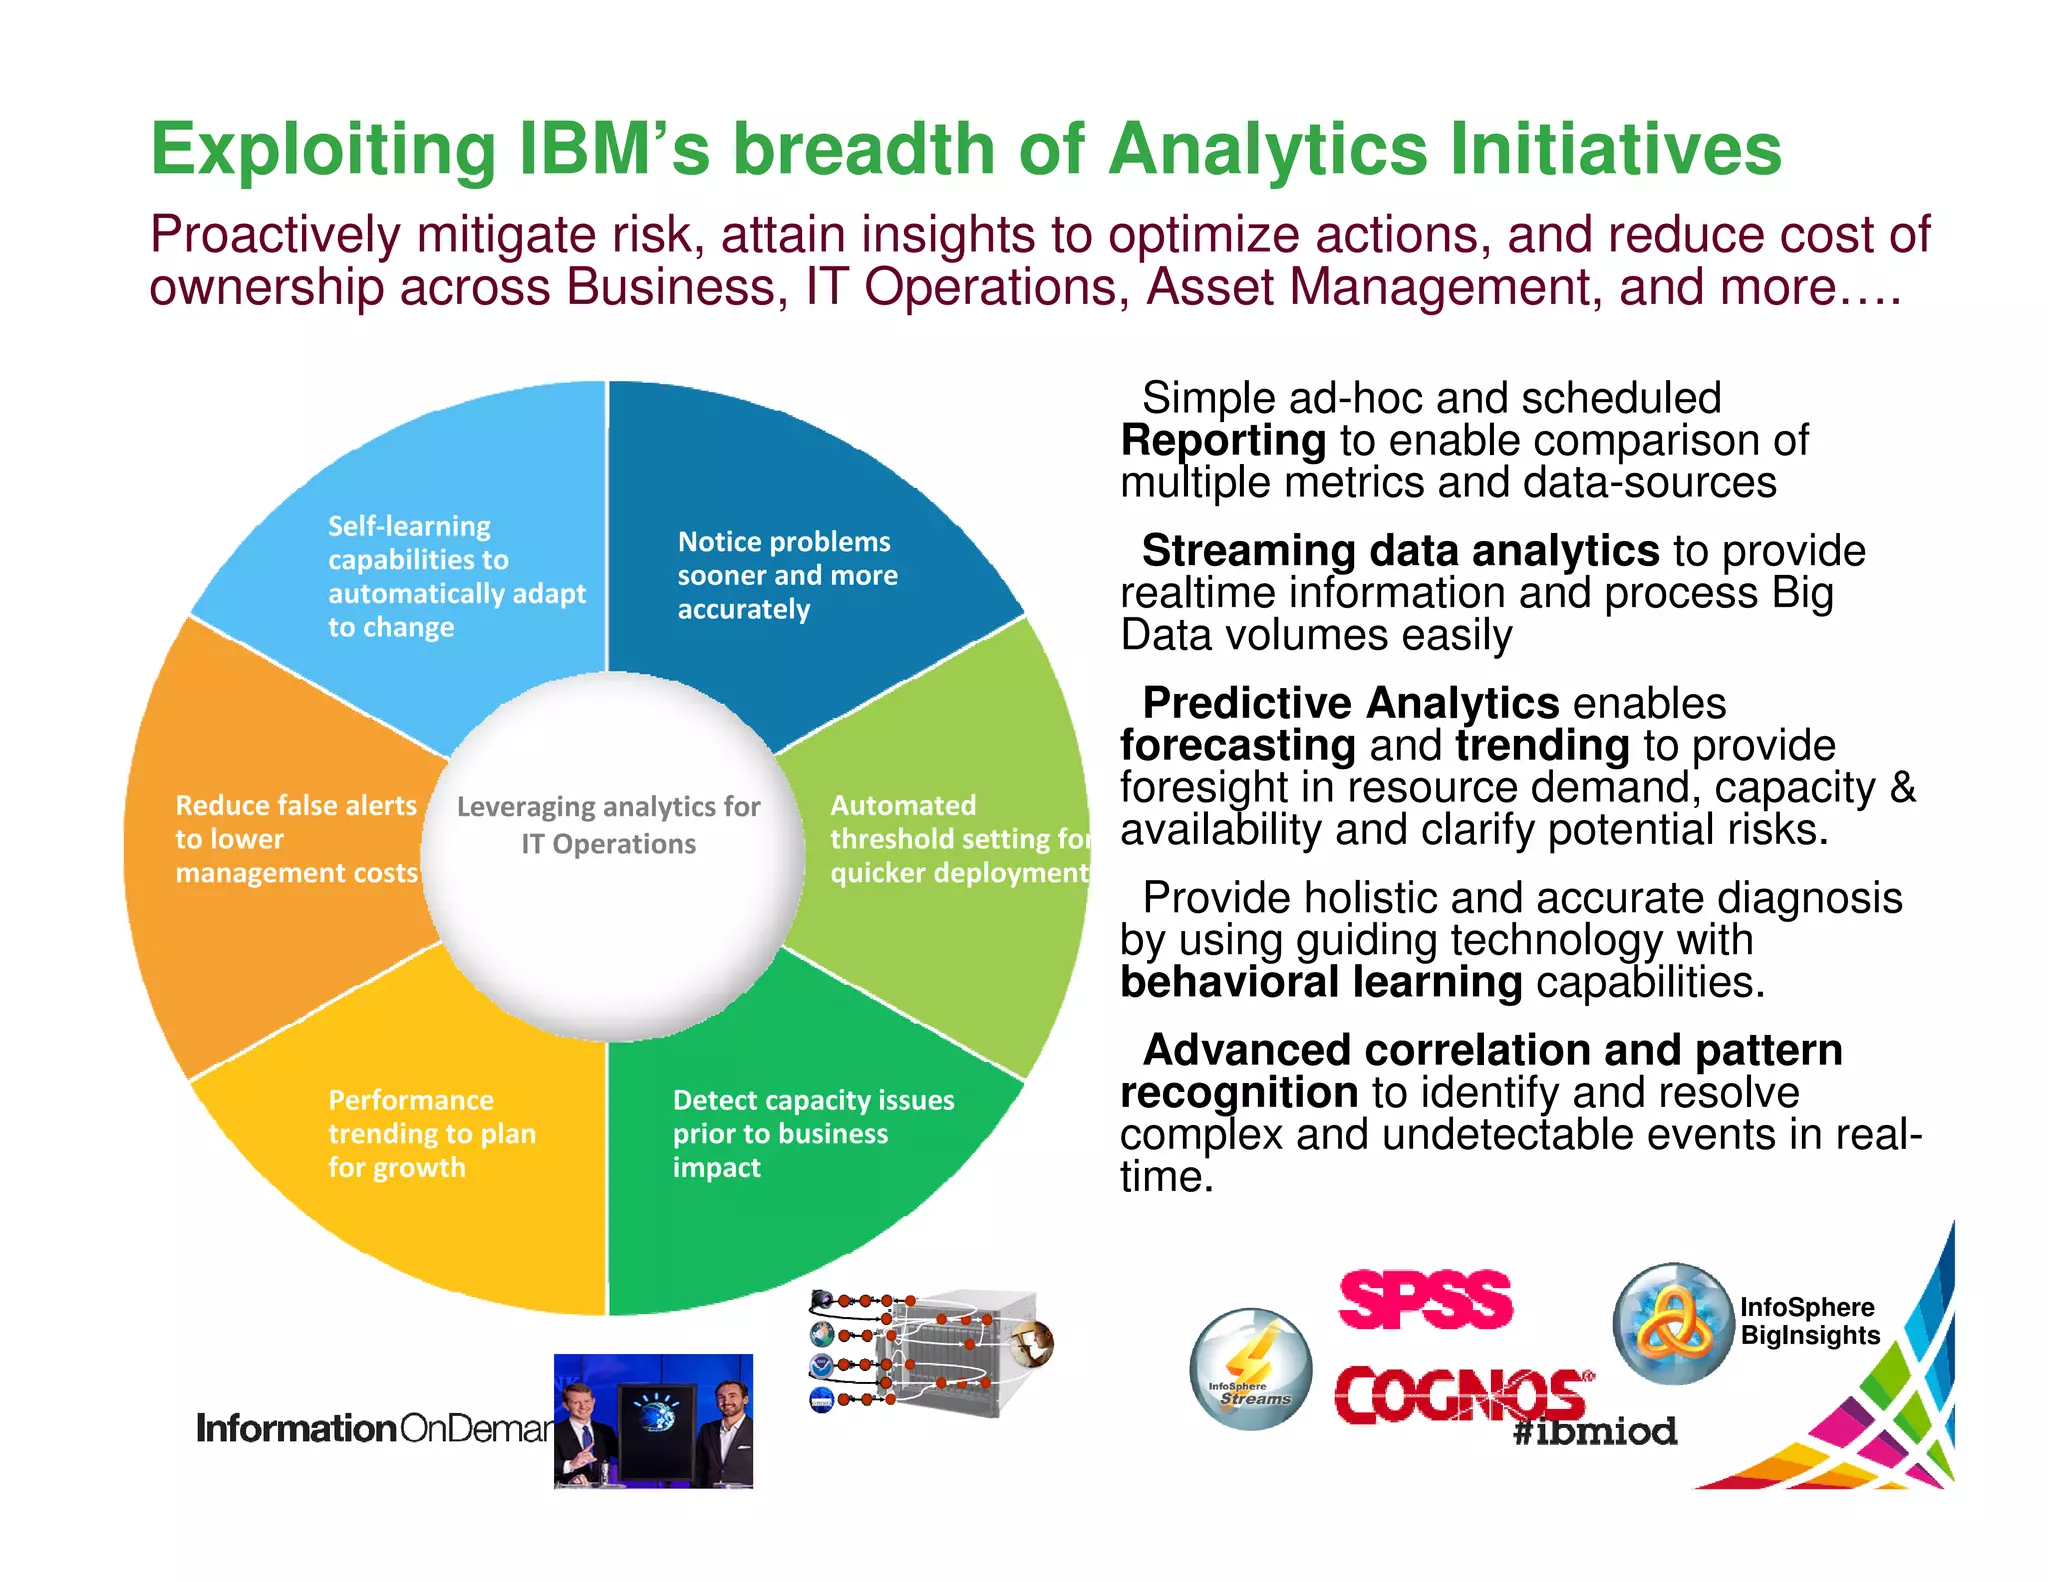
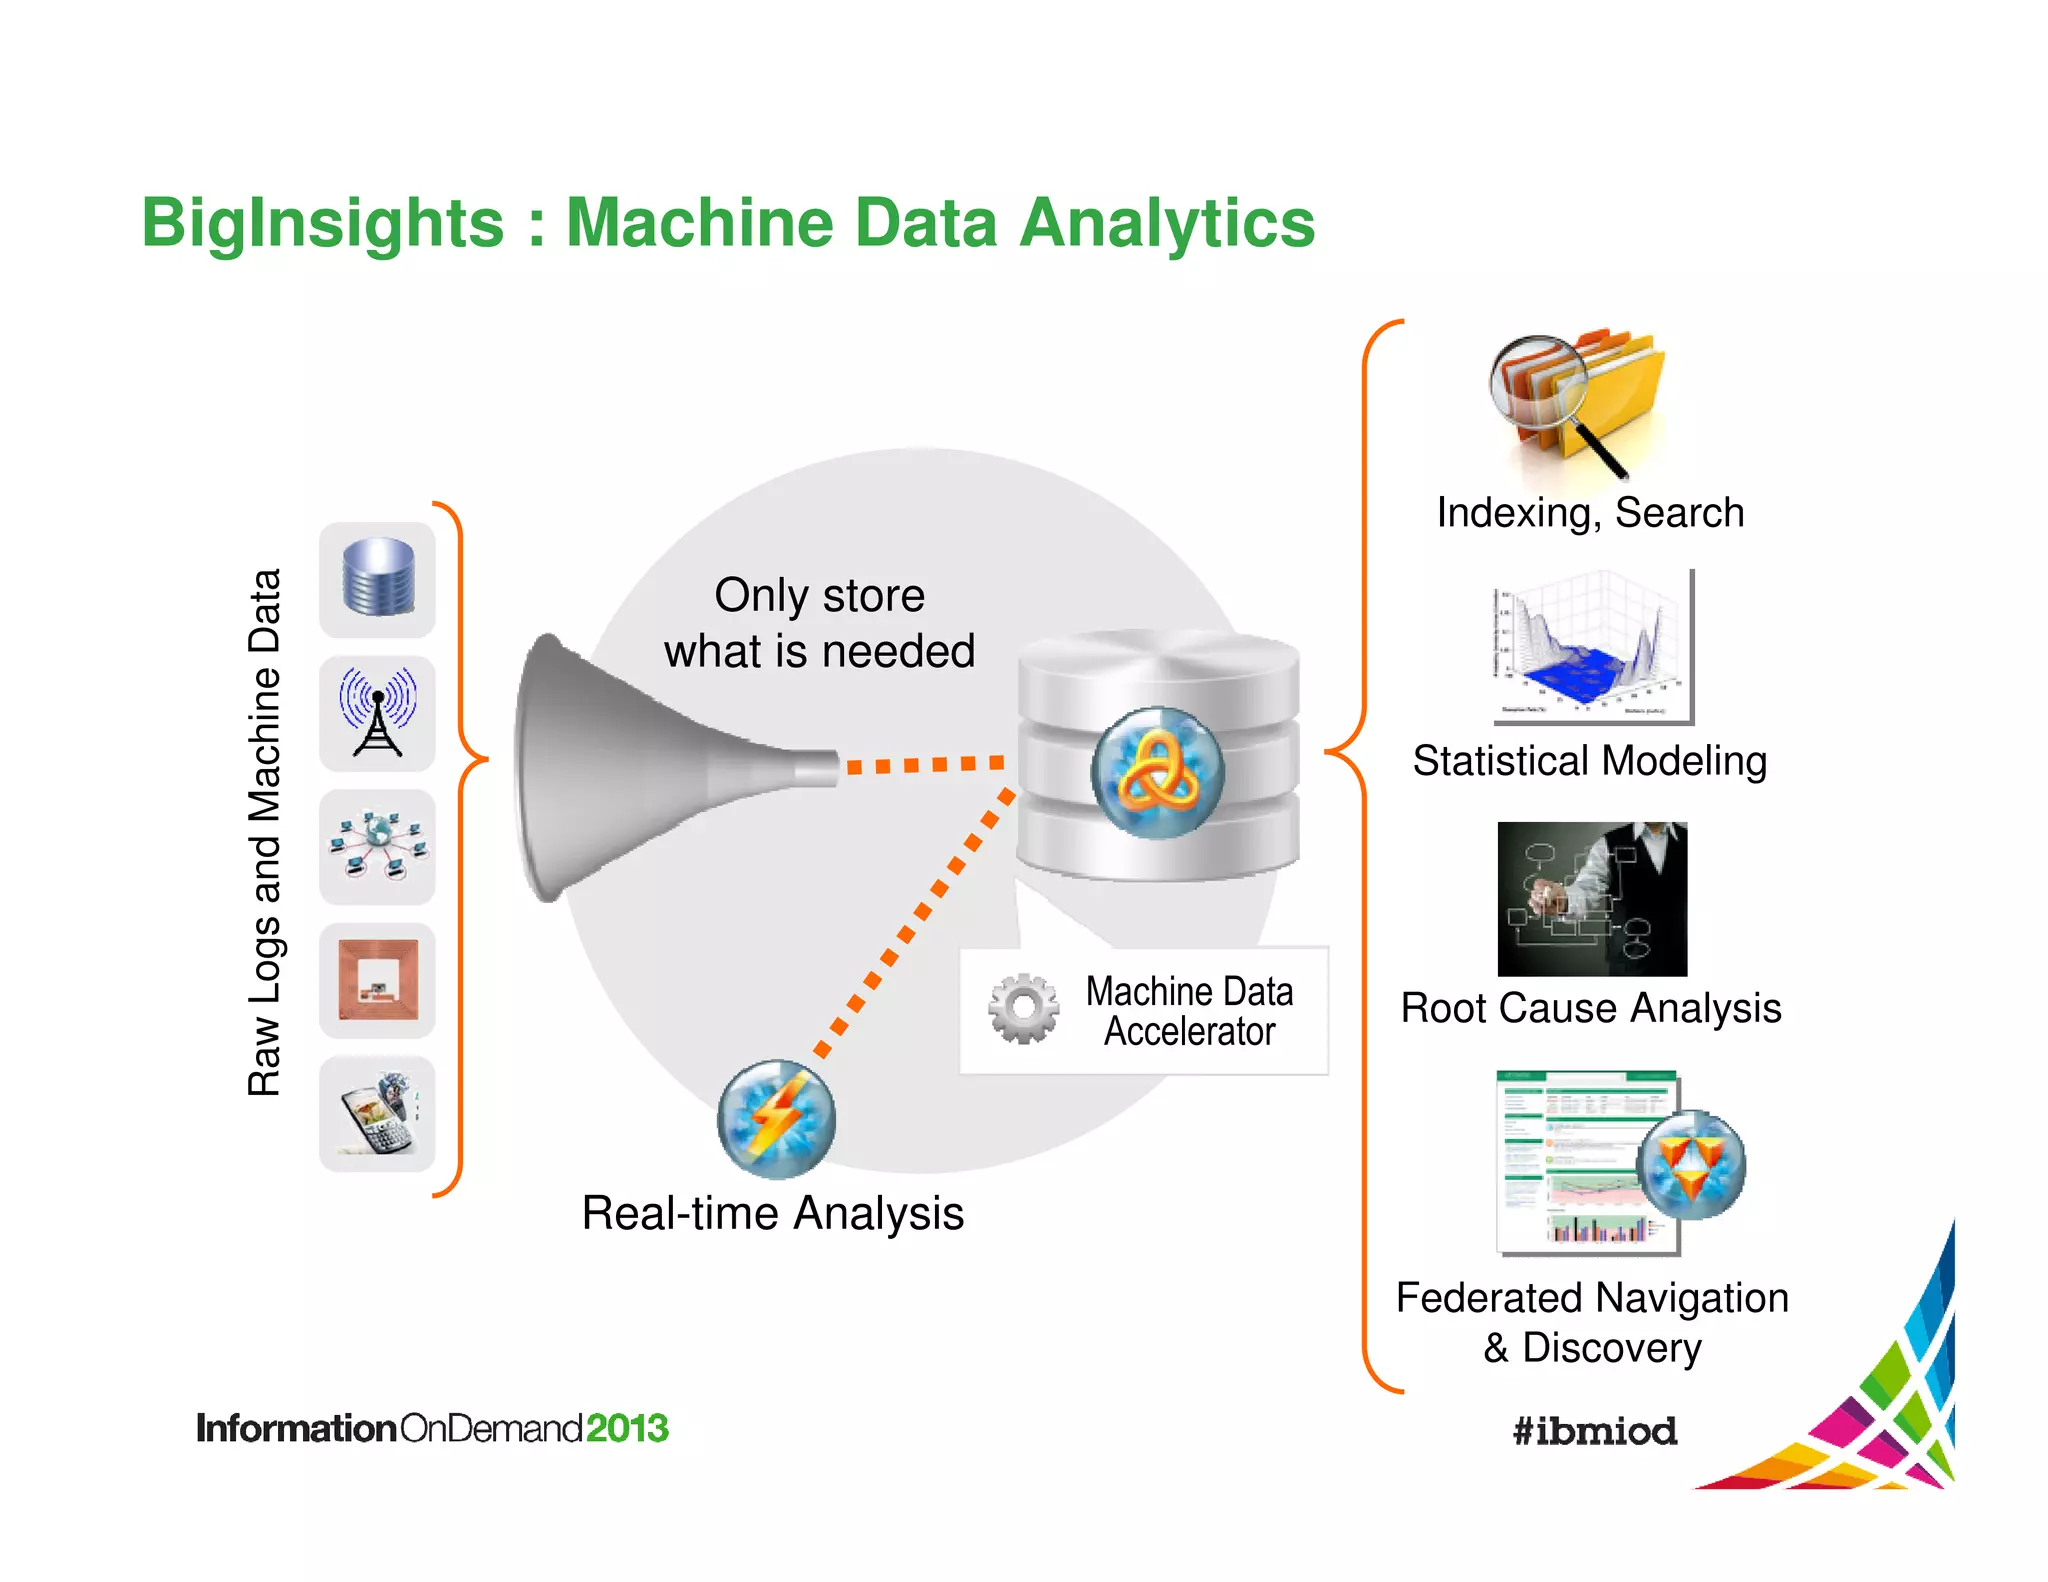
The document discusses the challenges and opportunities presented by big data in IT operations, focusing on the generation and analysis of large volumes of machine data from enterprise systems. It highlights the need for advanced analytics solutions to improve operational visibility, predict and prevent issues, and extract actionable insights in real-time. IBM's Infosphere BigInsights and machine data analytics tools are presented as ways to optimize IT performance and reduce costs through effective data management and analysis.