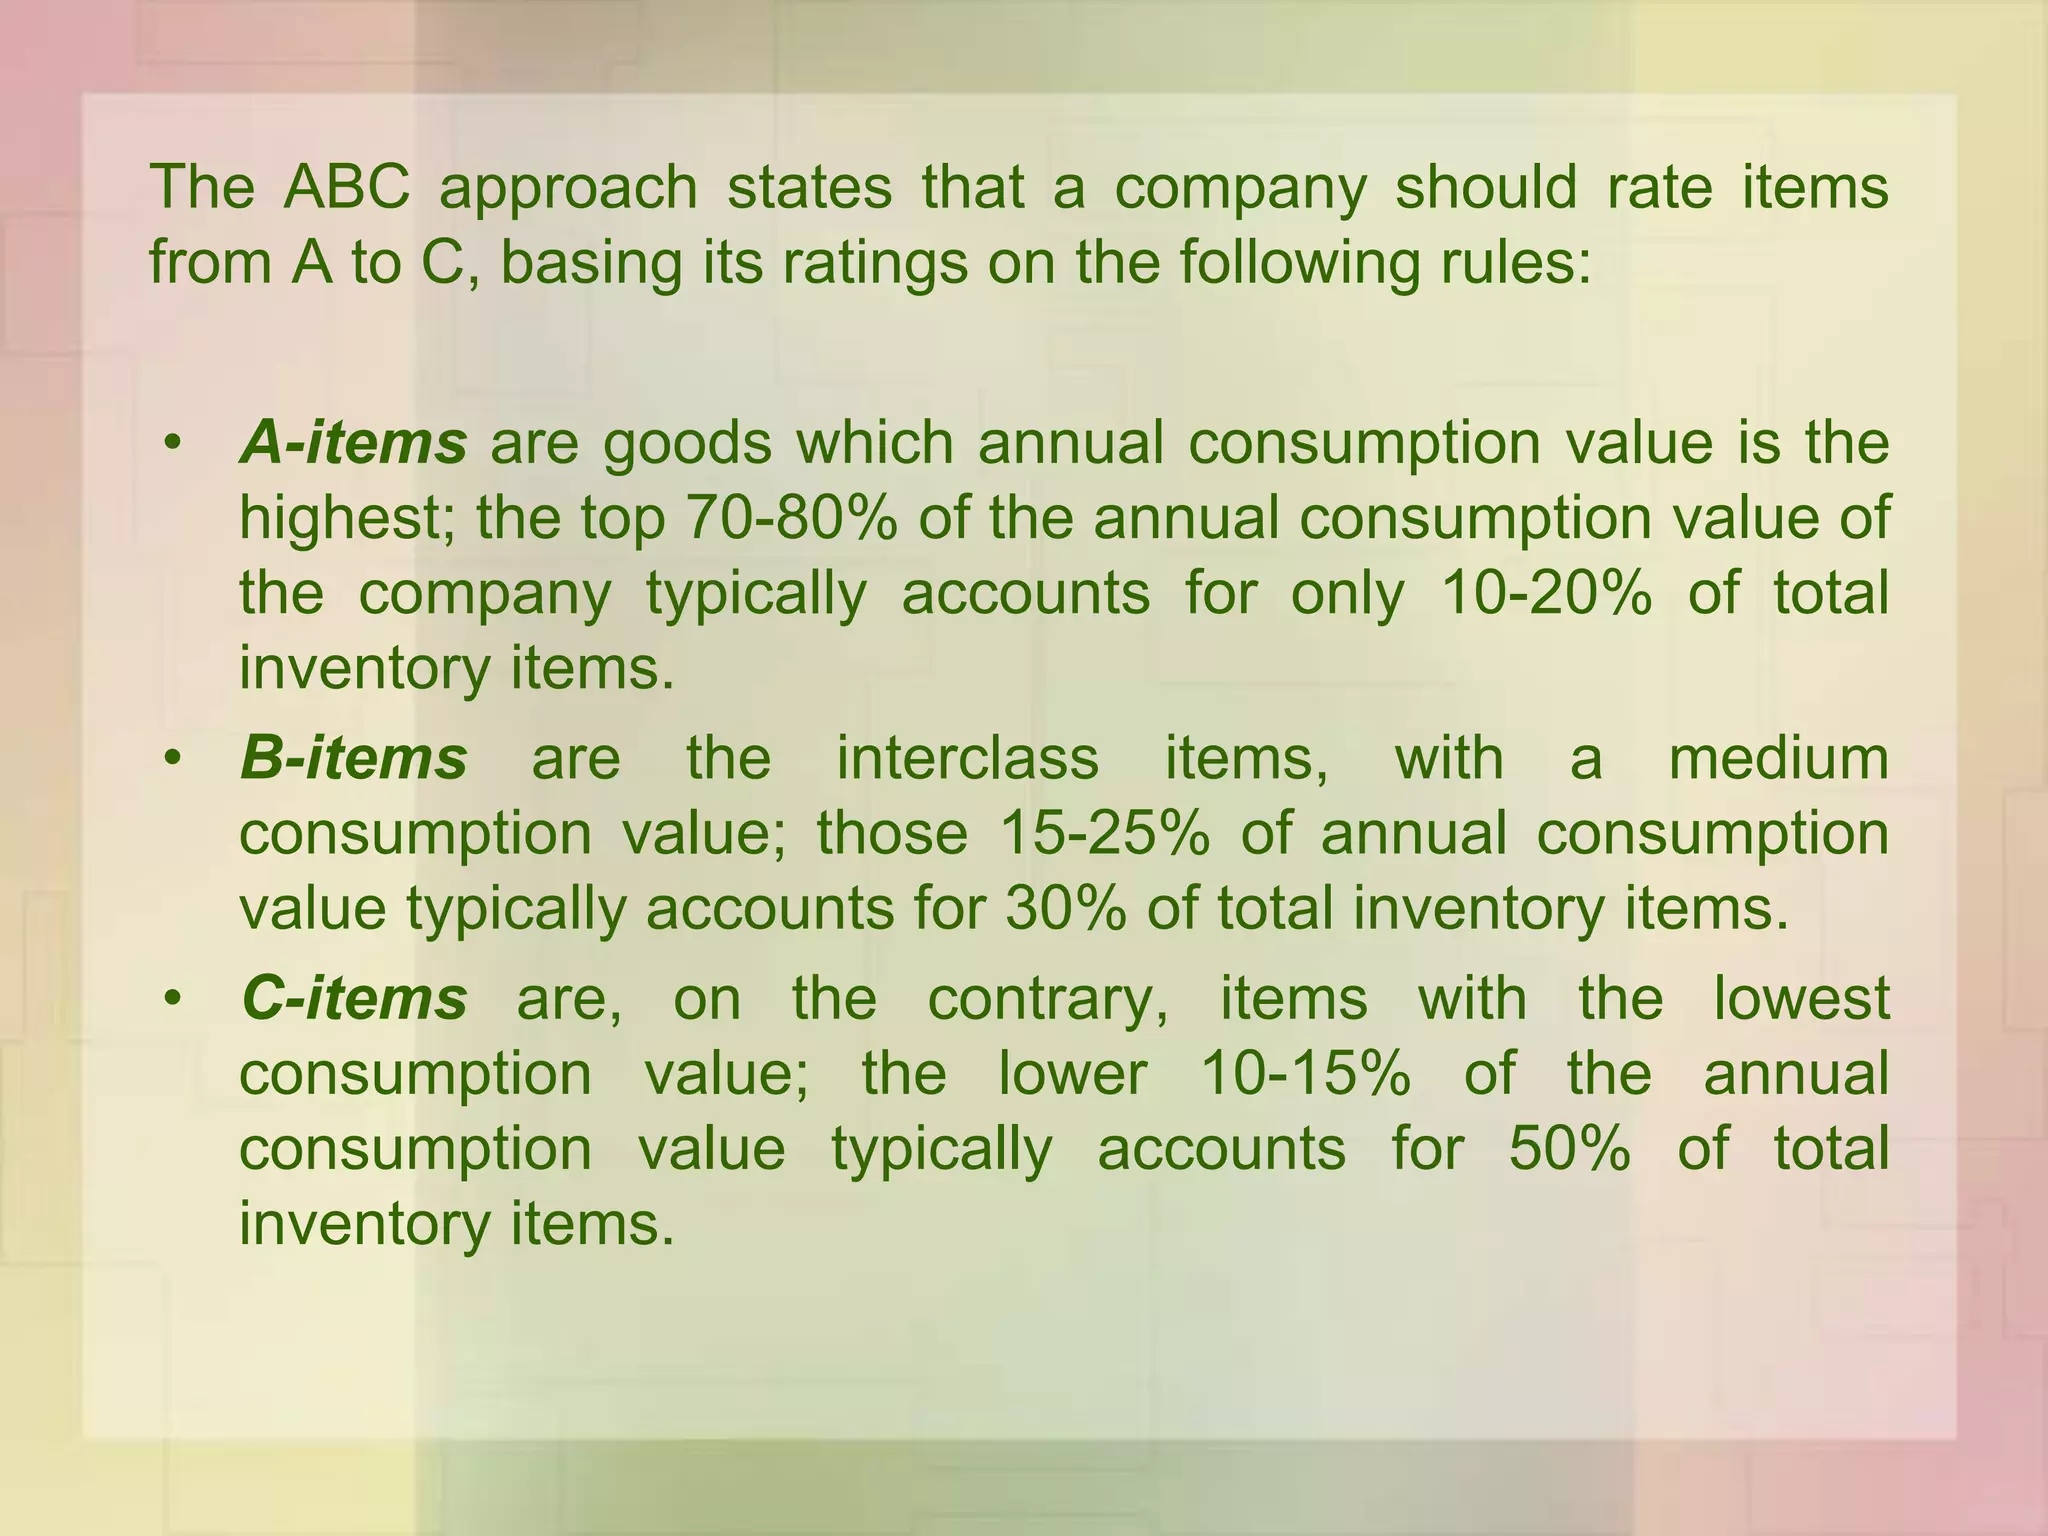
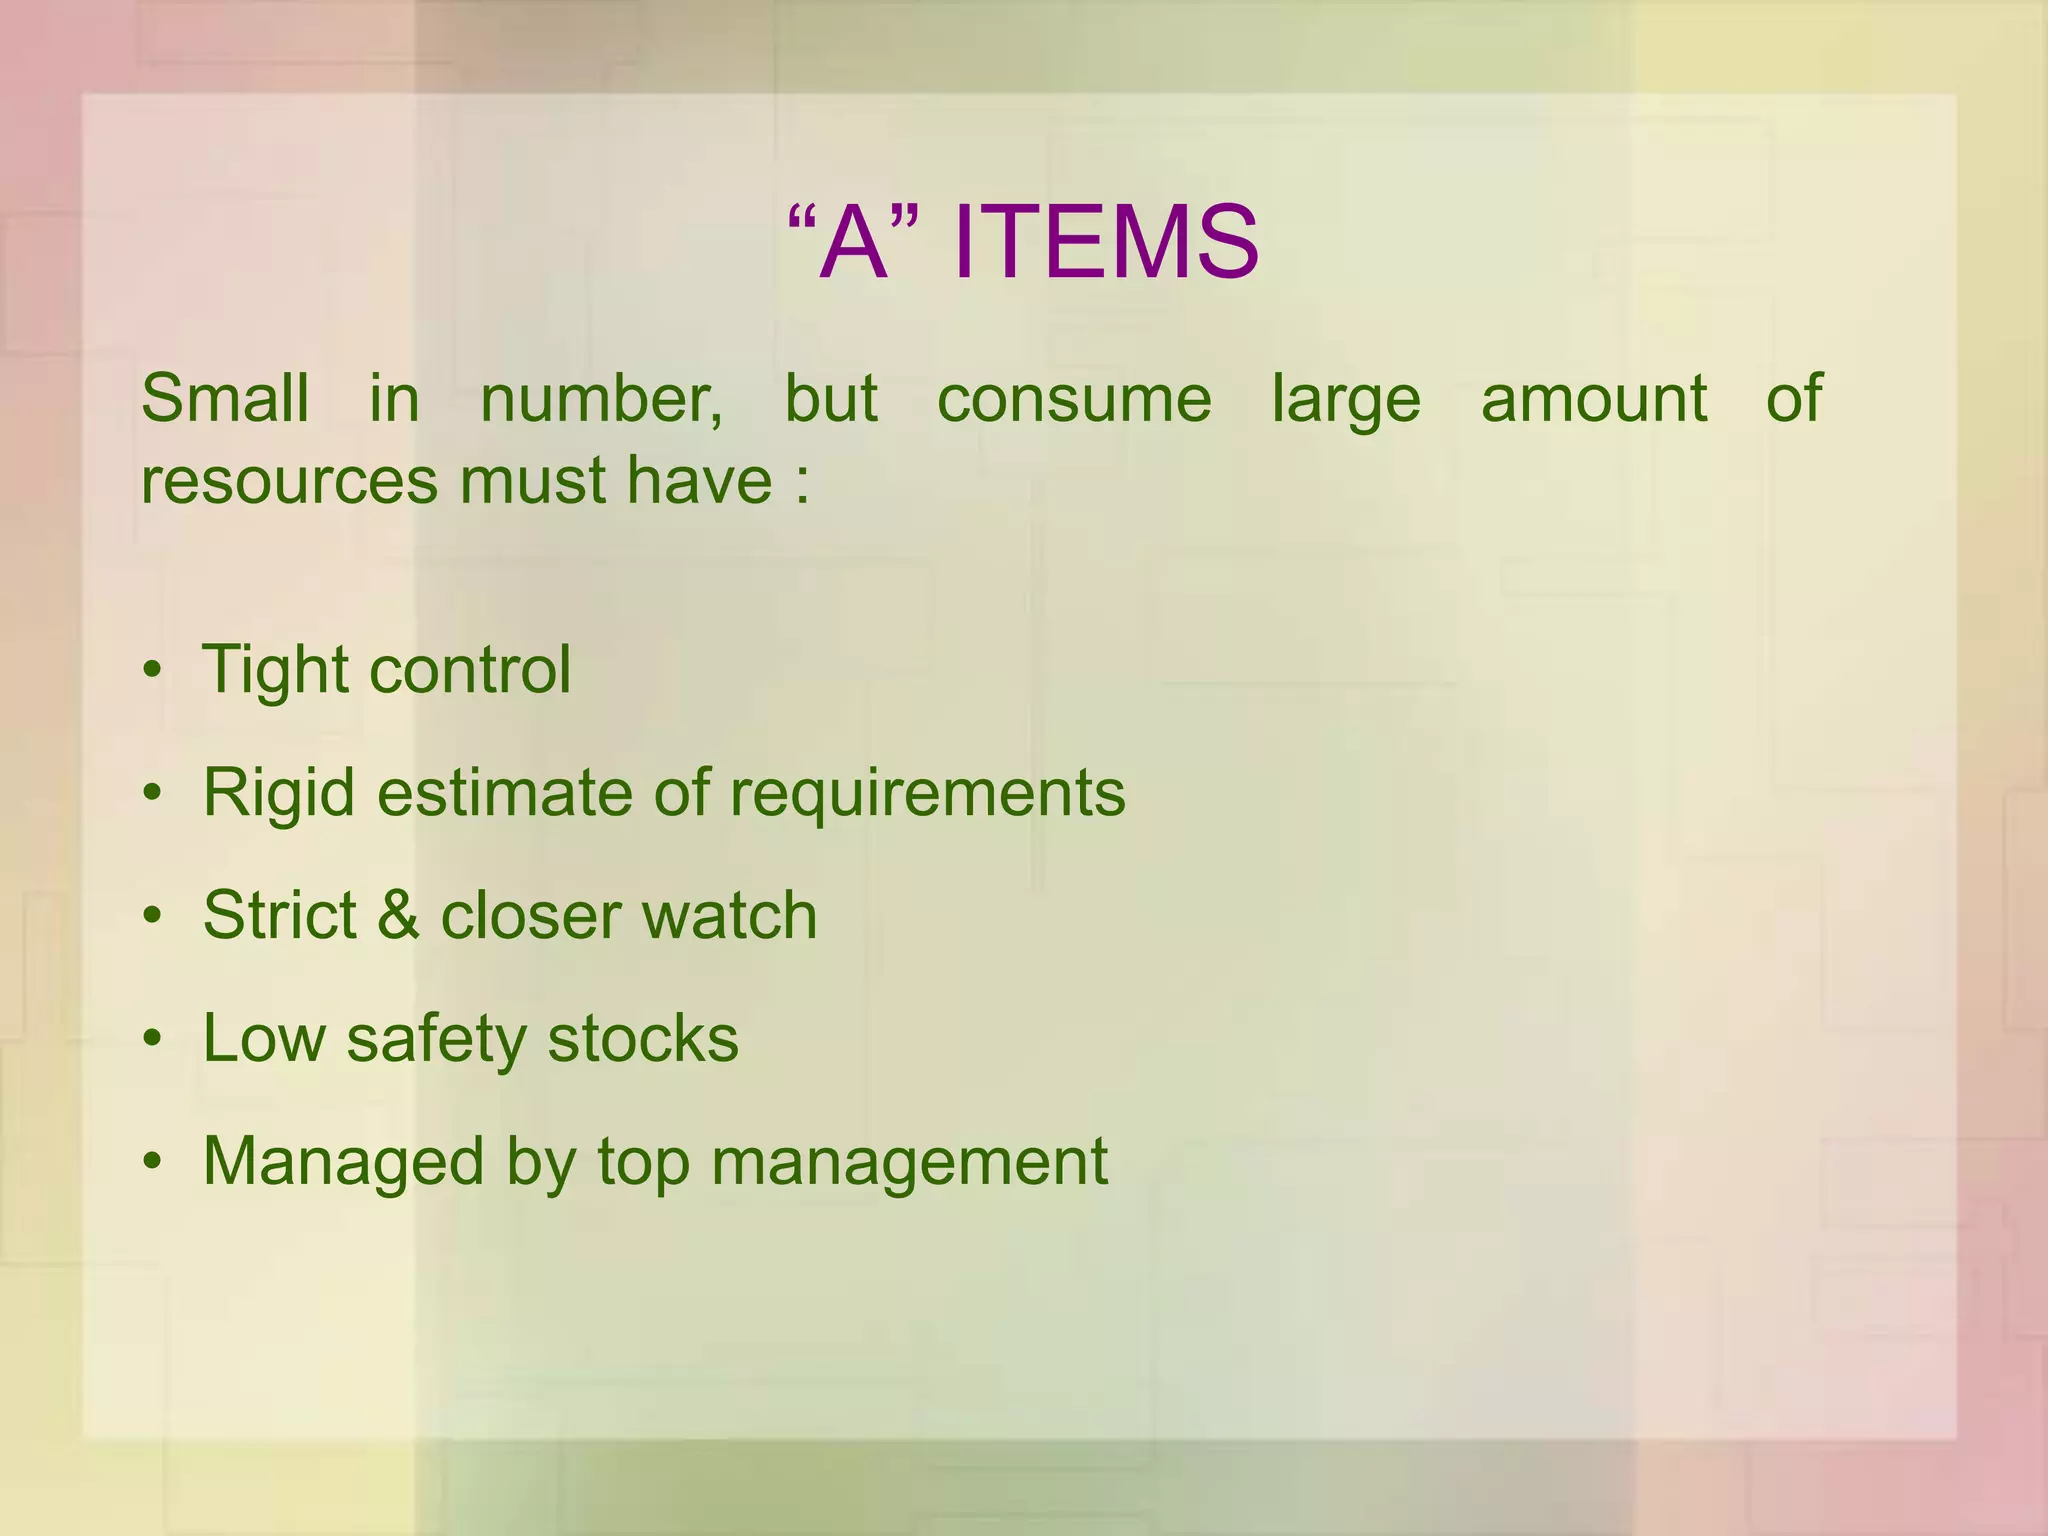
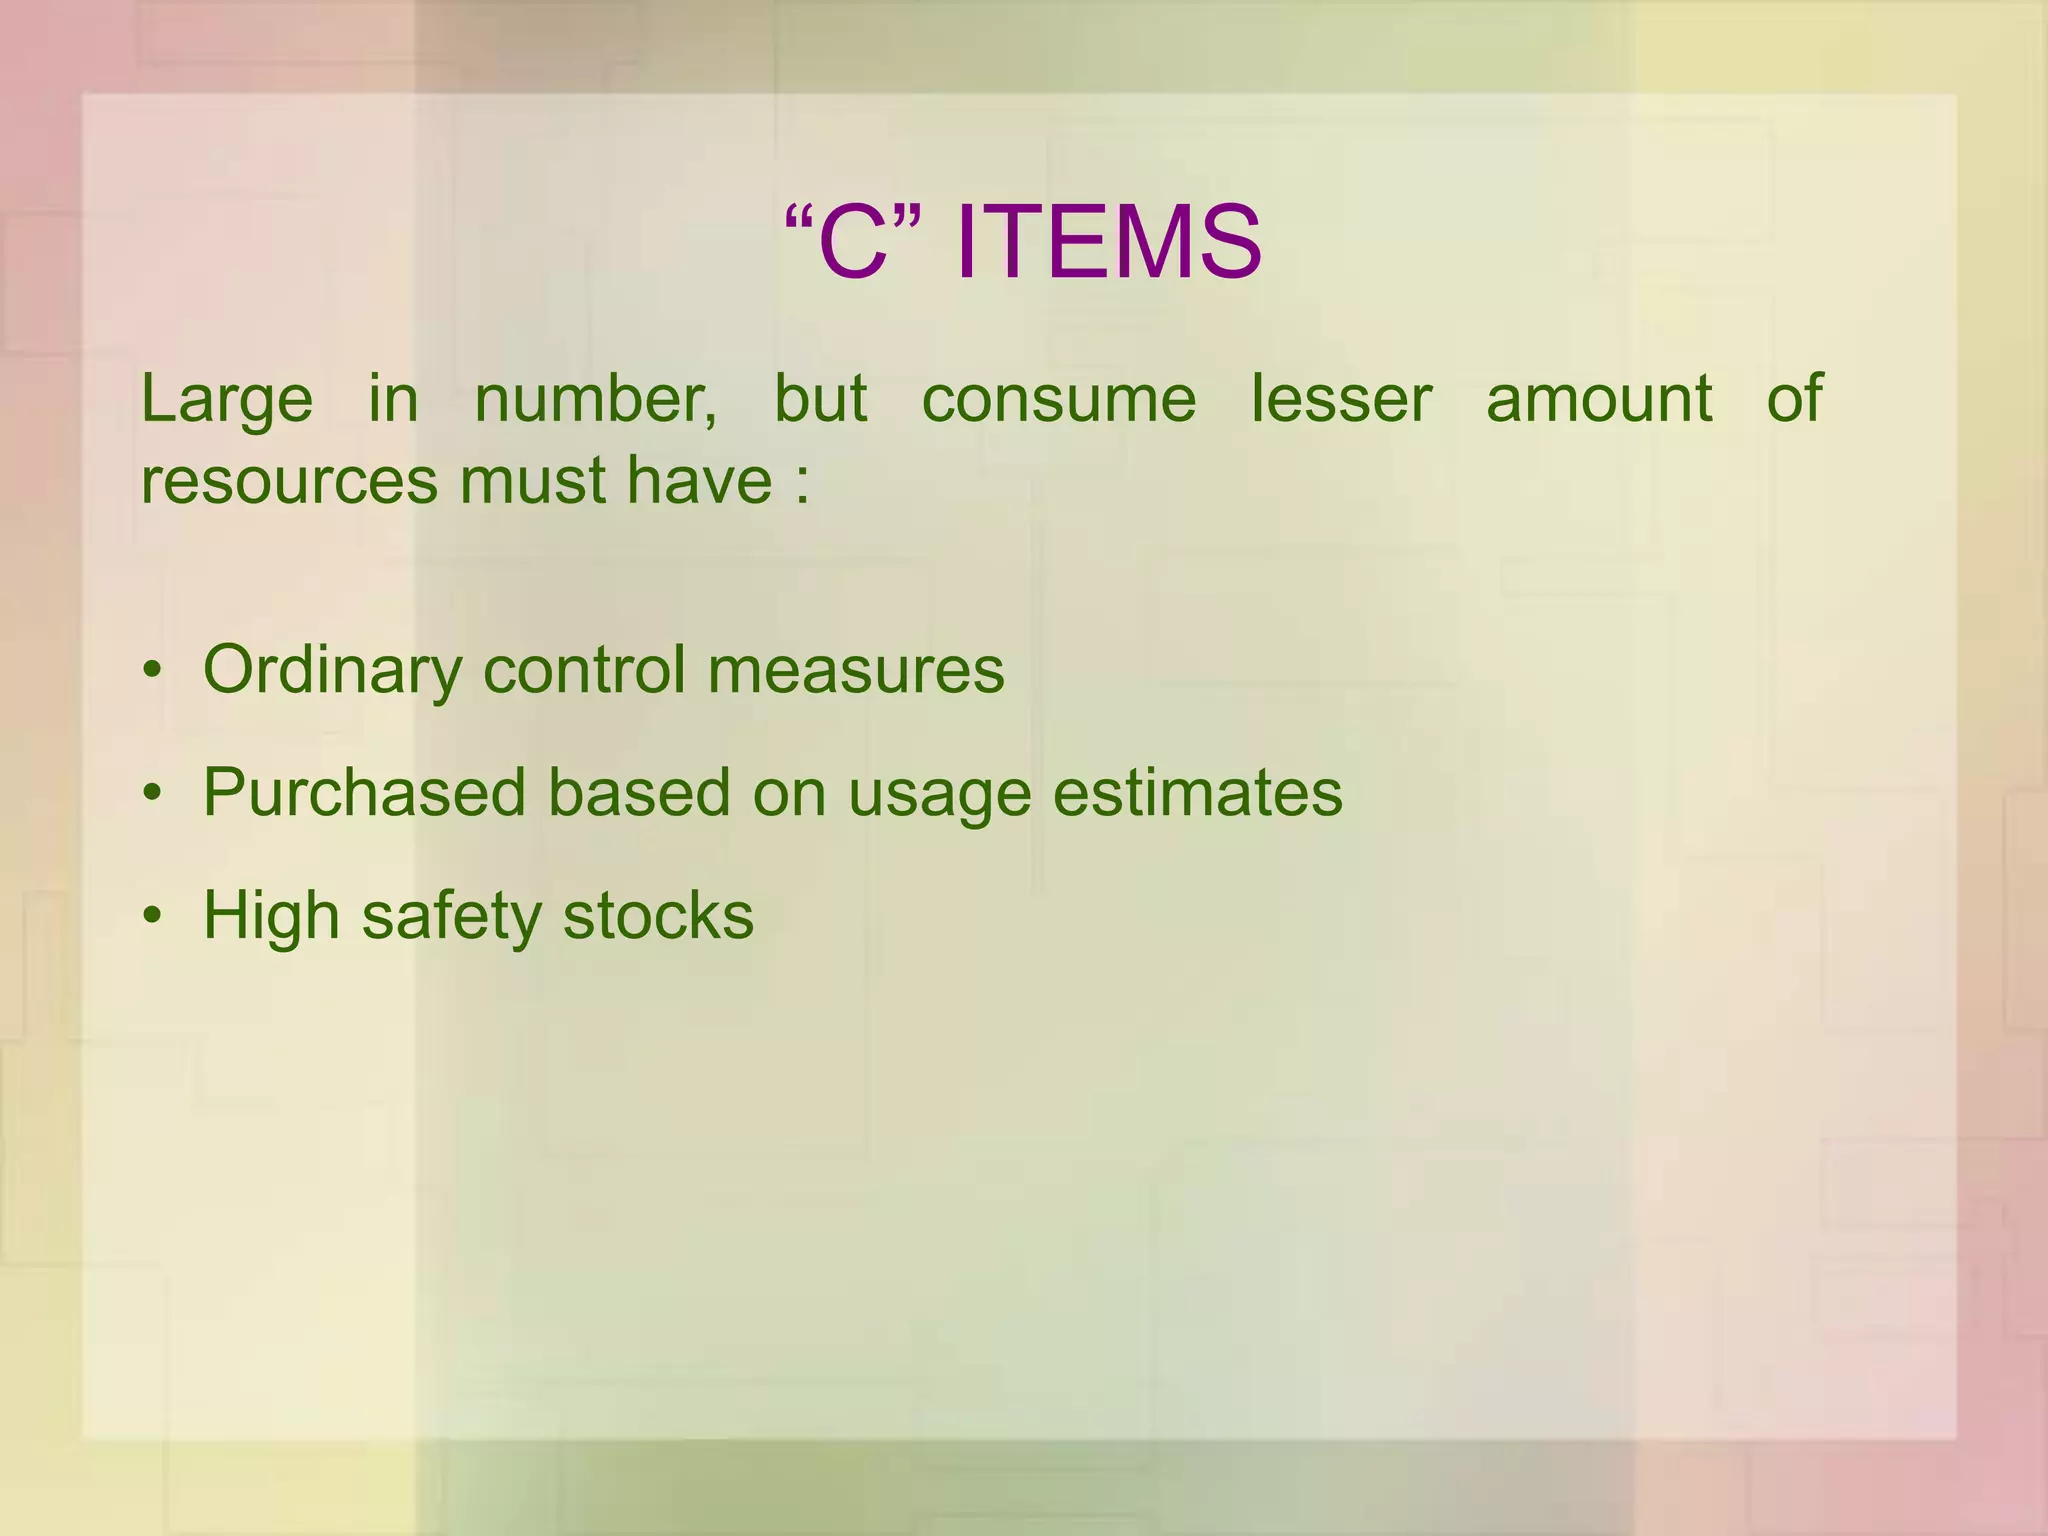
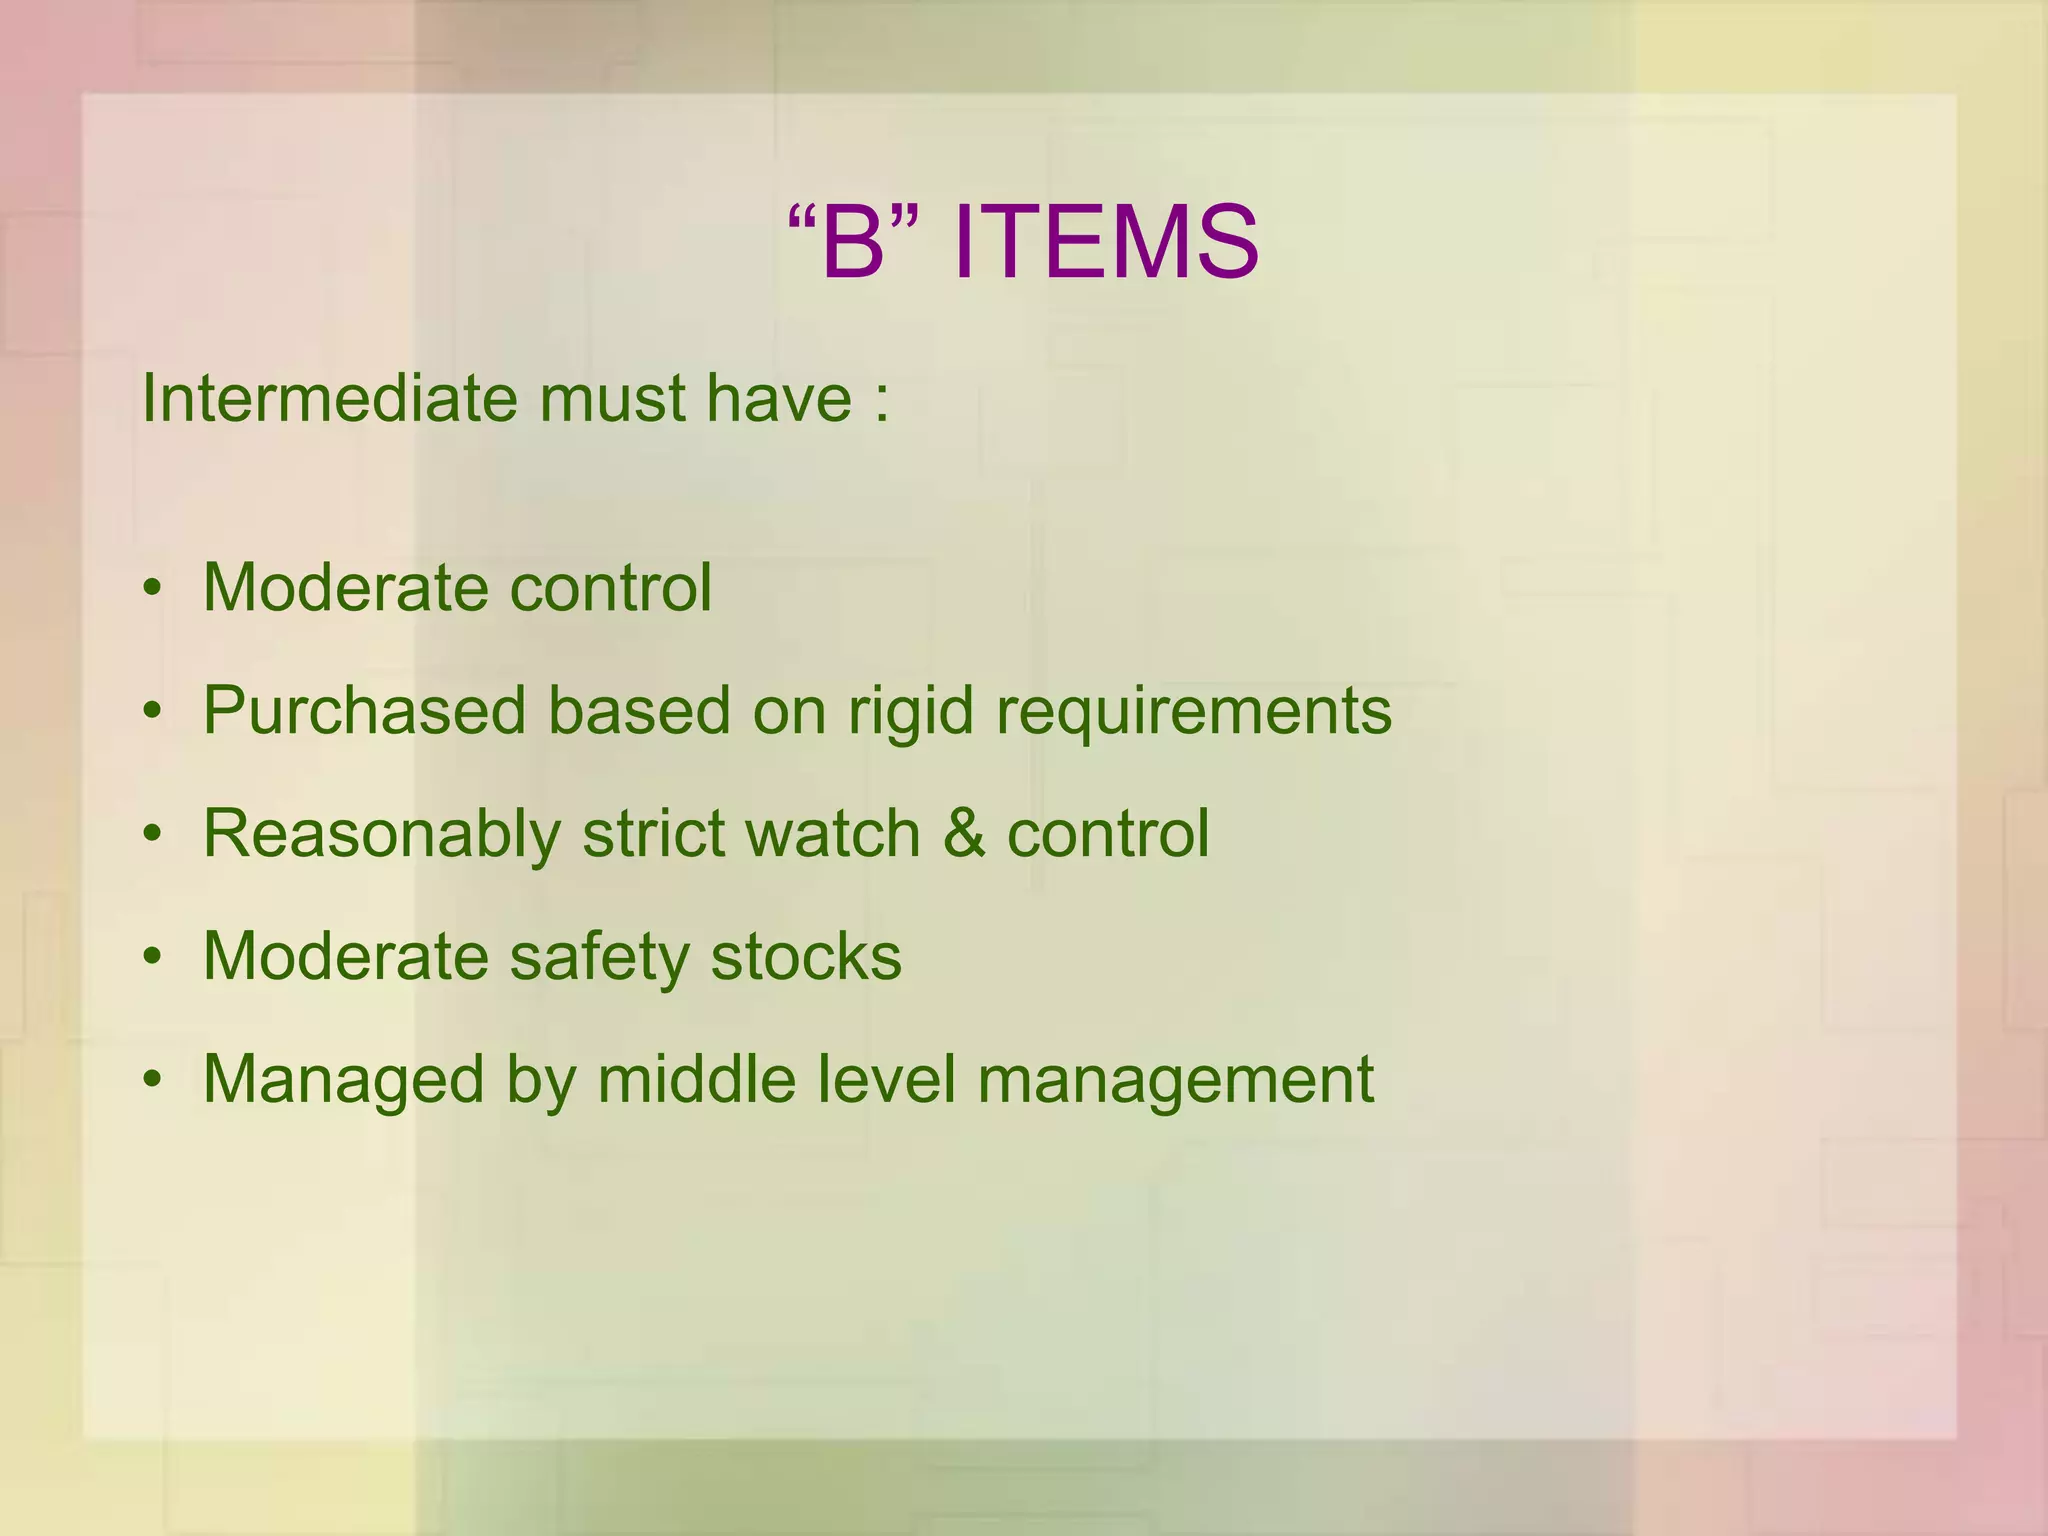
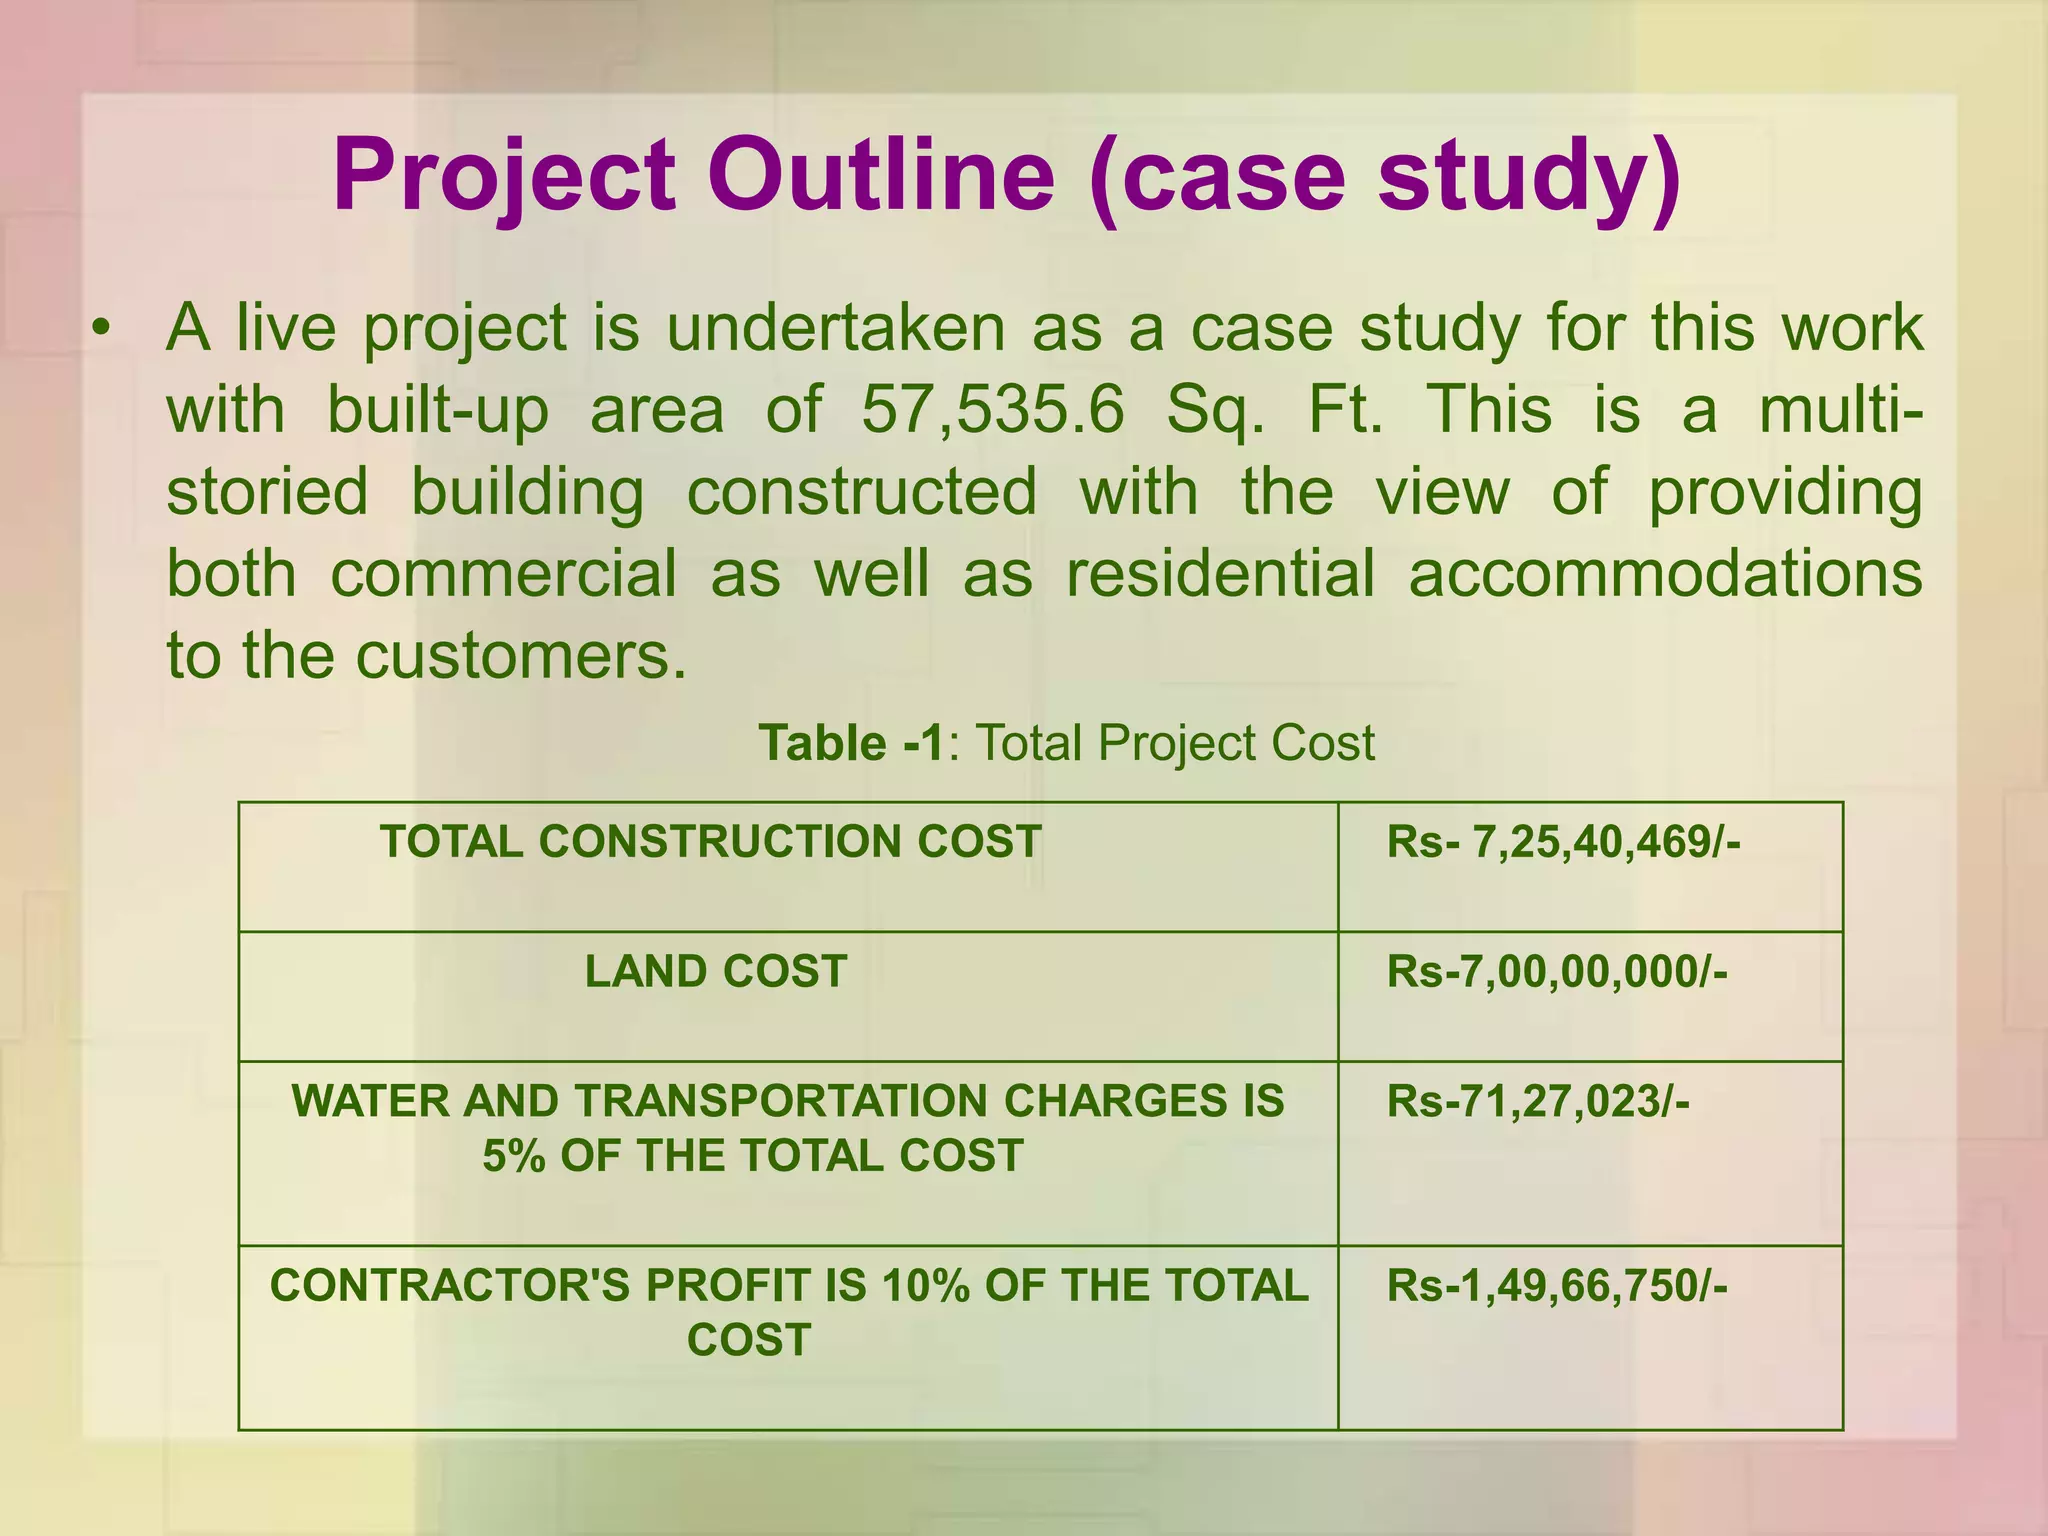
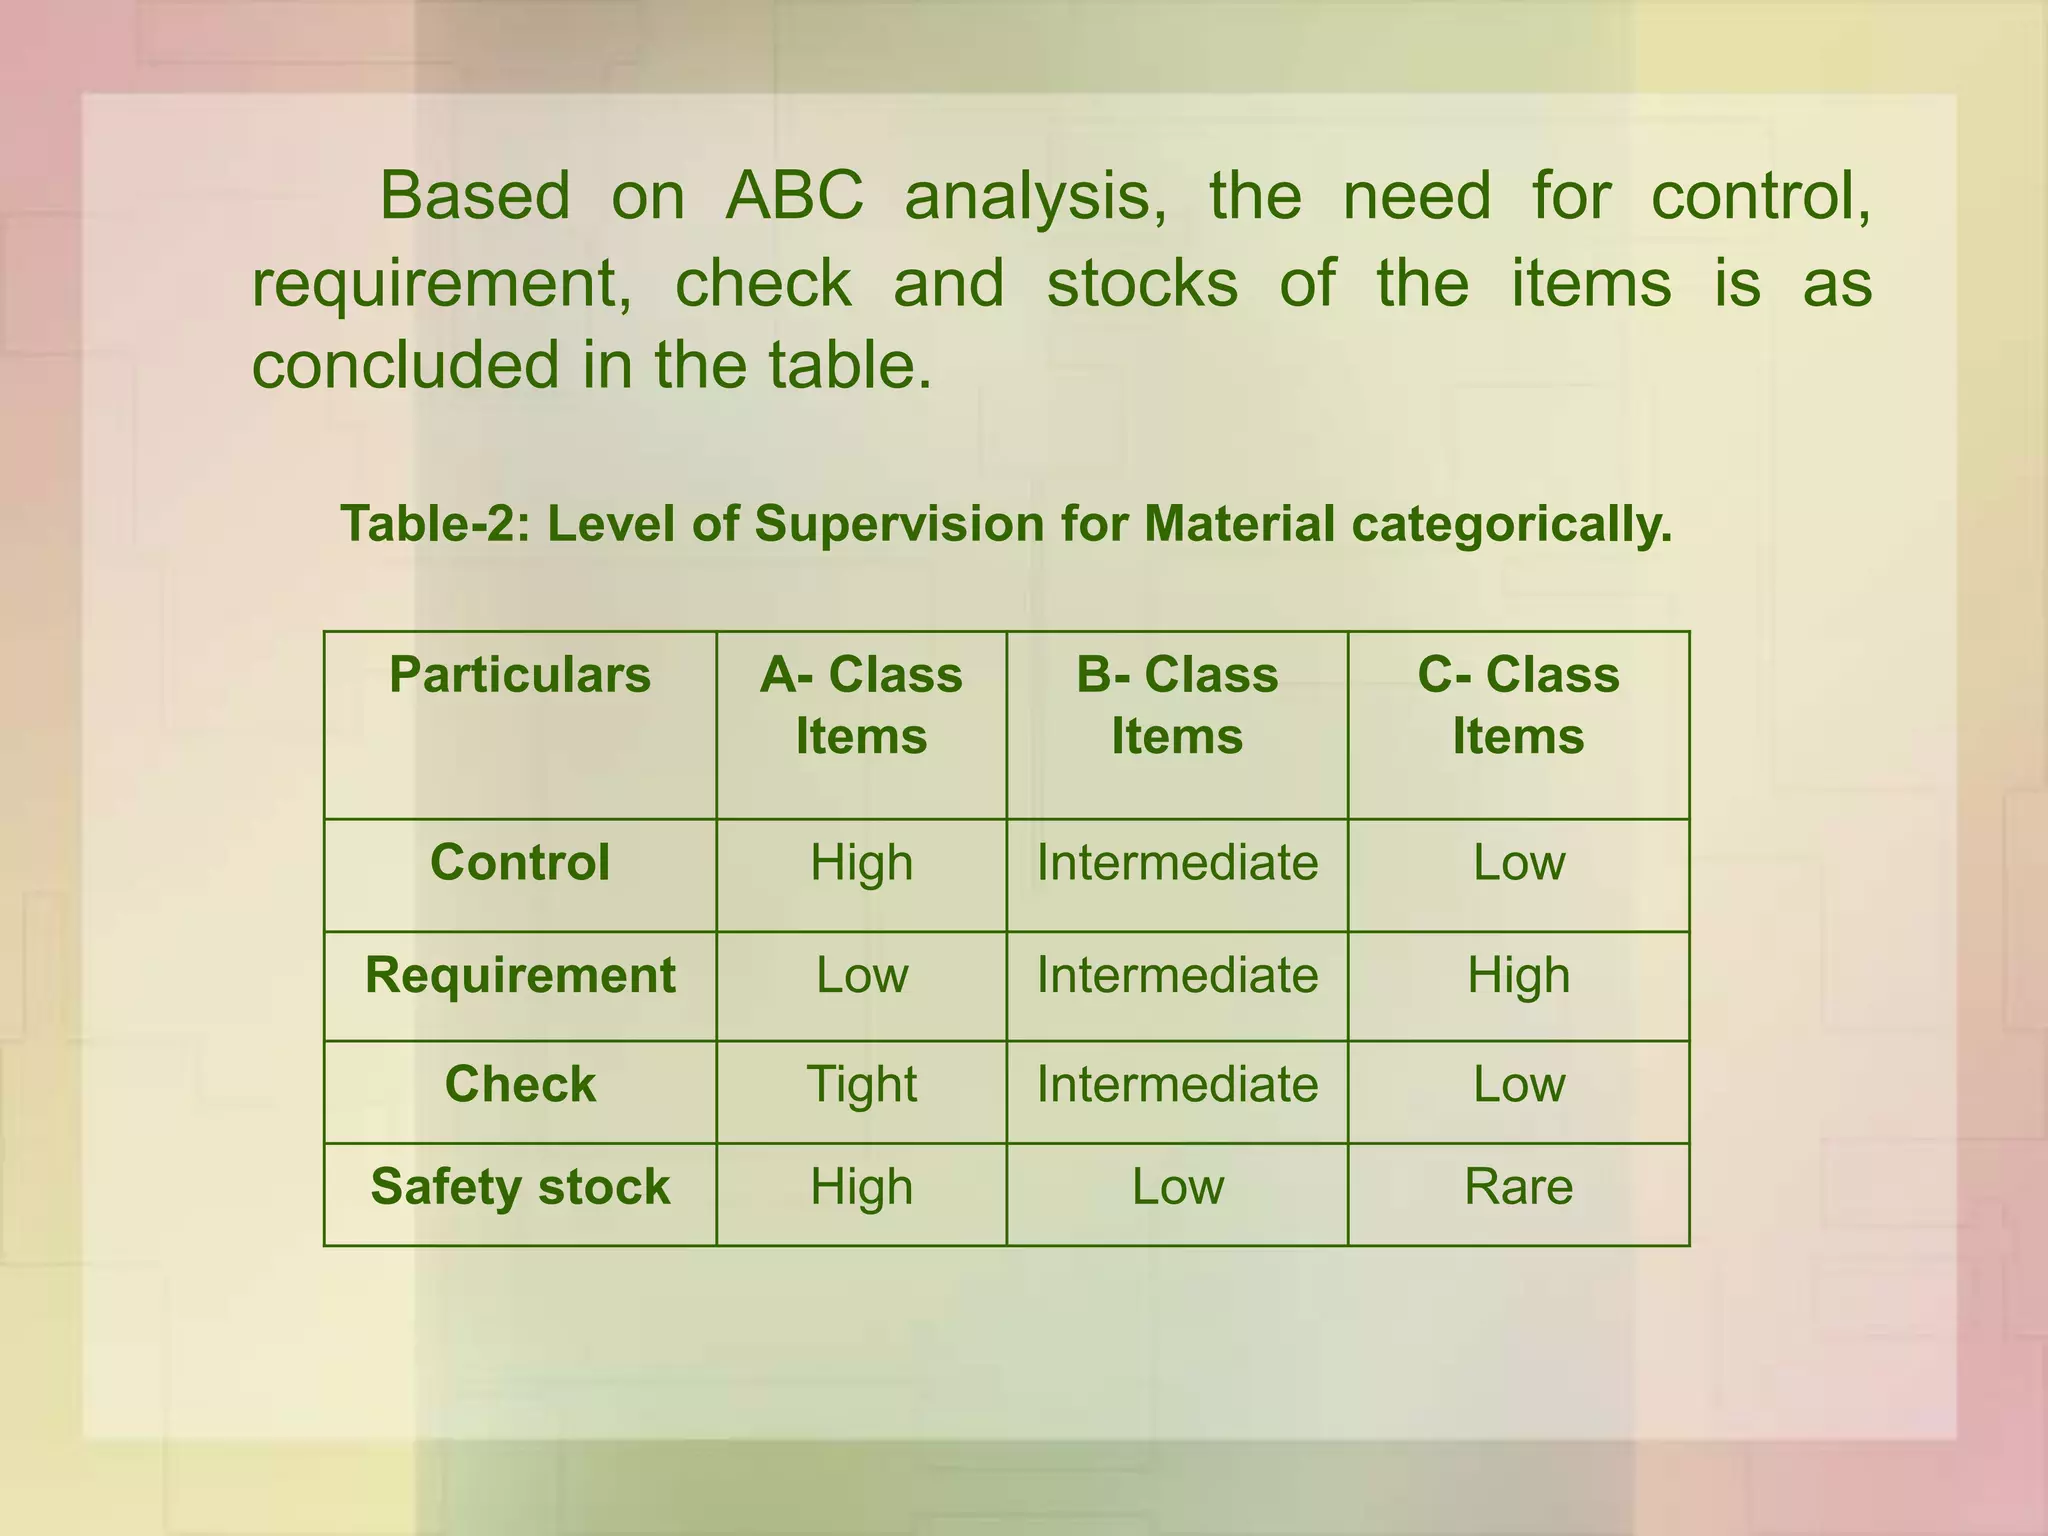
M.TECH. CONSTRUCTION ENGINEERING & MANAGEMENT
RESOURCE MANAGEMENT
(CM504)
APPLICATION OF ABC ANALYSIS FOR MATERIAL MANAGEMENT
OF RESIDENTIAL BUILDING
PREPARED BY :-
KAPTAN SAGAR R
MTECH CONSTRUCTION ENGINEERING
AND MANAGEMENT
B.V.M ENGINEERING COLLEGE,
VALLABH VIDHYANAGAR.
GUIDED BY :-
DR. JAYESHKUMAR PITRODA
ASSISTANT PROFESSOR
CIVIL ENGINEERING DEPARTMENT
BVM ENGINEERING COLLEGE
VALLABH VIDHYANAGAR
BIRLA
VISHWAKARMA
MAHAVIDHAYALA
GUJARAAT
TECHNOLOGICAL
UNIVERSITY
CONTENT :
 Introduction
 Aim of Material Management
 Objectives of Material Management
 Function of Material Management
 Benefits of Material Management
 ABC analysis
 Project outline (case study)
 Conclusion
 References
MATERIAL MANAGEMENT
“Material management is a scientific technique,
concerned with planning, organizing & control of flow of
materials, from their initial purchase to destination.
Aim of Material Management
To get,
1. The Right quality
2. Right quantity of supplies
3. Right source
4. At the Right time
5. At the Right place
6. For the Right cost
Objectives of material management
 Effective material planning.
 Low cost for procurement
 Efficient storage and inventory control.
 Continuity in supply and circulation of materials.
 Quality assurance.
 Good supplier relations.
 Good information system.
1. Primary Objectives :
If the contribution of the objectives is
direct they are called as “primary objectives”. They
are :
Objectives of material management
 Efficient production scheduling.
 Decision to make or buy.
 Prepare specification and standardisation of
materials.
 Predicting material demand and quantity.
 Quality assurance of materials purchased.
 Material handling.
 Uninterrupted material flow.
2. Secondary Objectives :
If the contribution of the objectives is
indirect they are called as “secondary objectives”.
They are :
Function of material management
1. Materials planning and scheduling
2. Purchasing
3. Store keeping
4. Inventory planning
5. Receiving, warehousing and transportation
6. Salvage and disposal of scrap and surplus
Benefits of Material Management
 Reduction in overall material budget.
 Improved handling of material.
 Material is obtained at the desired time and in the
desired quantities.
 Better project schedule.
 Enhancement in labour productivity.
 Healthier relation with suppliers.
 Improved inventory control.
 Improved usage of stores space.
What is ABC analysis?
• ABC (Always Better Control) analysis is an inventory
categorization method which consists in dividing
items into three categories (A, B, C):
– A being the most valuable items,
– C being the least valuable ones.
• This method aims to draw managers’ attention on the
critical few (A-items) not on the trivial many (C-items).
The ABC approach states that a company should rate items
from A to C, basing its ratings on the following rules:
• A-items are goods which annual consumption value is the
highest; the top 70-80% of the annual consumption value of
the company typically accounts for only 10-20% of total
inventory items.
• B-items are the interclass items, with a medium
consumption value; those 15-25% of annual consumption
value typically accounts for 30% of total inventory items.
• C-items are, on the contrary, items with the lowest
consumption value; the lower 10-15% of the annual
consumption value typically accounts for 50% of total
inventory items.
“A” ITEMS
Small in number, but consume large amount of
resources must have :
• Tight control
• Rigid estimate of requirements
• Strict & closer watch
• Low safety stocks
• Managed by top management
“C” ITEMS
Large in number, but consume lesser amount of
resources must have :
• Ordinary control measures
• Purchased based on usage estimates
• High safety stocks
“B” ITEMS
Intermediate must have :
• Moderate control
• Purchased based on rigid requirements
• Reasonably strict watch & control
• Moderate safety stocks
• Managed by middle level management
• The annual consumption value is calculated with the
formula:
=(Annual demand) x (item cost per unit)
• Through this categorization, the supply manager can
identify inventory hot spots, and separate them from
the rest of the items, especially those that are
numerous but not that profitable.
The ABC analysis
The ABC analysis
Graph representing percentage of Items vs percentage of Total cost
Steps for the Classification of Items
1. The unit cost and the demand of each item is obtained
over a given period.
2. Multiply the unit cost by the calculated annual usage to
obtain the net cost.
3. All the items are listed out and arranged in a
descending annual cost.
4. Sum up the cost and add up the number of items then,
compute percentage on the total inventory of total cost
and for total number of items consumed.
5. Draw a graph of percentage items vs percentage cost.
6. Mark from the curve the rational limits of A, B and C
categories.
Project Outline (case study)
• A live project is undertaken as a case study for this work
with built-up area of 57,535.6 Sq. Ft. This is a multi-
storied building constructed with the view of providing
both commercial as well as residential accommodations
to the customers.
TOTAL CONSTRUCTION COST Rs- 7,25,40,469/-
LAND COST Rs-7,00,00,000/-
WATER AND TRANSPORTATION CHARGES IS
5% OF THE TOTAL COST
Rs-71,27,023/-
CONTRACTOR'S PROFIT IS 10% OF THE TOTAL
COST
Rs-1,49,66,750/-
Table -1: Total Project Cost
• According to the estimate Rs.16,46,34,242 (Rupees
Sixteen crores Forty Six lakhs Thirty Four thousand Two
hundred and Forty Two) is the probable cost for
constructing a built-up area of 57,535.6 Sq.ft. The rate
for per Sq.ft of area is Rs. 2861.31.
After plotting the graph for different items according to
the “% of items” vs “% of total cost”, they are
categorized according to their impact on total cost of
materials. This categorization is shown in the tabulation.
CATEGORY ITEMS % OF ITEMS % OF
TOTAL
COST
ACTION
CLASS A SAND,
STEEL,FLOORING
20% 43% CLOSE
CONTROL
CLASS B BLOCKS,
CEMENT,
PAINTING,
DOOR,
BATHROOM
FITTINGS
30% 37% REGULAR
REVIEW
CLASS C AGGREGATES,
WINDOWS,
FORMWORK,
ELECTRICAL
FITTINGS,
GLASS
RAILING,
KITCHEN
PLATFORMS
50% 20% INFREQUENT
REVIEW
The percentage of different items under Class A, Class B
and Class C for their total percentage of items used is as
represented in the pie chart below.
Chart -2: Graph representing % of Items used .
CLASS A
20%
CLASS B
30%
CLASS C
50%
% of Items Used
The impact of items in A, B and C category on the total
material cost is highlighted by the pie chart shown below.
CLASS A
43%
CLASS B
37%
CLASS C
20%
% of Total cost
Chart -3: Graph representing % of Total Cost.
CONCLUSION
• In construction environment, an organization requires
to maintain a balance between critical stocks-outs
and reducing inventory costs. From this study, it is
established that this analysis helps in managing the
materials well for both raw material and for finished
goods. It helps to understand the problem occurring
in purchasing and safety stock.
• From the results of ABC Analysis, we conclude that
material management in construction of project is of
high importance as the material cost contributes to
62.87% of the total construction cost of the project.
CONCLUSION
The ABC analysis shows that :
i. Class A items contributes 43% of the total material cost. It is
found sand, steel and flooring belong to this class.
ii. Class B items contributes 37% of the total material cost. It is
found blocks, cement, painting, doors and bathroom fittings
belong to this class.
iii. Class C items contributes 20% of the total material cost. It is
found aggregates, windows, formwork, electrical fittings,
glass railing, kitchen platform, pipes and pavers belong to
this class.
It shows that the categorization technique used for
material management where accuracy and control increases
from C to A.
Based on ABC analysis, the need for control,
requirement, check and stocks of the items is as
concluded in the table.
Table-2: Level of Supervision for Material categorically.
Particulars A- Class
Items
B- Class
Items
C- Class
Items
Control High Intermediate Low
Requirement Low Intermediate High
Check Tight Intermediate Low
Safety stock High Low Rare
REFERENCES :
• 1. Handanhal Ravinder, Ram B. Misra, “ABC Analysis For Inventory
Management: Bridging The Gap Between Research And Classroom”
American Journal Of Business Education, Volume 7, Number 3,
2014.
• 2. Aditya Pande, Syed. Sbihuddin “Material Management for
Construction Site –A Review”, International Engineering Journal for
Research & Development, Volume 1, Issue 5, 2014.
• 3. Ashwini R. Patil, Smita V. Pataskar, “Analyzing Material
Management Techniques on Construction Project”, International
Journal of Engineering and Innovative Technology, Volume 3, Issue
4, October 2013.
• 4. Dinesh Dhoka, Dr.Y.Lokeswara Choudary, “ABC Classification for
Inventory Optimization”, IOSR Journal of Business and Management,
Volume 15, Issue 1 (Nov. - Dec. 2013).
• 5. T. Phani Madhavi, Steve Varghese Mathew, Roy Sasidharan,
“Material Management in Construction – A Case Study”, International
Journal of Research in Engineering and Technology, Nov-2013.
• 6. Gulsen Aydin Keskin and CoskunOzkan, “Multiple Criteria ABC
Analysis with FCM Clustering”, Journal of Industrial Engineering,
2013.
• 7. Khyomesh V. Patel, Chetna M.Vyas, “Construction Materials
Management on Project Sites”, National Conference on Recent
Trends in Engineering & Technology, May 2011.
• 8. N.B. Kasim, C.J. Anumba and A.R.J. Dainty, “Improving Materials
Management Practices on Fast-track Construction Projects”,
Association of Researchers in Construction Management, Vol. 2,
September 2005.
• 9. Materials Management-A Conceptual and Functional Framework.
• 10. Chapter 1-Materials Management from Materials and Financial
Management.
APPLICATION OF ABC ANALYSIS FOR MATERIAL MANAGEMENT OF RESIDENTIAL BUILDING

APPLICATION OF ABC ANALYSIS FOR MATERIAL MANAGEMENT OF RESIDENTIAL BUILDING

  • 1.
    M.TECH. CONSTRUCTION ENGINEERING& MANAGEMENT RESOURCE MANAGEMENT (CM504) APPLICATION OF ABC ANALYSIS FOR MATERIAL MANAGEMENT OF RESIDENTIAL BUILDING PREPARED BY :- KAPTAN SAGAR R MTECH CONSTRUCTION ENGINEERING AND MANAGEMENT B.V.M ENGINEERING COLLEGE, VALLABH VIDHYANAGAR. GUIDED BY :- DR. JAYESHKUMAR PITRODA ASSISTANT PROFESSOR CIVIL ENGINEERING DEPARTMENT BVM ENGINEERING COLLEGE VALLABH VIDHYANAGAR BIRLA VISHWAKARMA MAHAVIDHAYALA GUJARAAT TECHNOLOGICAL UNIVERSITY
  • 3.
    CONTENT :  Introduction Aim of Material Management  Objectives of Material Management  Function of Material Management  Benefits of Material Management  ABC analysis  Project outline (case study)  Conclusion  References
  • 4.
    MATERIAL MANAGEMENT “Material managementis a scientific technique, concerned with planning, organizing & control of flow of materials, from their initial purchase to destination.
  • 5.
    Aim of MaterialManagement To get, 1. The Right quality 2. Right quantity of supplies 3. Right source 4. At the Right time 5. At the Right place 6. For the Right cost
  • 7.
    Objectives of materialmanagement  Effective material planning.  Low cost for procurement  Efficient storage and inventory control.  Continuity in supply and circulation of materials.  Quality assurance.  Good supplier relations.  Good information system. 1. Primary Objectives : If the contribution of the objectives is direct they are called as “primary objectives”. They are :
  • 8.
    Objectives of materialmanagement  Efficient production scheduling.  Decision to make or buy.  Prepare specification and standardisation of materials.  Predicting material demand and quantity.  Quality assurance of materials purchased.  Material handling.  Uninterrupted material flow. 2. Secondary Objectives : If the contribution of the objectives is indirect they are called as “secondary objectives”. They are :
  • 9.
    Function of materialmanagement 1. Materials planning and scheduling 2. Purchasing 3. Store keeping 4. Inventory planning 5. Receiving, warehousing and transportation 6. Salvage and disposal of scrap and surplus
  • 10.
    Benefits of MaterialManagement  Reduction in overall material budget.  Improved handling of material.  Material is obtained at the desired time and in the desired quantities.  Better project schedule.  Enhancement in labour productivity.  Healthier relation with suppliers.  Improved inventory control.  Improved usage of stores space.
  • 12.
    What is ABCanalysis? • ABC (Always Better Control) analysis is an inventory categorization method which consists in dividing items into three categories (A, B, C): – A being the most valuable items, – C being the least valuable ones. • This method aims to draw managers’ attention on the critical few (A-items) not on the trivial many (C-items).
  • 13.
    The ABC approachstates that a company should rate items from A to C, basing its ratings on the following rules: • A-items are goods which annual consumption value is the highest; the top 70-80% of the annual consumption value of the company typically accounts for only 10-20% of total inventory items. • B-items are the interclass items, with a medium consumption value; those 15-25% of annual consumption value typically accounts for 30% of total inventory items. • C-items are, on the contrary, items with the lowest consumption value; the lower 10-15% of the annual consumption value typically accounts for 50% of total inventory items.
  • 14.
    “A” ITEMS Small innumber, but consume large amount of resources must have : • Tight control • Rigid estimate of requirements • Strict & closer watch • Low safety stocks • Managed by top management
  • 15.
    “C” ITEMS Large innumber, but consume lesser amount of resources must have : • Ordinary control measures • Purchased based on usage estimates • High safety stocks
  • 16.
    “B” ITEMS Intermediate musthave : • Moderate control • Purchased based on rigid requirements • Reasonably strict watch & control • Moderate safety stocks • Managed by middle level management
  • 17.
    • The annualconsumption value is calculated with the formula: =(Annual demand) x (item cost per unit) • Through this categorization, the supply manager can identify inventory hot spots, and separate them from the rest of the items, especially those that are numerous but not that profitable. The ABC analysis
  • 18.
    The ABC analysis Graphrepresenting percentage of Items vs percentage of Total cost
  • 19.
    Steps for theClassification of Items 1. The unit cost and the demand of each item is obtained over a given period. 2. Multiply the unit cost by the calculated annual usage to obtain the net cost. 3. All the items are listed out and arranged in a descending annual cost. 4. Sum up the cost and add up the number of items then, compute percentage on the total inventory of total cost and for total number of items consumed. 5. Draw a graph of percentage items vs percentage cost. 6. Mark from the curve the rational limits of A, B and C categories.
  • 20.
    Project Outline (casestudy) • A live project is undertaken as a case study for this work with built-up area of 57,535.6 Sq. Ft. This is a multi- storied building constructed with the view of providing both commercial as well as residential accommodations to the customers. TOTAL CONSTRUCTION COST Rs- 7,25,40,469/- LAND COST Rs-7,00,00,000/- WATER AND TRANSPORTATION CHARGES IS 5% OF THE TOTAL COST Rs-71,27,023/- CONTRACTOR'S PROFIT IS 10% OF THE TOTAL COST Rs-1,49,66,750/- Table -1: Total Project Cost
  • 21.
    • According tothe estimate Rs.16,46,34,242 (Rupees Sixteen crores Forty Six lakhs Thirty Four thousand Two hundred and Forty Two) is the probable cost for constructing a built-up area of 57,535.6 Sq.ft. The rate for per Sq.ft of area is Rs. 2861.31. After plotting the graph for different items according to the “% of items” vs “% of total cost”, they are categorized according to their impact on total cost of materials. This categorization is shown in the tabulation.
  • 22.
    CATEGORY ITEMS %OF ITEMS % OF TOTAL COST ACTION CLASS A SAND, STEEL,FLOORING 20% 43% CLOSE CONTROL CLASS B BLOCKS, CEMENT, PAINTING, DOOR, BATHROOM FITTINGS 30% 37% REGULAR REVIEW CLASS C AGGREGATES, WINDOWS, FORMWORK, ELECTRICAL FITTINGS, GLASS RAILING, KITCHEN PLATFORMS 50% 20% INFREQUENT REVIEW
  • 24.
    The percentage ofdifferent items under Class A, Class B and Class C for their total percentage of items used is as represented in the pie chart below. Chart -2: Graph representing % of Items used . CLASS A 20% CLASS B 30% CLASS C 50% % of Items Used
  • 25.
    The impact ofitems in A, B and C category on the total material cost is highlighted by the pie chart shown below. CLASS A 43% CLASS B 37% CLASS C 20% % of Total cost Chart -3: Graph representing % of Total Cost.
  • 26.
    CONCLUSION • In constructionenvironment, an organization requires to maintain a balance between critical stocks-outs and reducing inventory costs. From this study, it is established that this analysis helps in managing the materials well for both raw material and for finished goods. It helps to understand the problem occurring in purchasing and safety stock. • From the results of ABC Analysis, we conclude that material management in construction of project is of high importance as the material cost contributes to 62.87% of the total construction cost of the project.
  • 27.
    CONCLUSION The ABC analysisshows that : i. Class A items contributes 43% of the total material cost. It is found sand, steel and flooring belong to this class. ii. Class B items contributes 37% of the total material cost. It is found blocks, cement, painting, doors and bathroom fittings belong to this class. iii. Class C items contributes 20% of the total material cost. It is found aggregates, windows, formwork, electrical fittings, glass railing, kitchen platform, pipes and pavers belong to this class. It shows that the categorization technique used for material management where accuracy and control increases from C to A.
  • 28.
    Based on ABCanalysis, the need for control, requirement, check and stocks of the items is as concluded in the table. Table-2: Level of Supervision for Material categorically. Particulars A- Class Items B- Class Items C- Class Items Control High Intermediate Low Requirement Low Intermediate High Check Tight Intermediate Low Safety stock High Low Rare
  • 29.
    REFERENCES : • 1.Handanhal Ravinder, Ram B. Misra, “ABC Analysis For Inventory Management: Bridging The Gap Between Research And Classroom” American Journal Of Business Education, Volume 7, Number 3, 2014. • 2. Aditya Pande, Syed. Sbihuddin “Material Management for Construction Site –A Review”, International Engineering Journal for Research & Development, Volume 1, Issue 5, 2014. • 3. Ashwini R. Patil, Smita V. Pataskar, “Analyzing Material Management Techniques on Construction Project”, International Journal of Engineering and Innovative Technology, Volume 3, Issue 4, October 2013. • 4. Dinesh Dhoka, Dr.Y.Lokeswara Choudary, “ABC Classification for Inventory Optimization”, IOSR Journal of Business and Management, Volume 15, Issue 1 (Nov. - Dec. 2013).
  • 30.
    • 5. T.Phani Madhavi, Steve Varghese Mathew, Roy Sasidharan, “Material Management in Construction – A Case Study”, International Journal of Research in Engineering and Technology, Nov-2013. • 6. Gulsen Aydin Keskin and CoskunOzkan, “Multiple Criteria ABC Analysis with FCM Clustering”, Journal of Industrial Engineering, 2013. • 7. Khyomesh V. Patel, Chetna M.Vyas, “Construction Materials Management on Project Sites”, National Conference on Recent Trends in Engineering & Technology, May 2011. • 8. N.B. Kasim, C.J. Anumba and A.R.J. Dainty, “Improving Materials Management Practices on Fast-track Construction Projects”, Association of Researchers in Construction Management, Vol. 2, September 2005. • 9. Materials Management-A Conceptual and Functional Framework. • 10. Chapter 1-Materials Management from Materials and Financial Management.