Downloaded 113 times

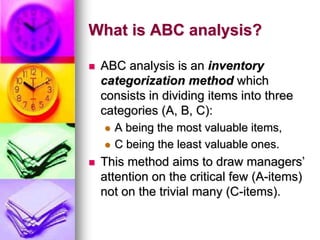
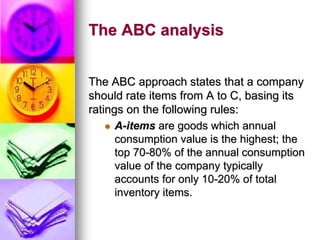

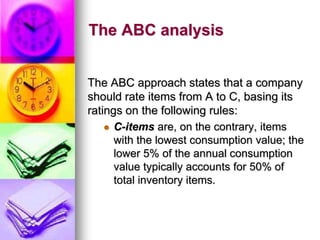
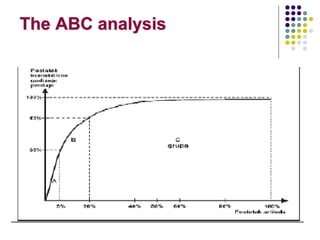
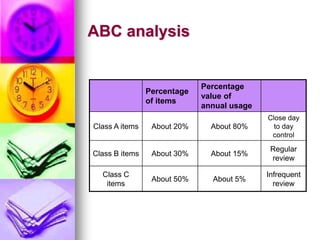
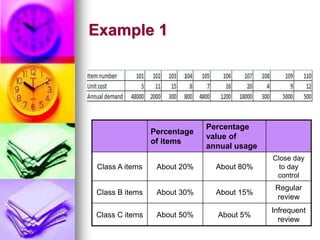
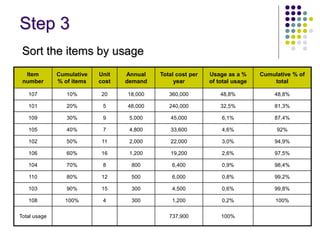
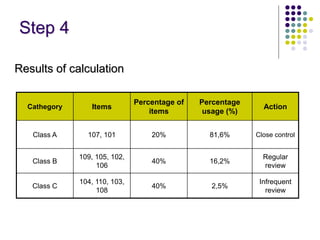
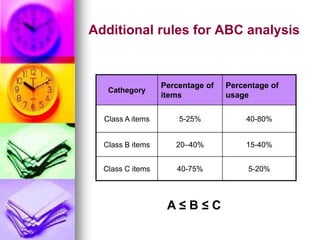
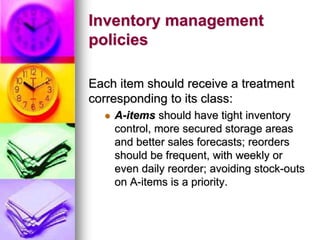
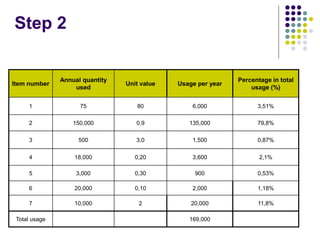
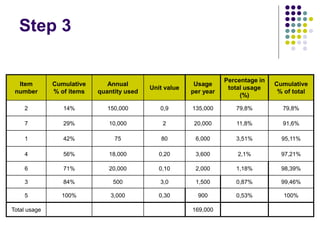
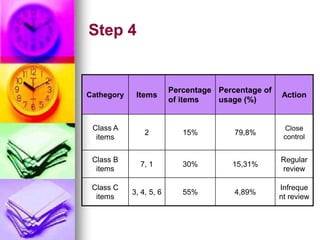

ABC analysis is an inventory categorization method that divides items into categories (A, B, C) based on their value to the company. Category A items account for the highest value though lowest in number, while Category C items are lowest in value but highest in number. The method aims to draw managers' attention to focus control of critical Category A items that make up the majority of costs, rather than trivial Category C items. Items are categorized based on their annual consumption value, with Category A typically being 10-20% of items but 70-80% of costs. Different inventory management policies are applied based on the category.


