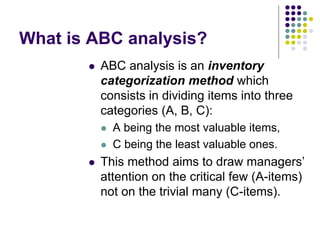
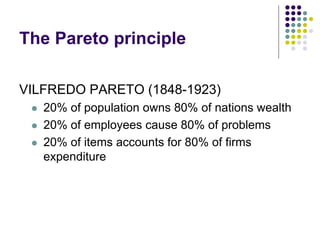
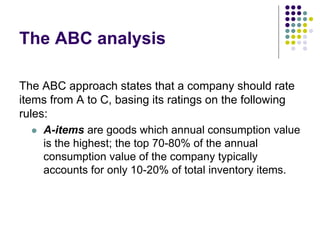
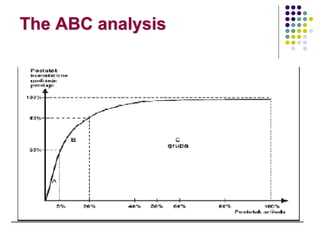
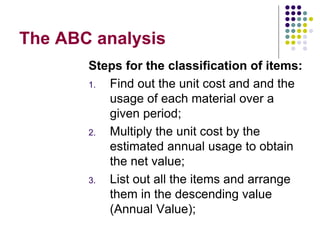
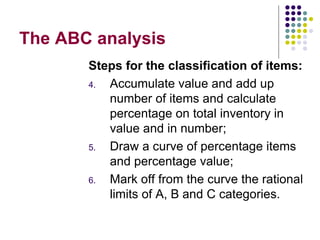
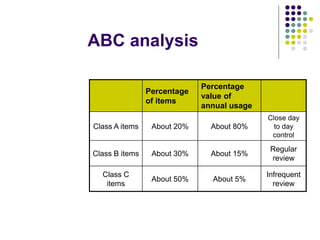
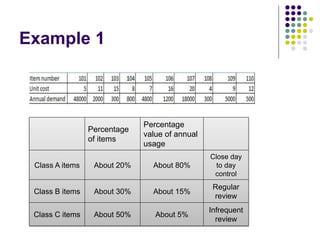
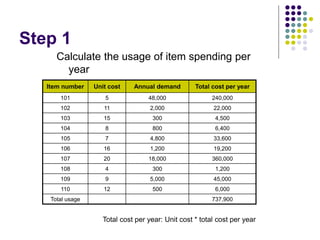
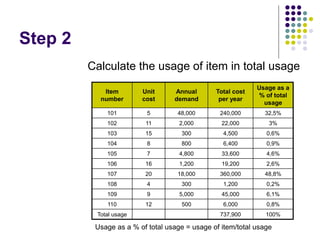
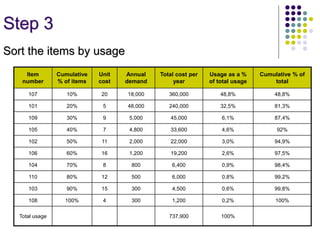
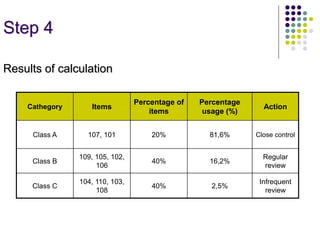
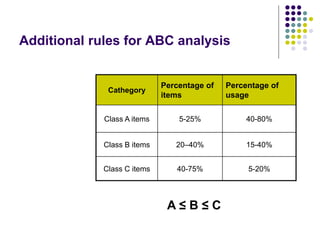
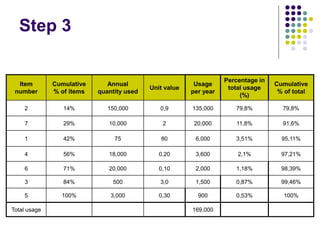
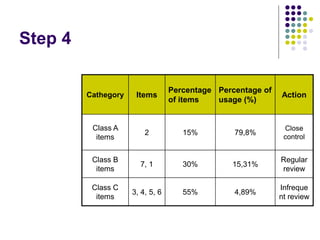
ABC ANALYSIS
What is ABC analysis?
 ABC analysis is an inventory
categorization method which
consists in dividing items into three
categories (A, B, C):
 A being the most valuable items,
 C being the least valuable ones.
 This method aims to draw managers’
attention on the critical few (A-items)
not on the trivial many (C-items).
The Pareto principle
VILFREDO PARETO (1848-1923)
 20% of population owns 80% of nations wealth
 20% of employees cause 80% of problems
 20% of items accounts for 80% of firms
expenditure
The ABC analysis
The ABC approach states that a company should rate
items from A to C, basing its ratings on the following
rules:
 A-items are goods which annual consumption value
is the highest; the top 70-80% of the annual
consumption value of the company typically
accounts for only 10-20% of total inventory items.
The ABC analysis
The ABC approach states that a company should rate
items from A to C, basing its ratings on the following
rules:
 B-items are the interclass items, with a medium
consumption value; those 15-25% of annual
consumption value typically accounts for 30% of
total inventory items.
The ABC analysis
The ABC approach states that a company
should rate items from A to C, basing its
ratings on the following rules:
 C-items are, on the contrary, items
with the lowest consumption value; the
lower 5% of the annual consumption
value typically accounts for 50% of
total inventory items.
The ABC analysis
The ABC analysis
 The annual consumption value is calculated with the
formula:
(Annual demand) x (item cost per unit)
 Through this categorization, the supply manager
can identify inventory hot spots, and separate them
from the rest of the items, especially those that are
numerous but not that profitable.
The ABC analysis
Steps for the classification of items:
1. Find out the unit cost and and the
usage of each material over a
given period;
2. Multiply the unit cost by the
estimated annual usage to obtain
the net value;
3. List out all the items and arrange
them in the descending value
(Annual Value);
The ABC analysis
Steps for the classification of items:
4. Accumulate value and add up
number of items and calculate
percentage on total inventory in
value and in number;
5. Draw a curve of percentage items
and percentage value;
6. Mark off from the curve the rational
limits of A, B and C categories.
ABC analysis
Percentage
of items
Percentage
value of
annual usage
Class A items About 20% About 80%
Close day
to day
control
Class B items About 30% About 15%
Regular
review
Class C
items
About 50% About 5%
Infrequent
review
Example 1
Percentage
of items
Percentage
value of annual
usage
Class A items About 20% About 80%
Close day
to day
control
Class B items About 30% About 15%
Regular
review
Class C items About 50% About 5%
Infrequent
review
Step 1
Calculate the usage of item spending per
year
Item number Unit cost Annual demand Total cost per year
101 5 48,000 240,000
102 11 2,000 22,000
103 15 300 4,500
104 8 800 6,400
105 7 4,800 33,600
106 16 1,200 19,200
107 20 18,000 360,000
108 4 300 1,200
109 9 5,000 45,000
110 12 500 6,000
Total usage 737,900
Total cost per year: Unit cost * total cost per year
Step 2
Calculate the usage of item in total usage
Item
number
Unit
cost
Annual
demand
Total cost
per year
Usage as a
% of total
usage
101 5 48,000 240,000 32,5%
102 11 2,000 22,000 3%
103 15 300 4,500 0,6%
104 8 800 6,400 0,9%
105 7 4,800 33,600 4,6%
106 16 1,200 19,200 2,6%
107 20 18,000 360,000 48,8%
108 4 300 1,200 0,2%
109 9 5,000 45,000 6,1%
110 12 500 6,000 0,8%
Total usage 737,900 100%
Usage as a % of total usage = usage of item/total usage
Step 3
Sort the items by usage
Item
number
Cumulative
% of items
Unit
cost
Annual
demand
Total cost per
year
Usage as a %
of total usage
Cumulative % of
total
107 10% 20 18,000 360,000 48,8% 48,8%
101 20% 5 48,000 240,000 32,5% 81,3%
109 30% 9 5,000 45,000 6,1% 87,4%
105 40% 7 4,800 33,600 4,6% 92%
102 50% 11 2,000 22,000 3,0% 94,9%
106 60% 16 1,200 19,200 2,6% 97,5%
104 70% 8 800 6,400 0,9% 98,4%
110 80% 12 500 6,000 0,8% 99,2%
103 90% 15 300 4,500 0,6% 99,8%
108 100% 4 300 1,200 0,2% 100%
Total usage 737,900 100%
Step 4
Results of calculation
Cathegory Items
Percentage of
items
Percentage
usage (%)
Action
Class A 107, 101 20% 81,6% Close control
Class B
109, 105, 102,
106
40% 16,2%
Regular
review
Class C
104, 110, 103,
108
40% 2,5%
Infrequent
review
Additional rules for ABC analysis
Cathegory
Percentage of
items
Percentage of
usage
Class A items 5-25% 40-80%
Class B items 20–40% 15-40%
Class C items 40-75% 5-20%
A ≤ B ≤ C
Inventory management
policies
Each item should receive a treatment
corresponding to its class:
 A-items should have tight inventory control, more
secured storage areas and better sales forecasts;
reorders should be frequent, with weekly or even
daily reorder; avoiding stock-outs on A-items is a
priority.
Inventory management
policies
Each item should receive a treatment
corresponding to its class:
 B-items benefit from an intermediate status
between A and C; an important aspect of class B is
the monitoring of potential evolution toward class A
or, in the contrary, toward the class C.
Inventory management
policies
Each item should receive a treatment
corresponding to its class:
 Reordering C-items is made less frequently; a
typically inventory policy for C-items consist of
having only 1 unit on hand, and of reordering only
when an actual purchase is made; this approach
leads to stock-out situation after each purchase
which can be an acceptable situation, as the C-
items present both low demand and higher risk of
excessive inventory costs.
Procurement and Warehouse
Applications
The results of an ABC Analysis extend into a number
of other inventory control and management processes:
 Review of stocking levels: “A” items will generally have
greater impact on projected investment and purchasing
spend, and therefore should be managed more
aggressively in terms of minimum and maximum inventory
levels; inactive items will fall to the bottom of the prioritized
list; the bottom of the “C” category is the best place to start
when performing a periodic obsolescence review.
Procurement and Warehouse
Applications
The results of an ABC Analysis extend into a number
of other inventory control and management processes:
 Cycle counting: the higher the usage, the more
activity an item is likely to have; to ensure
accurate record balances, higher priority items are
cycle counted more frequently; “A” items are
counted once every quarter; “B” items once every
6 months; and “C” items once every 12 months.
Procurement and Warehouse
Applications
The results of an ABC Analysis extend into a number
of other inventory control and management processes:
 Identifying items for potential consignment or
vendor stocking: since “A” items tend to have a
greater impact on investment, these would be the
best candidates to investigate the potential for
alternative stocking arrangements that would
reduce investment liability and associated
carrying costs.
Procurement and Warehouse
Applications
The results of an ABC Analysis extend into a number
of other inventory control and management processes:
 Turnover ratios and associated inventory
goals: “A” items will have greater usage than “B”
or “C” items, and as a result should have greater
turnover ratios; when establishing investment and
turnover metrics, inventory data can be
segregated by ABC classification, with different
targets for each category.
Example 2
Item number Annual quantity used Unit value
1 75 80
2 150,000 0,9
3 500 3,0
4 18,000 0,20
5 3,000 0,30
6 20,000 0,10
7 10,000 2
Step 1
Item
number
Annual quantity
used
Unit value Usage per year
1 75 80 6,000
2 150,000 0,9 135,000
3 500 3,0 1,500
4 18,000 0,20 3,600
5 3,000 0,30 900
6 20,000 0,10 2,000
7 10,000 2 20,000
Total usage 169,000
Step 2
Item number
Annual quantity
used
Unit value Usage per year
Percentage in total
usage (%)
1 75 80 6,000 3,51%
2 150,000 0,9 135,000 79,8%
3 500 3,0 1,500 0,87%
4 18,000 0,20 3,600 2,1%
5 3,000 0,30 900 0,53%
6 20,000 0,10 2,000 1,18%
7 10,000 2 20,000 11,8%
Total usage 169,000
Step 3
Item
number
Cumulative
% of items
Annual
quantity used
Unit value
Usage
per year
Percentage in
total usage
(%)
Cumulative
% of total
2 14% 150,000 0,9 135,000 79,8% 79,8%
7 29% 10,000 2 20,000 11,8% 91,6%
1 42% 75 80 6,000 3,51% 95,11%
4 56% 18,000 0,20 3,600 2,1% 97,21%
6 71% 20,000 0,10 2,000 1,18% 98,39%
3 84% 500 3,0 1,500 0,87% 99,46%
5 100% 3,000 0,30 900 0,53% 100%
Total usage 169,000
Step 4
Cathegory Items
Percentage
of items
Percentage of
usage (%)
Action
Class A
items
2 15% 79,8%
Close
control
Class B
items
7, 1 30% 15,31%
Regular
review
Class C
items
3, 4, 5, 6 55% 4,89%
Infreque
nt review
Conclusion
 The boundary between class A and class B might
not be as sharply defined;
 The purpose of this classification is to ensure that
purchasing staff use resources to maximum
efficiency by concentrating on those items that have
the greatest potential savings → selective control
will be more effective than an approach that treats
all items identically.
Thank you

Abc analysis

  • 1.
  • 2.
    What is ABCanalysis?  ABC analysis is an inventory categorization method which consists in dividing items into three categories (A, B, C):  A being the most valuable items,  C being the least valuable ones.  This method aims to draw managers’ attention on the critical few (A-items) not on the trivial many (C-items).
  • 3.
    The Pareto principle VILFREDOPARETO (1848-1923)  20% of population owns 80% of nations wealth  20% of employees cause 80% of problems  20% of items accounts for 80% of firms expenditure
  • 4.
    The ABC analysis TheABC approach states that a company should rate items from A to C, basing its ratings on the following rules:  A-items are goods which annual consumption value is the highest; the top 70-80% of the annual consumption value of the company typically accounts for only 10-20% of total inventory items.
  • 5.
    The ABC analysis TheABC approach states that a company should rate items from A to C, basing its ratings on the following rules:  B-items are the interclass items, with a medium consumption value; those 15-25% of annual consumption value typically accounts for 30% of total inventory items.
  • 6.
    The ABC analysis TheABC approach states that a company should rate items from A to C, basing its ratings on the following rules:  C-items are, on the contrary, items with the lowest consumption value; the lower 5% of the annual consumption value typically accounts for 50% of total inventory items.
  • 7.
  • 8.
    The ABC analysis The annual consumption value is calculated with the formula: (Annual demand) x (item cost per unit)  Through this categorization, the supply manager can identify inventory hot spots, and separate them from the rest of the items, especially those that are numerous but not that profitable.
  • 9.
    The ABC analysis Stepsfor the classification of items: 1. Find out the unit cost and and the usage of each material over a given period; 2. Multiply the unit cost by the estimated annual usage to obtain the net value; 3. List out all the items and arrange them in the descending value (Annual Value);
  • 10.
    The ABC analysis Stepsfor the classification of items: 4. Accumulate value and add up number of items and calculate percentage on total inventory in value and in number; 5. Draw a curve of percentage items and percentage value; 6. Mark off from the curve the rational limits of A, B and C categories.
  • 11.
    ABC analysis Percentage of items Percentage valueof annual usage Class A items About 20% About 80% Close day to day control Class B items About 30% About 15% Regular review Class C items About 50% About 5% Infrequent review
  • 12.
    Example 1 Percentage of items Percentage valueof annual usage Class A items About 20% About 80% Close day to day control Class B items About 30% About 15% Regular review Class C items About 50% About 5% Infrequent review
  • 13.
    Step 1 Calculate theusage of item spending per year Item number Unit cost Annual demand Total cost per year 101 5 48,000 240,000 102 11 2,000 22,000 103 15 300 4,500 104 8 800 6,400 105 7 4,800 33,600 106 16 1,200 19,200 107 20 18,000 360,000 108 4 300 1,200 109 9 5,000 45,000 110 12 500 6,000 Total usage 737,900 Total cost per year: Unit cost * total cost per year
  • 14.
    Step 2 Calculate theusage of item in total usage Item number Unit cost Annual demand Total cost per year Usage as a % of total usage 101 5 48,000 240,000 32,5% 102 11 2,000 22,000 3% 103 15 300 4,500 0,6% 104 8 800 6,400 0,9% 105 7 4,800 33,600 4,6% 106 16 1,200 19,200 2,6% 107 20 18,000 360,000 48,8% 108 4 300 1,200 0,2% 109 9 5,000 45,000 6,1% 110 12 500 6,000 0,8% Total usage 737,900 100% Usage as a % of total usage = usage of item/total usage
  • 15.
    Step 3 Sort theitems by usage Item number Cumulative % of items Unit cost Annual demand Total cost per year Usage as a % of total usage Cumulative % of total 107 10% 20 18,000 360,000 48,8% 48,8% 101 20% 5 48,000 240,000 32,5% 81,3% 109 30% 9 5,000 45,000 6,1% 87,4% 105 40% 7 4,800 33,600 4,6% 92% 102 50% 11 2,000 22,000 3,0% 94,9% 106 60% 16 1,200 19,200 2,6% 97,5% 104 70% 8 800 6,400 0,9% 98,4% 110 80% 12 500 6,000 0,8% 99,2% 103 90% 15 300 4,500 0,6% 99,8% 108 100% 4 300 1,200 0,2% 100% Total usage 737,900 100%
  • 16.
    Step 4 Results ofcalculation Cathegory Items Percentage of items Percentage usage (%) Action Class A 107, 101 20% 81,6% Close control Class B 109, 105, 102, 106 40% 16,2% Regular review Class C 104, 110, 103, 108 40% 2,5% Infrequent review
  • 17.
    Additional rules forABC analysis Cathegory Percentage of items Percentage of usage Class A items 5-25% 40-80% Class B items 20–40% 15-40% Class C items 40-75% 5-20% A ≤ B ≤ C
  • 18.
    Inventory management policies Each itemshould receive a treatment corresponding to its class:  A-items should have tight inventory control, more secured storage areas and better sales forecasts; reorders should be frequent, with weekly or even daily reorder; avoiding stock-outs on A-items is a priority.
  • 19.
    Inventory management policies Each itemshould receive a treatment corresponding to its class:  B-items benefit from an intermediate status between A and C; an important aspect of class B is the monitoring of potential evolution toward class A or, in the contrary, toward the class C.
  • 20.
    Inventory management policies Each itemshould receive a treatment corresponding to its class:  Reordering C-items is made less frequently; a typically inventory policy for C-items consist of having only 1 unit on hand, and of reordering only when an actual purchase is made; this approach leads to stock-out situation after each purchase which can be an acceptable situation, as the C- items present both low demand and higher risk of excessive inventory costs.
  • 21.
    Procurement and Warehouse Applications Theresults of an ABC Analysis extend into a number of other inventory control and management processes:  Review of stocking levels: “A” items will generally have greater impact on projected investment and purchasing spend, and therefore should be managed more aggressively in terms of minimum and maximum inventory levels; inactive items will fall to the bottom of the prioritized list; the bottom of the “C” category is the best place to start when performing a periodic obsolescence review.
  • 22.
    Procurement and Warehouse Applications Theresults of an ABC Analysis extend into a number of other inventory control and management processes:  Cycle counting: the higher the usage, the more activity an item is likely to have; to ensure accurate record balances, higher priority items are cycle counted more frequently; “A” items are counted once every quarter; “B” items once every 6 months; and “C” items once every 12 months.
  • 23.
    Procurement and Warehouse Applications Theresults of an ABC Analysis extend into a number of other inventory control and management processes:  Identifying items for potential consignment or vendor stocking: since “A” items tend to have a greater impact on investment, these would be the best candidates to investigate the potential for alternative stocking arrangements that would reduce investment liability and associated carrying costs.
  • 24.
    Procurement and Warehouse Applications Theresults of an ABC Analysis extend into a number of other inventory control and management processes:  Turnover ratios and associated inventory goals: “A” items will have greater usage than “B” or “C” items, and as a result should have greater turnover ratios; when establishing investment and turnover metrics, inventory data can be segregated by ABC classification, with different targets for each category.
  • 25.
    Example 2 Item numberAnnual quantity used Unit value 1 75 80 2 150,000 0,9 3 500 3,0 4 18,000 0,20 5 3,000 0,30 6 20,000 0,10 7 10,000 2
  • 26.
    Step 1 Item number Annual quantity used Unitvalue Usage per year 1 75 80 6,000 2 150,000 0,9 135,000 3 500 3,0 1,500 4 18,000 0,20 3,600 5 3,000 0,30 900 6 20,000 0,10 2,000 7 10,000 2 20,000 Total usage 169,000
  • 27.
    Step 2 Item number Annualquantity used Unit value Usage per year Percentage in total usage (%) 1 75 80 6,000 3,51% 2 150,000 0,9 135,000 79,8% 3 500 3,0 1,500 0,87% 4 18,000 0,20 3,600 2,1% 5 3,000 0,30 900 0,53% 6 20,000 0,10 2,000 1,18% 7 10,000 2 20,000 11,8% Total usage 169,000
  • 28.
    Step 3 Item number Cumulative % ofitems Annual quantity used Unit value Usage per year Percentage in total usage (%) Cumulative % of total 2 14% 150,000 0,9 135,000 79,8% 79,8% 7 29% 10,000 2 20,000 11,8% 91,6% 1 42% 75 80 6,000 3,51% 95,11% 4 56% 18,000 0,20 3,600 2,1% 97,21% 6 71% 20,000 0,10 2,000 1,18% 98,39% 3 84% 500 3,0 1,500 0,87% 99,46% 5 100% 3,000 0,30 900 0,53% 100% Total usage 169,000
  • 29.
    Step 4 Cathegory Items Percentage ofitems Percentage of usage (%) Action Class A items 2 15% 79,8% Close control Class B items 7, 1 30% 15,31% Regular review Class C items 3, 4, 5, 6 55% 4,89% Infreque nt review
  • 30.
    Conclusion  The boundarybetween class A and class B might not be as sharply defined;  The purpose of this classification is to ensure that purchasing staff use resources to maximum efficiency by concentrating on those items that have the greatest potential savings → selective control will be more effective than an approach that treats all items identically.
  • 31.