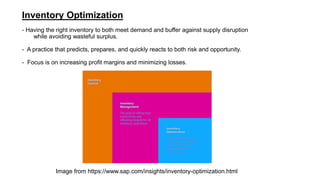
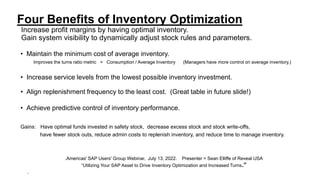
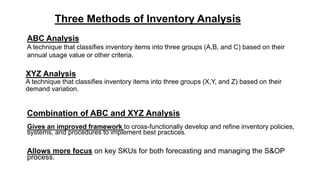
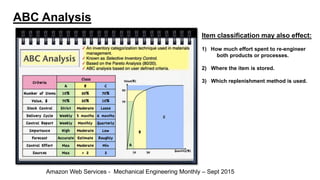
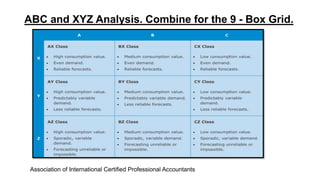
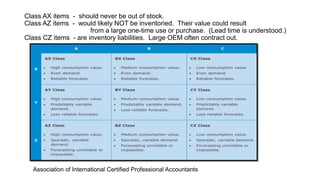
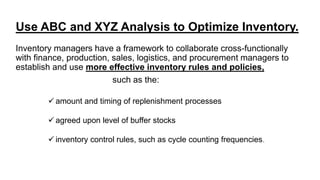
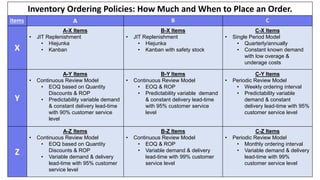
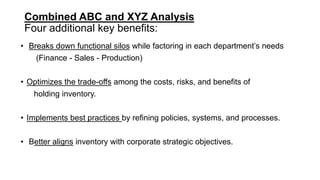
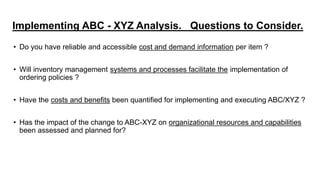
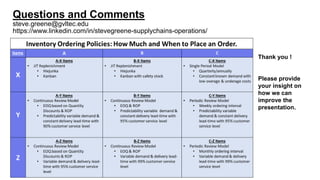
Optimize Your Inventory Using
ABC-XYZ Analysis.
Steve Greene CSCP, CLTD, CPIM, IDP
Project Manager, Greenville Technical College, Greenville, SC
https://www.linkedin.com/in/stevegreene-supplychains-operations/
Special Guest Presenter on Inventory Replenishment
Dr. Zachary Leffakis, PhD
Senior Lecturer in Operations Management, Clemson University
https://www.clemson.edu/business/about/profiles/ZLEFFAK
ASCM Brandywine Valley Chapter November 8, 2022
Inventory Optimization
- Having the right inventory to both meet demand and buffer against supply disruption
while avoiding wasteful surplus.
- A practice that predicts, prepares, and quickly reacts to both risk and opportunity.
- Focus is on increasing profit margins and minimizing losses.
Image from https://www.sap.com/insights/inventory-optimization.html
Four Benefits of Inventory Optimization
Increase profit margins by having optimal inventory.
Gain system visibility to dynamically adjust stock rules and parameters.
• Maintain the minimum cost of average inventory.
Improves the turns ratio metric = Consumption / Average Inventory (Managers have more control on average inventory.)
• Increase service levels from the lowest possible inventory investment.
• Align replenishment frequency to the least cost. (Great table in future slide!)
• Achieve predictive control of inventory performance.
Gains: Have optimal funds invested in safety stock, decrease excess stock and stock write-offs,
have fewer stock outs, reduce admin costs to replenish inventory, and reduce time to manage inventory.
.Americas' SAP Users' Group Webinar. July 13, 2022. Presenter = Sean Elliffe of Reveal USA
“Utilizing Your SAP Asset to Drive Inventory Optimization and Increased Turns.”
.
XYZ Analysis
A technique that classifies inventory items into three groups (X,Y, and Z) based on their
demand variation.
Combination of ABC and XYZ Analysis
Gives an improved framework to cross-functionally develop and refine inventory policies,
systems, and procedures to implement best practices.
Allows more focus on key SKUs for both forecasting and managing the S&OP
process.
Three Methods of Inventory Analysis
ABC Analysis
A technique that classifies inventory items into three groups (A,B, and C) based on their
annual usage value or other criteria.
ABC Analysis
Amazon Web Services - Mechanical Engineering Monthly – Sept 2015
Item classification may also effect:
1) How much effort spent to re-engineer
both products or processes.
2) Where the item is stored.
3) Which replenishment method is used.
Audience Question - ABC Analysis
Is it accurate to classify a high-priced item that is sold
infrequently as a Class A item?
Corvette Camaro Spark
Benefits of Using ABC Analysis
• Determines appropriate inventory rules and processes for each stocked item.
• Allows better control over high-value, Class A inventory - improves stock
availability, reduces production losses, and lowers operation costs.
• Helps avoid stock-outs of the high-valued Class A items.
• Saves time, effort, and money by applying looser controls to Class C items.
ABC item value is based on annual usage value – cumulative.
(# of units sold) X (price per unit)
The Chevy Spark may have a Class A. And the ‘Vette has a Class C.
Or user defined criteria.
Other User Defined Criteria to Fine-tune Annual Usage Value.
Allows for classification flexibility. Partial list and no specific order.
• Cost of Goods Sold (annual turn-over)
• Importance to an Internal Process (keep production going)
• Impact on Length of Production Lead Time
• Number of Suppliers Available
• Risk of Supplier Stock-outs or More Replenishment Delays
• Product Quality Requirements
• Length of Item Shelf Life
• Customer Importance - Service Level Requirements
• Relation to Other Items - BOM
• Position in the Product Life Cycle
Five ABC Classification Steps (Annual Dollar Usage)
• Find cumulative dollar usage - multiply (unit use over time) by (unit cost).
• Rank products by annual dollar usage (highest to lowest).
• Calculate cumulative percentage of total items.
• Calculate cumulative percentage of annual dollar usage.
• Assign A, B, and C classifications based on step 4 (A: 50%–70% of
value; B: 20%; C: 10%–30%*).
•Item number
•Annual dollar usage
•Cumulative dollar usage
•Cumulative percent dollar usage
•Cumulative percent of items
•Class
Step 1 and 2 Step 3 and 4
•Item number
•Annual dollar usage
•Cumulative dollar usage
•Cumulative percent dollar usage
•Cumulative percent of items
•Class
Step 5 – Assign ABC Classification Based on Step 4
Insights of ABC Analysis
• Gives a better understanding of where to place an item in its product life cycle to
determine the correct levels of safety stock.
• If Class A items are replenished frequently, you can reduce safety stock costs.
• Item location to faster fulfill service requirements.
A company that provides Just-In-Time delivery may locate a distribution center that is
close to their larger customers. And should there mostly stock Class A and some
Class B items that are “super-movers”.
ABC Analysis Has Its Drawbacks
(Death by PowerPoint slide.)
ABC analysis does not factor in demand variation.
Two items with the same high usage value, but with very different demand patterns,
may be subject to the same inventory policies and processes. Which may not be appropriate.
ABC analysis limitations:
• Need to decide what other criteria to use to fine-tune an item’s value.
• What is the best way to classify a new product that will soon be launched?
• If a company has a global distribution network, each node could have its own ABC
classification. There may be different ABC classes for the same item in the same
company.
• In a dynamic market, product sales can be erratic so items could move quickly between
the ABC classes.
Audience Question - How often should you change ABC classifications?
Slide with little text. Hooray !
ABC Analysis Change Frequency. Not monthly.
• Once a manager makes an ABC value change in an ERP, it takes time for purchase orders
and production orders to cycle through before the impacts of the change are realized.
• Changes to ABC classes may impact service level agreements.
If a company changes item classes every month, it could be a difficult task to
manage both staff and customer expectations.
• It can be chaotic to change both cycle and safety stock amounts every month.
Best Every 2 - 3 months?
XYZ Analysis
A framework that classifies inventory items into three groups (X, Y, and Z)
based on their amount of demand variation and how much the actual use
deviates from their forecasts.
• X items (green) – customer orders are frequent, perhaps daily.
Demand variation is low. Demand is forecastable.
• Y items (blue) – customer orders are less frequent,
perhaps every few weeks.
Demand varies more. And it is harder to forecast.
• Z items (red) - orders are infrequent or sporadic.
Has the most demand variation and most difficult to forecast.
How Do You Determine Demand Variation?
Measured by the coefficient of variation – C. of V.
Standard deviation divided by the mean - of the demand data set.
The larger the coefficient of variation, the more erratic the demand.
• C. of V. ≤ 0.10 then a Class X item (green cells)
• 0.10 ≤ C. of V. ≤ .25 then a Class Y item (orange cells)
• C. of V. ≥ .25 then Class Z item (red cells)
Note: C. of V. value can vary: ( .25, . . .33, . . .50 . .)
Benefits of Using XYZ Analysis
• Improves forecasting accuracy.
• Reduces risk of stock-outs.
• Increases stock turn-over. Reduces stock costs and obsolescence.
• Clarifies service levels for items with volatile demand.
ABC and XYZ Analysis. Combine for the 9 - Box Grid.
Association of International Certified Professional Accountants
Class AX items - should never be out of stock.
Class AZ items - would likely NOT be inventoried. Their value could result
from a large one-time use or purchase. (Lead time is understood.)
Class CZ items - are inventory liabilities. Large OEM often contract out.
Association of International Certified Professional Accountants
Use ABC and XYZ Analysis to Optimize Inventory.
Inventory managers have a framework to collaborate cross-functionally
with finance, production, sales, logistics, and procurement managers to
establish and use more effective inventory rules and policies,
such as the:
 amount and timing of replenishment processes
 agreed upon level of buffer stocks
 inventory control rules, such as cycle counting frequencies.
Inventory Ordering Policies: How Much and When to Place an Order.
Items A B C
X
A-X Items
• JIT Replenishment
• Hiejunka
• Kanban
B-X Items
• JIT Replenishment
• Hiejunka
• Kanban with safety stock
C-X Items
• Single Period Model
• Quarterly/annually
• Constant known demand
with low overage &
underage costs
Y
A-Y Items
• Continuous Review Model
• EOQ based on Quantity
Discounts & ROP
• Predictability variable demand
& constant delivery lead-time
with 90% customer service
level
B-Y Items
• Continuous Review Model
• EOQ & ROP
• Predictability variable demand
& constant delivery lead-time
with 95% customer service
level
C-Y Items
• Periodic Review Model
• Weekly ordering interval
• Predictability variable
demand & constant
delivery lead-time with 95%
customer service level
Z
A-Z Items
• Continuous Review Model
• EOQ based on Quantity
Discounts & ROP
• Variable demand & delivery
lead-time with 95% customer
service level
B-Z Items
• Continuous Review Model
• EOQ & ROP
• Variable demand & delivery
lead-time with 99% customer
service level
C-Z Items
• Periodic Review Model
• Monthly ordering interval
• Variable demand & delivery
lead-time with 99%
customer service level
Combined ABC and XYZ Analysis
Four additional key benefits:
• Breaks down functional silos while factoring in each department’s needs
(Finance - Sales - Production)
• Optimizes the trade-offs among the costs, risks, and benefits of
holding inventory.
• Implements best practices by refining policies, systems, and processes.
• Better aligns inventory with corporate strategic objectives.
Implementing ABC - XYZ Analysis. Questions to Consider.
• Do you have reliable and accessible cost and demand information per item ?
• Will inventory management systems and processes facilitate the implementation of
ordering policies ?
• Have the costs and benefits been quantified for implementing and executing ABC/XYZ ?
• Has the impact of the change to ABC-XYZ on organizational resources and capabilities
been assessed and planned for?
Questions and Comments
steve.greene@gvltec.edu
https://www.linkedin.com/in/stevegreene-supplychains-operations/
Thank you !
Please provide
your insight on
how we can
improve the
presentation.

Inventory Optimization Using ABC-XYZ Analysis

  • 1.
    Optimize Your InventoryUsing ABC-XYZ Analysis. Steve Greene CSCP, CLTD, CPIM, IDP Project Manager, Greenville Technical College, Greenville, SC https://www.linkedin.com/in/stevegreene-supplychains-operations/ Special Guest Presenter on Inventory Replenishment Dr. Zachary Leffakis, PhD Senior Lecturer in Operations Management, Clemson University https://www.clemson.edu/business/about/profiles/ZLEFFAK ASCM Brandywine Valley Chapter November 8, 2022
  • 2.
    Inventory Optimization - Havingthe right inventory to both meet demand and buffer against supply disruption while avoiding wasteful surplus. - A practice that predicts, prepares, and quickly reacts to both risk and opportunity. - Focus is on increasing profit margins and minimizing losses. Image from https://www.sap.com/insights/inventory-optimization.html
  • 3.
    Four Benefits ofInventory Optimization Increase profit margins by having optimal inventory. Gain system visibility to dynamically adjust stock rules and parameters. • Maintain the minimum cost of average inventory. Improves the turns ratio metric = Consumption / Average Inventory (Managers have more control on average inventory.) • Increase service levels from the lowest possible inventory investment. • Align replenishment frequency to the least cost. (Great table in future slide!) • Achieve predictive control of inventory performance. Gains: Have optimal funds invested in safety stock, decrease excess stock and stock write-offs, have fewer stock outs, reduce admin costs to replenish inventory, and reduce time to manage inventory. .Americas' SAP Users' Group Webinar. July 13, 2022. Presenter = Sean Elliffe of Reveal USA “Utilizing Your SAP Asset to Drive Inventory Optimization and Increased Turns.” .
  • 4.
    XYZ Analysis A techniquethat classifies inventory items into three groups (X,Y, and Z) based on their demand variation. Combination of ABC and XYZ Analysis Gives an improved framework to cross-functionally develop and refine inventory policies, systems, and procedures to implement best practices. Allows more focus on key SKUs for both forecasting and managing the S&OP process. Three Methods of Inventory Analysis ABC Analysis A technique that classifies inventory items into three groups (A,B, and C) based on their annual usage value or other criteria.
  • 5.
    ABC Analysis Amazon WebServices - Mechanical Engineering Monthly – Sept 2015 Item classification may also effect: 1) How much effort spent to re-engineer both products or processes. 2) Where the item is stored. 3) Which replenishment method is used.
  • 6.
    Audience Question -ABC Analysis Is it accurate to classify a high-priced item that is sold infrequently as a Class A item? Corvette Camaro Spark
  • 7.
    Benefits of UsingABC Analysis • Determines appropriate inventory rules and processes for each stocked item. • Allows better control over high-value, Class A inventory - improves stock availability, reduces production losses, and lowers operation costs. • Helps avoid stock-outs of the high-valued Class A items. • Saves time, effort, and money by applying looser controls to Class C items. ABC item value is based on annual usage value – cumulative. (# of units sold) X (price per unit) The Chevy Spark may have a Class A. And the ‘Vette has a Class C. Or user defined criteria.
  • 8.
    Other User DefinedCriteria to Fine-tune Annual Usage Value. Allows for classification flexibility. Partial list and no specific order. • Cost of Goods Sold (annual turn-over) • Importance to an Internal Process (keep production going) • Impact on Length of Production Lead Time • Number of Suppliers Available • Risk of Supplier Stock-outs or More Replenishment Delays • Product Quality Requirements • Length of Item Shelf Life • Customer Importance - Service Level Requirements • Relation to Other Items - BOM • Position in the Product Life Cycle
  • 9.
    Five ABC ClassificationSteps (Annual Dollar Usage) • Find cumulative dollar usage - multiply (unit use over time) by (unit cost). • Rank products by annual dollar usage (highest to lowest). • Calculate cumulative percentage of total items. • Calculate cumulative percentage of annual dollar usage. • Assign A, B, and C classifications based on step 4 (A: 50%–70% of value; B: 20%; C: 10%–30%*).
  • 10.
    •Item number •Annual dollarusage •Cumulative dollar usage •Cumulative percent dollar usage •Cumulative percent of items •Class Step 1 and 2 Step 3 and 4
  • 11.
    •Item number •Annual dollarusage •Cumulative dollar usage •Cumulative percent dollar usage •Cumulative percent of items •Class Step 5 – Assign ABC Classification Based on Step 4
  • 12.
    Insights of ABCAnalysis • Gives a better understanding of where to place an item in its product life cycle to determine the correct levels of safety stock. • If Class A items are replenished frequently, you can reduce safety stock costs. • Item location to faster fulfill service requirements. A company that provides Just-In-Time delivery may locate a distribution center that is close to their larger customers. And should there mostly stock Class A and some Class B items that are “super-movers”.
  • 13.
    ABC Analysis HasIts Drawbacks (Death by PowerPoint slide.) ABC analysis does not factor in demand variation. Two items with the same high usage value, but with very different demand patterns, may be subject to the same inventory policies and processes. Which may not be appropriate. ABC analysis limitations: • Need to decide what other criteria to use to fine-tune an item’s value. • What is the best way to classify a new product that will soon be launched? • If a company has a global distribution network, each node could have its own ABC classification. There may be different ABC classes for the same item in the same company. • In a dynamic market, product sales can be erratic so items could move quickly between the ABC classes. Audience Question - How often should you change ABC classifications?
  • 14.
    Slide with littletext. Hooray !
  • 15.
    ABC Analysis ChangeFrequency. Not monthly. • Once a manager makes an ABC value change in an ERP, it takes time for purchase orders and production orders to cycle through before the impacts of the change are realized. • Changes to ABC classes may impact service level agreements. If a company changes item classes every month, it could be a difficult task to manage both staff and customer expectations. • It can be chaotic to change both cycle and safety stock amounts every month. Best Every 2 - 3 months?
  • 16.
    XYZ Analysis A frameworkthat classifies inventory items into three groups (X, Y, and Z) based on their amount of demand variation and how much the actual use deviates from their forecasts. • X items (green) – customer orders are frequent, perhaps daily. Demand variation is low. Demand is forecastable. • Y items (blue) – customer orders are less frequent, perhaps every few weeks. Demand varies more. And it is harder to forecast. • Z items (red) - orders are infrequent or sporadic. Has the most demand variation and most difficult to forecast.
  • 17.
    How Do YouDetermine Demand Variation? Measured by the coefficient of variation – C. of V. Standard deviation divided by the mean - of the demand data set. The larger the coefficient of variation, the more erratic the demand. • C. of V. ≤ 0.10 then a Class X item (green cells) • 0.10 ≤ C. of V. ≤ .25 then a Class Y item (orange cells) • C. of V. ≥ .25 then Class Z item (red cells) Note: C. of V. value can vary: ( .25, . . .33, . . .50 . .)
  • 18.
    Benefits of UsingXYZ Analysis • Improves forecasting accuracy. • Reduces risk of stock-outs. • Increases stock turn-over. Reduces stock costs and obsolescence. • Clarifies service levels for items with volatile demand.
  • 19.
    ABC and XYZAnalysis. Combine for the 9 - Box Grid. Association of International Certified Professional Accountants
  • 20.
    Class AX items- should never be out of stock. Class AZ items - would likely NOT be inventoried. Their value could result from a large one-time use or purchase. (Lead time is understood.) Class CZ items - are inventory liabilities. Large OEM often contract out. Association of International Certified Professional Accountants
  • 21.
    Use ABC andXYZ Analysis to Optimize Inventory. Inventory managers have a framework to collaborate cross-functionally with finance, production, sales, logistics, and procurement managers to establish and use more effective inventory rules and policies, such as the:  amount and timing of replenishment processes  agreed upon level of buffer stocks  inventory control rules, such as cycle counting frequencies.
  • 22.
    Inventory Ordering Policies:How Much and When to Place an Order. Items A B C X A-X Items • JIT Replenishment • Hiejunka • Kanban B-X Items • JIT Replenishment • Hiejunka • Kanban with safety stock C-X Items • Single Period Model • Quarterly/annually • Constant known demand with low overage & underage costs Y A-Y Items • Continuous Review Model • EOQ based on Quantity Discounts & ROP • Predictability variable demand & constant delivery lead-time with 90% customer service level B-Y Items • Continuous Review Model • EOQ & ROP • Predictability variable demand & constant delivery lead-time with 95% customer service level C-Y Items • Periodic Review Model • Weekly ordering interval • Predictability variable demand & constant delivery lead-time with 95% customer service level Z A-Z Items • Continuous Review Model • EOQ based on Quantity Discounts & ROP • Variable demand & delivery lead-time with 95% customer service level B-Z Items • Continuous Review Model • EOQ & ROP • Variable demand & delivery lead-time with 99% customer service level C-Z Items • Periodic Review Model • Monthly ordering interval • Variable demand & delivery lead-time with 99% customer service level
  • 23.
    Combined ABC andXYZ Analysis Four additional key benefits: • Breaks down functional silos while factoring in each department’s needs (Finance - Sales - Production) • Optimizes the trade-offs among the costs, risks, and benefits of holding inventory. • Implements best practices by refining policies, systems, and processes. • Better aligns inventory with corporate strategic objectives.
  • 24.
    Implementing ABC -XYZ Analysis. Questions to Consider. • Do you have reliable and accessible cost and demand information per item ? • Will inventory management systems and processes facilitate the implementation of ordering policies ? • Have the costs and benefits been quantified for implementing and executing ABC/XYZ ? • Has the impact of the change to ABC-XYZ on organizational resources and capabilities been assessed and planned for?
  • 25.