Downloaded 148 times


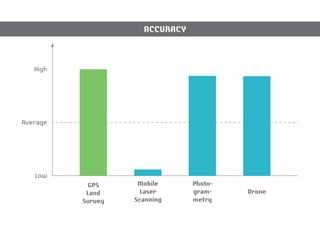
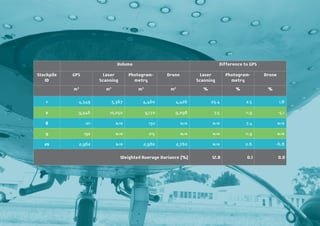

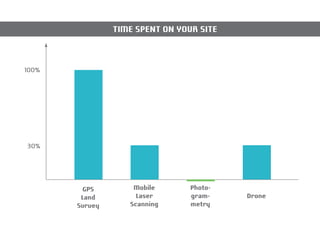

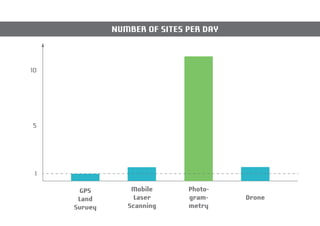
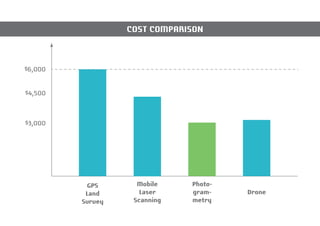


This white paper explores various surveying technologies used in quarrying, including aerial photography, lidar, total stations, laser scanning, drones, and smartphone apps, and their applications such as volume measurements and mapping. It discusses a comparative study on measuring stockpile volumes using different technologies, highlighting that drone and photogrammetric surveys are as accurate as traditional GPS methods but more cost-effective and safer. The paper concludes that advancements in surveying technology offer significant benefits to quarry operations.