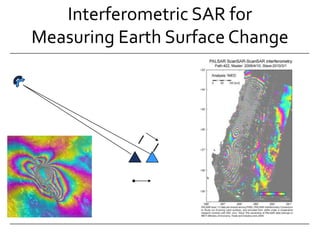
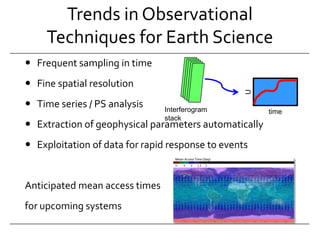
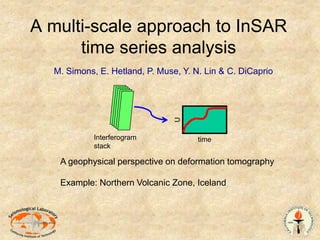
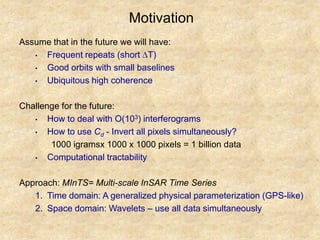
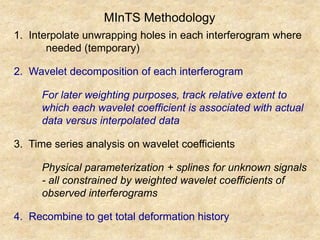
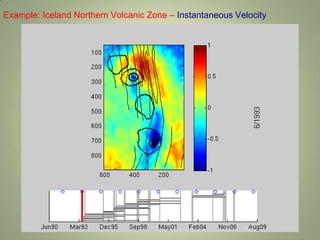
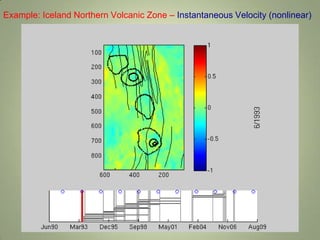
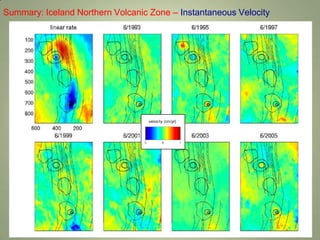
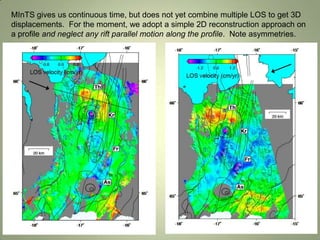
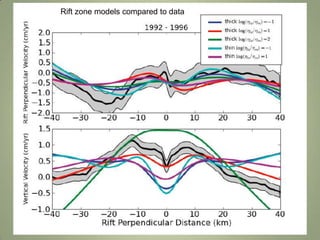
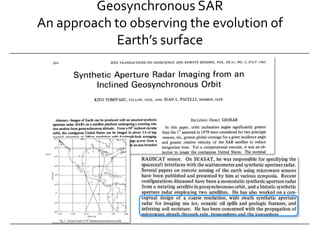
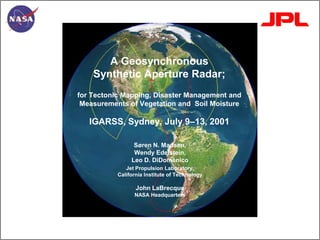
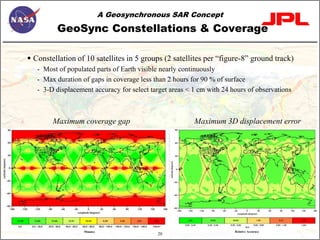
This document discusses the use of Interferometric Synthetic Aperture Radar (InSAR) for measuring surface deformation over time. It summarizes Kiyo Tomiyasu's pioneering work on using InSAR from a geosynchronous orbit. It also presents a new method called MInTS that uses wavelet decomposition and physical parameterization to generate continuous deformation time series from large numbers of InSAR images. MInTS is demonstrated on data from Iceland's Northern Volcanic Zone, showing instantaneous velocities and asymmetries in deformation patterns. Finally, the document proposes a concept for a geosynchronous InSAR constellation that could provide near-continuous coverage of the Earth's surface.
A ~25 slide presentation that explains the underlying principles and some applications of InSAR, with a particular focus on the measurement of deformation due to earthquakes. The presentation could be used in a lecture or lab setting, or provided to students for review out of class. The slides are annotated with additional background information designed to assist instructors.
El tratamiento digital de las imágenes agiliza el proceso de interpretación, permite generar modelos cuantitativos e integrar los resultados con otro tipo de información geográfica. Contribuye además a resolver problemas vinculados con la entrada y actualización de datos en la implementación de SIG (también conocido con los acrónimos SIG en español o GIS en inglés), por la capacidad de obtener documentos temáticos, a bajo costo y en un período de tiempo bastante cercano a la obtención de la imagen utilizada, ofreciendo mayor accesibilidad temporal frente a otras técnicas convencionales.
Importance of SSPS in SDG and ESG, and importance of antennas in SSPSAdvanced-Concepts-Team
A space solar power satellite system or SSPS can generates electricity without CO2 gas nor harmful debris with competitive cost. So, it should be attached importance in SDG and ESG programs. The SSPS is a huge system working in space so that several key technologies have to be innovated or verified in space before the final manufacture. I will introduce those key technologies in terms of difficulty in applying to SSPS. In a research and development plan, key technologies with more difficulty should be ranked higher. Antennas are typically difficult ones. It is explained how the antenna is challenging compared with the existing antennas on the ground and in space. Finally, I will show you a R&D plan to put SSPS into practical use in about 30 years.
A GEO satellite’s distance from earth gives it a large coverage area, almost a fourth of the earth’s surface and also have 24 hour view of a particular area.This will be very helpful to army,navy etc.,These factors make it ideal for satellite broadcast and other multipoint applications.Continuous monitoring is done and also cost effective in long term, risk-less.
First Observation of the Earth’s Permanent FreeOscillation s on Ocean Bottom ...Sérgio Sacani
The Earth’s hum is the permanent free oscillations of the Earth recorded in the absence ofearthquakes, at periods above 30 s. We present the first observations of its fundamental spheroidaleigenmodes on broadband ocean bottom seismometers (OBSs) in the Indian Ocean. At the ocean bottom,the effects of ocean infragravity waves (compliance) and seafloor currents (tilt) overshadow the hum. In ourexperiment, data are also affected by electronic glitches. We remove these signals from the seismic traceby subtracting average glitch signals; performing a linear regression; and using frequency-dependentresponse functions between pressure, horizontal, and vertical seismic components. This reduces the longperiod noise on the OBS to the level of a good land station. Finally, by windowing the autocorrelation toinclude only the direct arrival, the first and second orbits around the Earth, and by calculating its Fouriertransform, we clearly observe the eigenmodes at the ocean bottom.
Meteorology is a discipline concerned with observational earth sciences and theoretical physics. It has the task of providing an accurate knowledge of the state of the atmosphere. Before the advent of weather satellites the weathermen had been severely handicapped by having only a very limited knowledge of the state of the atmosphere at any given time. Meteorological satellites have to a large extent has enabled to overcome this deficiency.
Similar to WE3.L10.4: KIYO TOMIYASU, CO-SEISMIC SLIP AND THE KRAFLA VOLCANO: REFLECTIONS ON INSAR AND EARTH SCIENCE (20)
WE3.L10.4: KIYO TOMIYASU, CO-SEISMIC SLIP AND THE KRAFLA VOLCANO: REFLECTIONS ON INSAR AND EARTH SCIENCE
1. Kiyo Tomiyasu, Co-Seismic Slip, and the Krafla Volcano: Reflections on InSAR and Earth Science Paul A. Rosen Jet Propulsion Laboratory California Institute of Technology Special Session Honoring the Achievements of KiyoTomiyasu IGARSS 2010 Honolulu, Hawaii
3. Outline Trends in Interferometric SAR (InSAR) for Earth Science Geosynchronous InSAR Concept Presentation of 90th Birthday Celebratory Plaque of Appreciation to Kiyo Tomiyasu from JPL
5. Trends in Observational Techniques for Earth Science Frequent sampling in time Fine spatial resolution Time series / PS analysis Extraction of geophysical parameters automatically Exploitation of data for rapid response to events Anticipated mean access times for upcoming systems Interferogram stack U Mean Access Time (Day) ∞ 4 2 1.3 1 time
6. A multi-scale approach to InSAR time series analysis M. Simons, E. Hetland, P. Muse, Y. N. Lin & C. DiCaprio Interferogram stack U A geophysical perspective on deformation tomography Example: Northern Volcanic Zone, Iceland time
11. MInTS Methodology Interpolate unwrapping holes in each interferogram where needed (temporary) Wavelet decomposition of each interferogram For later weighting purposes, track relative extent to which each wavelet coefficient is associated with actual data versus interpolated data Time series analysis on wavelet coefficients Physical parameterization + splines for unknown signals - all constrained by weighted wavelet coefficients of observed interferograms Recombine to get total deformation history
15. MInTS gives us continuous time, but does not yet combine multiple LOS to get 3D displacements. For the moment, we adopt a simple 2D reconstruction approach on a profile and neglect any rift parallel motion along the profile. Note asymmetries.
18. A Geosynchronous Synthetic Aperture Radar;for Tectonic Mapping, Disaster Management and Measurements of Vegetation and Soil MoistureIGARSS, Sydney, July 9–13, 2001 Søren N. Madsen, Wendy Edelstein, Leo D. DiDomenico Jet Propulsion Laboratory, California Institute of TechnologyJohn LaBrecqueNASA Headquarters
19. 16 Previous Work Tomiyasu K.:“Synthetic Aperture Radar in Geosynchronous Orbit,” Dig. Int. IEEE Antennas and Propagation Symp., U. Maryland, 42–45, May 1978“Synthetic Aperture Radar Imaging from an Inclined Geosynchronous Orbit,” IEEE Trans. Geosci. Remote Sens. GE-21(3), 324–328 (1983) Holt, B. & Hilland, J.“Rapid-Repeat SAR Imaging of the Ocean Surface: Are Daily Observations Possible?” Johns Hopkins APL Technical Dig., 21(1), 162–169, 2000
20. 17 GeoSync SAR Orbit and Measurement Description Orbit 35789 km altitude (geosynchronous) 60˚ inclination (not geostationary) 1 day repeat Instrument L-band SAR Continuous strip mapping, interferometricScanSAR, or spotlight operation 30 m diameter antenna aperture (electronically scanned array) Distributed T/R modules on membrane Nadir pointed, all steering electronic (only ±8º required side to side) Radar and spacecraft bus integrated on inflatable/rigidizable structure 5500 km accessible ground swath on either side of nadir 100% instrument duty cycle (always in view of land)
21. 18 Operational Modes Highly Flexible Operational modes Stripmap SAR with 400 km swath width: 10 m resolution @ 4–5 looks Suited for high-resolution mapping ScanSAR over 5500 km swaths on either side of nadir track: 50 m @ 4–5 looks Daily continental coverage Squint-scanned SAR (beam hops to +45˚, broadside, –45˚): 3–D displacement mapping of extended areas in a single day Useful for tectonic studies Spotlight SAR (beam dwells on single target area for long time): High resolution in azimuth, semi-continuous coverage Suitable for disaster management High resolution stepped frequency SAR (step frequency within 80 MHz band on successive passes then combine coherently to get high resolution without losing SNR or increasing data rate): 2 m ground range resolution, 2m azimuth resolution at far range 6-10 m resolution at near range Data rates and volumes Data rate 220 Mbits/sec per 20 MHz channel 2.4 TB/day with nearly 100% instrument duty cycle
26. 28 KW DC instrument powerPropulsion Modules (x2) Thin-film Solar Arrays Horizontal booms (x12) L-band RF membrane antenna aperture Spacecraft Bus Telescoping booms (x2)
27. 20 GeoSync Constellations & Coverage Constellation of 10 satellites in 5 groups (2 satellites per “figure-8” ground track) Most of populated parts of Earth visible nearly continuously Max duration of gaps in coverage less than 2 hours for 90 % of surface 3-D displacement accuracy for select target areas < 1 cm with 24 hours of observations Maximum coverage gap Maximum 3D displacement error Relative Accuracy Minutes
28. Innovation New concepts for geosynchronous deformation observations New ideas in enabling technologies Seismology from Space Improving Earthquake Forecasting
29. Celebratory Plaque To Kiyo Tomiyasu With greatest appreciation on your ninetieth birthday for a lifetime of innovation in remote sensing Signed by Charles Elachi, Director Jet Propulsion Laboratory
Editor's Notes
There are already several very successful methods for estimating time-variable deformation fields from stacks of radar interferograms. Today, I will provide a variation on these existing approaches. These variations are heavily influenced by a geophysical bias of how the Earth deforms. The methods we use borrow from standard practices in GPS time series analysis as well as from ideas common in seismic tomography. In essence, this is space/time deformation tomography designed to provide the best estimate of deformation everywhere at all times.