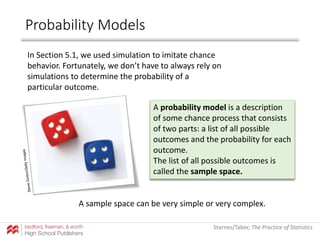
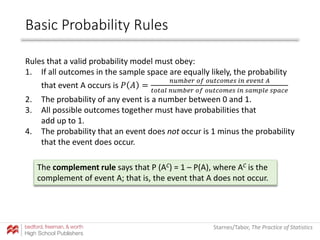
This document discusses probability rules and models. It begins by defining key terms like probability model, sample space, and event. It then presents the formula for calculating probabilities when outcomes are equally likely. Several basic probability rules are covered, including that a probability must be between 0 and 1 and the complement and addition rules. Examples are provided to demonstrate how to calculate probabilities and use two-way tables and Venn diagrams to find probabilities involving two events. The general addition rule for calculating P(A or B) is also explained.
Please Subscribe to this Channel for more solutions and lectures
http://www.youtube.com/onlineteaching
Chapter 4: Probability
4.1: Basic Concepts of Probability
Please Subscribe to this Channel for more solutions and lectures
http://www.youtube.com/onlineteaching
Chapter 4: Probability
4.1: Basic Concepts of Probability
3 PROBABILITY TOPICSFigure 3.1 Meteor showers are rare, .docxtamicawaysmith
3 | PROBABILITY TOPICS
Figure 3.1 Meteor showers are rare, but the probability of them occurring can be calculated. (credit: Navicore/flickr)
Introduction
Chapter Objectives
By the end of this chapter, the student should be able to:
• Understand and use the terminology of probability.
• Determine whether two events are mutually exclusive and whether two events are independent.
• Calculate probabilities using the Addition Rules and Multiplication Rules.
• Construct and interpret Contingency Tables.
• Construct and interpret Venn Diagrams.
• Construct and interpret Tree Diagrams.
It is often necessary to "guess" about the outcome of an event in order to make a decision. Politicians study polls to guess
their likelihood of winning an election. Teachers choose a particular course of study based on what they think students can
comprehend. Doctors choose the treatments needed for various diseases based on their assessment of likely results. You
may have visited a casino where people play games chosen because of the belief that the likelihood of winning is good. You
may have chosen your course of study based on the probable availability of jobs.
You have, more than likely, used probability. In fact, you probably have an intuitive sense of probability. Probability deals
with the chance of an event occurring. Whenever you weigh the odds of whether or not to do your homework or to study
for an exam, you are using probability. In this chapter, you will learn how to solve probability problems using a systematic
approach.
Your instructor will survey your class. Count the number of students in the class today.
• Raise your hand if you have any change in your pocket or purse. Record the number of raised hands.
CHAPTER 3 | PROBABILITY TOPICS 163
• Raise your hand if you rode a bus within the past month. Record the number of raised hands.
• Raise your hand if you answered "yes" to BOTH of the first two questions. Record the number of raised hands.
Use the class data as estimates of the following probabilities. P(change) means the probability that a randomly chosen
person in your class has change in his/her pocket or purse. P(bus) means the probability that a randomly chosen person
in your class rode a bus within the last month and so on. Discuss your answers.
• Find P(change).
• Find P(bus).
• Find P(change AND bus). Find the probability that a randomly chosen student in your class has change in his/her
pocket or purse and rode a bus within the last month.
• Find P(change|bus). Find the probability that a randomly chosen student has change given that he or she rode a
bus within the last month. Count all the students that rode a bus. From the group of students who rode a bus,
count those who have change. The probability is equal to those who have change and rode a bus divided by those
who rode a bus.
3.1 | Terminology
Probability is a measure that is associated with how certain we are of outcomes of a particular experiment or activity.
An e ...
Please Subscribe to this Channel for more solutions and lectures
http://www.youtube.com/onlineteaching
Chapter 4: Probability
4.3: Complements and Conditional Probability, and Bayes' Theorem
It is a consolidation of basic probability concepts worth understanding before attempting to apply probability concepts for predictions. The material is formed from different sources. ll the sources are acknowledged.
1 Probability Please read sections 3.1 – 3.3 in your .docxaryan532920
1
Probability
Please read sections 3.1 – 3.3 in your textbook
Def: An experiment is a process by which observations are generated.
Def: A variable is a quantity that is observed in the experiment.
Def: The sample space (S) for an experiment is the set of all possible outcomes.
Def: An event E is a subset of a sample space. It provides the collection of outcomes
that correspond to some classification.
Example:
Note: A sample space does not have to be finite.
Example: Pick any positive integer. The sample space is countably infinite.
A discrete sample space is one with a finite number of elements, { }1,2,3,4,5,6 or one that
has a countably infinite number of elements { }1,3,5,7,... .
A continuous sample space consists of elements forming a continuum. { }x / 2 x 5< <
2
A Venn diagram is used to show relationships between events.
A intersection B = (A ∩ B) = A and B
The outcomes in (A intersection B) belong to set A as well as to set B.
A union B = (A U B) = A alone or B alone or both
Union Formula
For any events A, B, P (A or B) = P (A) + P (B) – P (A intersection B) i.e.
P (A U B) = P (A) + P (B) – P (A ∩ B)
3
cA complement not A A ' A A = = = =
A complement consists of all outcomes outside of A.
Note: P (not A) = 1 – P (A)
Def: Two events are mutually exclusive (disjoint, incompatible) if they do not intersect,
i.e. if they do not occur at the same time. They have no outcomes in common.
When A and B are mutually exclusive, (A ∩ B) = null set = Ø, and P (A and B) = 0.
Thus, when A and B are mutually exclusive, P (A or B) = P (A) + P (B)
(This is exactly the same statement as rule 3 below)
Axioms of Probability
Def: A probability function p is a rule for calculating the probability of an event. The
function p satisfies 3 conditions:
1) 0 ≤ P (A) ≤1, for all events A in the sample space S
2) P (Sample Space S) = 1
3) If A, B, C are mutually exclusive events in the sample space S, then
P(A B C) P(A) P(B) P(C)∪ ∪ = + +
4
The Classical Probability Concept: If there are n equally likely possibilities, of which one
must occur and s are regarded as successes, then the probability of success is s
n
.
Example:
Frequency interpretation of Probability: The probability of an event E is the proportion of
times the event occurs during a long run of repeated experiments.
Example:
Def: A set function assigns a non-negative value to a set.
Ex: N (A) is a set function whose value is the number of elements in A.
Def: An additive set function f is a function for which f (A U B) = f (A) + f (B) when A and
B are mutually exclusive.
N (A) is an additive set function.
Ex: Toss 2 fair dice. Let A be the event that the sum on the two dice is 5. Let B be the
event that the sum on ...
In this slide, variables types, probability theory behind the algorithms and its uses including distribution is explained. Also theorems like bayes theorem is also explained.
Probability implies 'likelihood' or 'chance'. When an event is certain to happen then the probability of occurrence of that event is 1 and when it is certain that the event cannot happen then the probability of that event is 0.
A distribution where only two outcomes are possible, such as success or failure, gain or loss, win or lose and where the probability of success and failure is the same for all the trials is called a Binomial Distribution.
Show drafts
volume_up
Empowering the Data Analytics Ecosystem: A Laser Focus on Value
The data analytics ecosystem thrives when every component functions at its peak, unlocking the true potential of data. Here's a laser focus on key areas for an empowered ecosystem:
1. Democratize Access, Not Data:
Granular Access Controls: Provide users with self-service tools tailored to their specific needs, preventing data overload and misuse.
Data Catalogs: Implement robust data catalogs for easy discovery and understanding of available data sources.
2. Foster Collaboration with Clear Roles:
Data Mesh Architecture: Break down data silos by creating a distributed data ownership model with clear ownership and responsibilities.
Collaborative Workspaces: Utilize interactive platforms where data scientists, analysts, and domain experts can work seamlessly together.
3. Leverage Advanced Analytics Strategically:
AI-powered Automation: Automate repetitive tasks like data cleaning and feature engineering, freeing up data talent for higher-level analysis.
Right-Tool Selection: Strategically choose the most effective advanced analytics techniques (e.g., AI, ML) based on specific business problems.
4. Prioritize Data Quality with Automation:
Automated Data Validation: Implement automated data quality checks to identify and rectify errors at the source, minimizing downstream issues.
Data Lineage Tracking: Track the flow of data throughout the ecosystem, ensuring transparency and facilitating root cause analysis for errors.
5. Cultivate a Data-Driven Mindset:
Metrics-Driven Performance Management: Align KPIs and performance metrics with data-driven insights to ensure actionable decision making.
Data Storytelling Workshops: Equip stakeholders with the skills to translate complex data findings into compelling narratives that drive action.
Benefits of a Precise Ecosystem:
Sharpened Focus: Precise access and clear roles ensure everyone works with the most relevant data, maximizing efficiency.
Actionable Insights: Strategic analytics and automated quality checks lead to more reliable and actionable data insights.
Continuous Improvement: Data-driven performance management fosters a culture of learning and continuous improvement.
Sustainable Growth: Empowered by data, organizations can make informed decisions to drive sustainable growth and innovation.
By focusing on these precise actions, organizations can create an empowered data analytics ecosystem that delivers real value by driving data-driven decisions and maximizing the return on their data investment.
As Europe's leading economic powerhouse and the fourth-largest hashtag#economy globally, Germany stands at the forefront of innovation and industrial might. Renowned for its precision engineering and high-tech sectors, Germany's economic structure is heavily supported by a robust service industry, accounting for approximately 68% of its GDP. This economic clout and strategic geopolitical stance position Germany as a focal point in the global cyber threat landscape.
In the face of escalating global tensions, particularly those emanating from geopolitical disputes with nations like hashtag#Russia and hashtag#China, hashtag#Germany has witnessed a significant uptick in targeted cyber operations. Our analysis indicates a marked increase in hashtag#cyberattack sophistication aimed at critical infrastructure and key industrial sectors. These attacks range from ransomware campaigns to hashtag#AdvancedPersistentThreats (hashtag#APTs), threatening national security and business integrity.
🔑 Key findings include:
🔍 Increased frequency and complexity of cyber threats.
🔍 Escalation of state-sponsored and criminally motivated cyber operations.
🔍 Active dark web exchanges of malicious tools and tactics.
Our comprehensive report delves into these challenges, using a blend of open-source and proprietary data collection techniques. By monitoring activity on critical networks and analyzing attack patterns, our team provides a detailed overview of the threats facing German entities.
This report aims to equip stakeholders across public and private sectors with the knowledge to enhance their defensive strategies, reduce exposure to cyber risks, and reinforce Germany's resilience against cyber threats.
Techniques to optimize the pagerank algorithm usually fall in two categories. One is to try reducing the work per iteration, and the other is to try reducing the number of iterations. These goals are often at odds with one another. Skipping computation on vertices which have already converged has the potential to save iteration time. Skipping in-identical vertices, with the same in-links, helps reduce duplicate computations and thus could help reduce iteration time. Road networks often have chains which can be short-circuited before pagerank computation to improve performance. Final ranks of chain nodes can be easily calculated. This could reduce both the iteration time, and the number of iterations. If a graph has no dangling nodes, pagerank of each strongly connected component can be computed in topological order. This could help reduce the iteration time, no. of iterations, and also enable multi-iteration concurrency in pagerank computation. The combination of all of the above methods is the STICD algorithm. [sticd] For dynamic graphs, unchanged components whose ranks are unaffected can be skipped altogether.
2. Starnes/Tabor, The Practice of Statistics
By the end of this section, you should be able to:
LEARNING TARGETS
Probability Rules
GIVE a probability model for a chance process with equally
likely outcomes and USE it to find the probability of an
event.
USE basic probability rules, including the complement rule
and the addition rule for mutually exclusive events.
USE a two-way table or Venn diagram to model a chance
process and calculate probabilities involving two events.
APPLY the general addition rule to calculate probabilities.
3. Starnes/Tabor, The Practice of Statistics
Probability Models
In Section 5.1, we used simulation to imitate chance
behavior. Fortunately, we don’t have to always rely on
simulations to determine the probability of a
particular outcome.
A probability model is a description
of some chance process that consists
of two parts: a list of all possible
outcomes and the probability for each
outcome.
The list of all possible outcomes is
called the sample space.
A sample space can be very simple or very complex.
4. Starnes/Tabor, The Practice of Statistics
Probability Models
Sample Space
36 Outcomes
Since the dice are fair,
each outcome is equally likely.
Each outcome has probability 1/36.
5. Starnes/Tabor, The Practice of Statistics
Probability Models
An event is any collection of outcomes from some chance process.
Let A = getting a sum of 5 when two fair
dice are rolled
Since each outcome has
probability
1
36
, P(A) =
4
36
.
There are 4 outcomes that result
in a sum of 5.
6. Starnes/Tabor, The Practice of Statistics
Probability Models
Finding Probabilities: Equally Likely Outcomes
If all outcomes in the sample space are equally likely, the probability that
event A occurs can be found using the formula
𝑃 𝐴 =
𝑛𝑢𝑚𝑏𝑒𝑟 𝑜𝑓 𝑜𝑢𝑡𝑐𝑜𝑚𝑒𝑠 𝑖𝑛 𝑒𝑣𝑒𝑛𝑡 𝐴
𝑡𝑜𝑡𝑎𝑙 𝑛𝑢𝑚𝑏𝑒𝑟 𝑜𝑓 𝑜𝑢𝑡𝑐𝑜𝑚𝑒𝑠 𝑖𝑛 𝑠𝑎𝑚𝑝𝑙𝑒 𝑠𝑝𝑎𝑐𝑒
7. Starnes/Tabor, The Practice of Statistics
Basic Probability Rules
Rules that a valid probability model must obey:
1. If all outcomes in the sample space are equally likely, the probability
that event A occurs is 𝑃 𝐴 =
𝑛𝑢𝑚𝑏𝑒𝑟 𝑜𝑓 𝑜𝑢𝑡𝑐𝑜𝑚𝑒𝑠 𝑖𝑛 𝑒𝑣𝑒𝑛𝑡 𝐴
𝑡𝑜𝑡𝑎𝑙 𝑛𝑢𝑚𝑏𝑒𝑟 𝑜𝑓 𝑜𝑢𝑡𝑐𝑜𝑚𝑒𝑠 𝑖𝑛 𝑠𝑎𝑚𝑝𝑙𝑒 𝑠𝑝𝑎𝑐𝑒
2. The probability of any event is a number between 0 and 1.
3. All possible outcomes together must have probabilities that
add up to 1.
4. The probability that an event does not occur is 1 minus the probability
that the event does occur.
The complement rule says that P (AC) = 1 – P(A), where AC is the
complement of event A; that is, the event that A does not occur.
8. Starnes/Tabor, The Practice of Statistics
Basic Probability Rules
Rules that a valid probability model must obey:
1. If all outcomes in the sample space are equally likely, the probability
that event A occurs is 𝑃 𝐴 =
𝑛𝑢𝑚𝑏𝑒𝑟 𝑜𝑓 𝑜𝑢𝑡𝑐𝑜𝑚𝑒𝑠 𝑖𝑛 𝑒𝑣𝑒𝑛𝑡 𝐴
𝑡𝑜𝑡𝑎𝑙 𝑛𝑢𝑚𝑏𝑒𝑟 𝑜𝑓 𝑜𝑢𝑡𝑐𝑜𝑚𝑒𝑠 𝑖𝑛 𝑠𝑎𝑚𝑝𝑙𝑒 𝑠𝑝𝑎𝑐𝑒
2. The probability of any event is a number between 0 and 1.
3. All possible outcomes together must have probabilities that
add up to 1.
4. The probability that an event does not occur is 1 minus the probability
that the event does occur.
The complement rule says that P (AC) = 1 – P(A), where AC is the
complement of event A; that is, the event that A does not occur.
9. Starnes/Tabor, The Practice of Statistics
Basic Probability Rules
If we roll two fair dice, what is the probability that the sum is 6?
Two events A and B are mutually exclusive if they have no
outcomes in common and so can never occur together—that is, if
P(A and B) = 0.
The addition rule for mutually exclusive events A and B says that
P(A or B) 5= P(A) + P(B)
P(sum is 6) =
5
36
P(sum is 5 or sum is 6) = P(sum is 5) + P(sum is 6)=
4
36
+
5
36
=
9
36
= 0.25
If we roll two fair dice, what is the probability that the sum is 5 or 6?
10. Starnes/Tabor, The Practice of Statistics
Basic Probability Rules
If we roll two fair dice, what is the probability that the sum is 6?
Two events A and B are mutually exclusive if they have no
outcomes in common and so can never occur together—that is, if
P(A and B) = 0.
The addition rule for mutually exclusive events A and B says that
P(A or B) 5= P(A) + P(B)
P(sum is 6) =
5
36
P(sum is 5 or sum is 6) = P(sum is 5) + P(sum is 6)=
4
36
+
5
36
=
9
36
= 0.25
If we roll two fair dice, what is the probability that the sum is 5 or 6?
11. Starnes/Tabor, The Practice of Statistics
Basic Probability Rules
• For any event A, 0 ≤ 𝑃(𝐴) ≤ 1.
• If S is the sample space in a probability model, 𝑃 𝑆 = 1
• In the case of equally likely outcomes,
𝑃 𝐴 =
𝑛𝑢𝑚𝑏𝑒𝑟 𝑜𝑓 𝑜𝑢𝑡𝑐𝑜𝑚𝑒𝑠 𝑖𝑛 𝑒𝑣𝑒𝑛𝑡 𝐴
𝑡𝑜𝑡𝑎𝑙 𝑛𝑢𝑚𝑏𝑒𝑟 𝑜𝑓 𝑜𝑢𝑡𝑐𝑜𝑚𝑒𝑠 𝑖𝑛 𝑠𝑎𝑚𝑝𝑙𝑒 𝑠𝑝𝑎𝑐𝑒
• Complement rule: 𝑃 𝐴𝐶 = 1 − 𝑃(𝐴)
• Addition rule for mutually exclusive events: If A and B are mutually
exclusive, 𝑃 𝐴 𝑜𝑟 𝐵 = 𝑃 𝐴 + 𝑃(𝐵)
We can summarize the basic probability rules in symbolic form.
12. Starnes/Tabor, The Practice of Statistics
Basic Probability Rules
Problem: Suppose you tear open the corner of a bag of M&M’S® Milk Chocolate
Candies, pour one candy into your hand, and observe the color. According to Mars,
Inc., the maker of M&M’S, the probability model for a bag from its Cleveland
factory is:
(a) Explain why this is a valid probability model.
Niels
Poulsen
std/Alamy
(a) The probability of each outcome is a number between 0 and 1.
The sum of the probabilities is
0.207 + 0.205 + 0.198 + 0.135 + 0.131 + 0.124 = 1.
13. Starnes/Tabor, The Practice of Statistics
Basic Probability Rules
Problem: Suppose you tear open the corner of a bag of M&M’S® Milk Chocolate
Candies, pour one candy into your hand, and observe the color. According to Mars,
Inc., the maker of M&M’S, the probability model for a bag from its Cleveland
factory is:
(a) Explain why this is a valid probability model.
(b) Find the probability that you don’t get a blue
M&M.
Niels
Poulsen
std/Alamy
(b) P (not blue) = 1 – P(blue) = 1 – 0.207 = 0.793
14. Starnes/Tabor, The Practice of Statistics
Basic Probability Rules
Problem: Suppose you tear open the corner of a bag of M&M’S® Milk Chocolate
Candies, pour one candy into your hand, and observe the color. According to Mars,
Inc., the maker of M&M’S, the probability model for a bag from its Cleveland
factory is:
(a) Explain why this is a valid probability model.
(b) Find the probability that you don’t get a blue
M&M.
(c) What’s the probability that you get an orange
or a brown M&M?
Niels
Poulsen
std/Alamy
(c) P (orange or brown) = P (orange) + P (brown)
= 0.205 + 0.124
= 0.329
15. Starnes/Tabor, The Practice of Statistics
Two-Way Tables, Probability, and the
General Addition Rule
There are two different uses of the word or in everyday life.
When you are asked if you
want “soup or salad,” the
waiter wants you to choose
one or the other, but not both.
However, when you order coffee
and are asked if you want
“cream or sugar,” it’s OK to ask
for one or the other or both.
In mathematics and probability, “A or B” means one or the other or both.
When you’re trying to find probabilities involving two events, like
P(A or B), a two-way table can display the sample space in a way
that makes probability calculations easier.
16. Starnes/Tabor, The Practice of Statistics
Two-Way Tables, Probability, and the
General Addition Rule
Problem: Students in a college statistics class wanted to find out how common it is
for young adults to have their ears pierced. They recorded data on two variables—
gender and whether or not the student had a pierced ear—for all 178 people in
the class. The two-way table summarizes
the data. Suppose we choose a student
from the class at random. Define
event A as getting a male student
and event B as getting a student
with a pierced ear.
(a) Find P(B).
(a) P (B) = P (pierced ear)
=
103
178
= 0.579
17. Starnes/Tabor, The Practice of Statistics
Two-Way Tables, Probability, and the
General Addition Rule
Problem: Students in a college statistics class wanted to find out how common it is
for young adults to have their ears pierced. They recorded data on two variables—
gender and whether or not the student had a pierced ear—for all 178 people in
the class. The two-way table summarizes
the data. Suppose we choose a student
from the class at random. Define
event A as getting a male student
and event B as getting a student
with a pierced ear.
(a) Find P(B).
(b) Find P(A and B). Interpret this value in context.
(b) P (A and B) = P (male and pierced ear)
=
19
178
= 0.107
18. Starnes/Tabor, The Practice of Statistics
Two-Way Tables, Probability, and the
General Addition Rule
Problem: Students in a college statistics class wanted to find out how common it is
for young adults to have their ears pierced. They recorded data on two variables—
gender and whether or not the student had a pierced ear—for all 178 people in
the class. The two-way table summarizes
the data. Suppose we choose a student
from the class at random. Define
event A as getting a male student
and event B as getting a student
with a pierced ear.
(a) Find P(B).
(b) Find P(A and B). Interpret this value in context.
(b) There’s about an 11% chance that a
randomly selected student from this
class is male and has a pierced ear.
19. Starnes/Tabor, The Practice of Statistics
Two-Way Tables, Probability, and the
General Addition Rule
Problem: Students in a college statistics class wanted to find out how common it is
for young adults to have their ears pierced. They recorded data on two variables—
gender and whether or not the student had a pierced ear—for all 178 people in
the class. The two-way table summarizes
the data. Suppose we choose a student
from the class at random. Define
event A as getting a male student
and event B as getting a student
with a pierced ear.
(a) Find P(B).
(b) Find P(A and B). Interpret this value in context.
(c) Find P(A or B).
(c) P (A or B) = P (male or pierced ear)
=
71+19+84
178
= 0.978
20. Starnes/Tabor, The Practice of Statistics
Two-Way Tables, Probability, and the
General Addition Rule
Part (c) of the example
reveals an important fact
about finding the
probability P(A or B): we
can’t use the addition
rule for mutually exclusive
events unless events A and
B have no outcomes in
common.
21. Starnes/Tabor, The Practice of Statistics
Two-Way Tables, Probability, and the
General Addition Rule
We can fix the double-
counting problem
illustrated in the two-
way table by subtracting
the probability
P(male and pierced ear)
from the sum of
P(A) and P(B).
𝑃 𝑚𝑎𝑙𝑒 𝑜𝑟 𝑝𝑖𝑒𝑟𝑐𝑒𝑑 𝑒𝑎𝑟 = 𝑃 𝑚𝑎𝑙𝑒 + 𝑃 𝑝𝑖𝑒𝑟𝑐𝑒𝑑 𝑒𝑎𝑟 − 𝑃(𝑚𝑎𝑙𝑒 𝑎𝑛𝑑 𝑝𝑖𝑒𝑟𝑐𝑒𝑑 𝑒𝑎𝑟)
=
90
178
+
103
178
−
19
178
=
174
178
If A and B are any two events resulting from some chance process, the
general addition rule says that 𝑃 𝐴 𝑜𝑟 𝐵 = 𝑃 𝐴 + 𝑃 𝐵 − 𝑃(𝐴 𝑎𝑛𝑑 𝐵)
22. Starnes/Tabor, The Practice of Statistics
Two-Way Tables, Probability, and the
General Addition Rule
Problem: A survey of all residents in a large apartment complex reveals
that 68% use Facebook, 28% use Instagram, and 25% do both. Suppose
we select a resident at random. What’s the probability that the person
uses Facebook or uses Instagram?
Let event F = uses Facebook and
I = uses Instagram.
P(F or I) = P(F) + P(I) – P(F and I)
= 0.68 + 0.28 – 0.25
= 0.71
Ann
Heath
23. Starnes/Tabor, The Practice of Statistics
Venn Diagrams and Probability
A Venn diagram consists of one or more circles surrounded by a rectangle.
Each circle represents an event. The region inside the rectangle represents
the sample space of the chance process.
24. Starnes/Tabor, The Practice of Statistics
Venn Diagrams and Probability
The complement AC
contains exactly the
outcomes that are not in A.
The intersection of events
A and B (A ∩ B) is the set of
all outcomes in both events
A and B.
The union of events
A and B (A ∪ B) is the
set of all outcomes in
either event A or B.
HINT: To keep the symbols
straight, remember
∪ for Union and
∩ for intersection.
25. Starnes/Tabor, The Practice of Statistics
Venn Diagrams and Probability
Problem: A survey of all residents in a large apartment complex reveals
that 68% use Facebook, 28% use Instagram, and 25% do both. Suppose
we select a resident at random.
(a) Make a Venn diagram to display the sample space of this chance
process using the events F: uses Facebook and I: uses Instagram.
(a)
26. Starnes/Tabor, The Practice of Statistics
Venn Diagrams and Probability
Problem: A survey of all residents in a large apartment complex reveals
that 68% use Facebook, 28% use Instagram, and 25% do both. Suppose
we select a resident at random.
(a) Make a Venn diagram to display the sample space of this chance
process using the events F: uses Facebook and I: uses Instagram.
(b) Find the probability that the person uses neither Facebook nor
Instagram.
(b) P(no Facebook and no Instagram) = 0.29