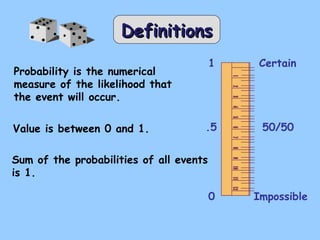
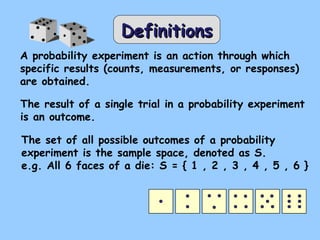
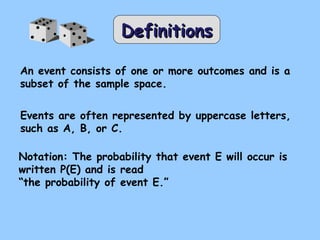
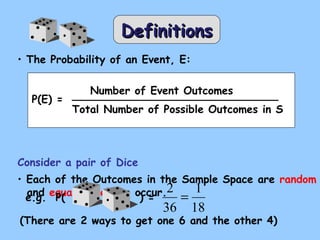
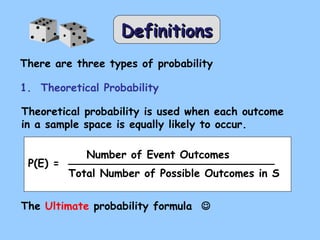
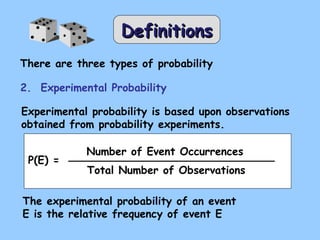
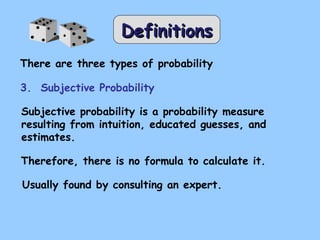
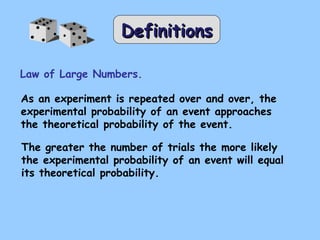
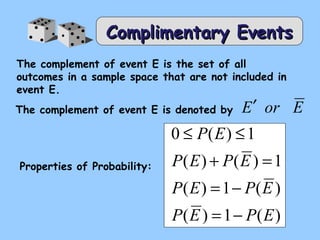
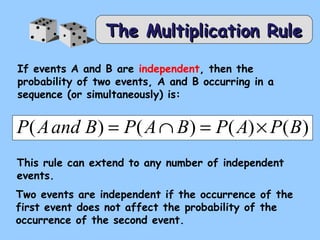
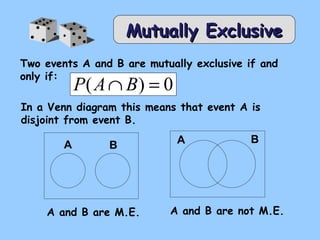
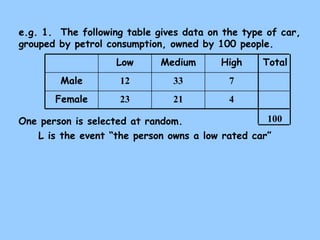
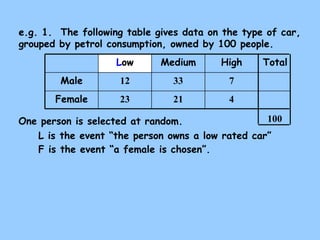
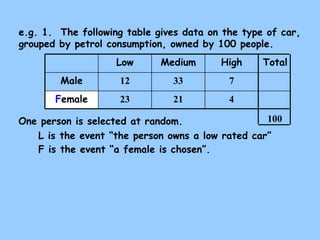
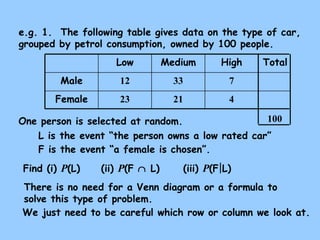
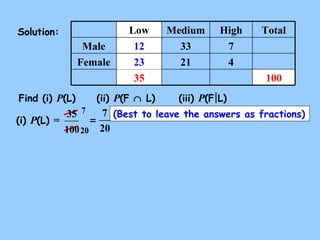
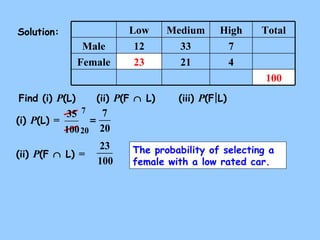
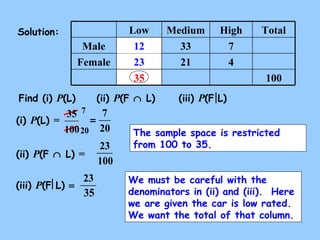
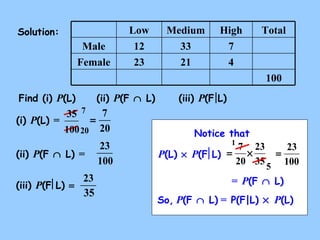
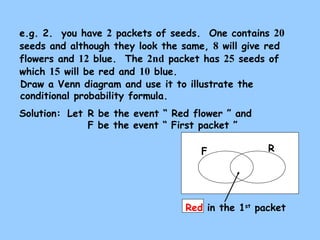
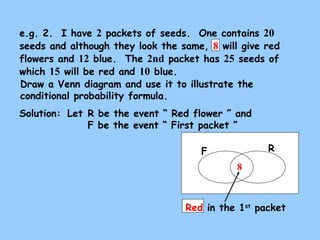
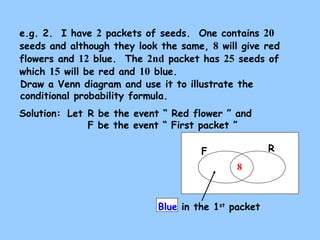
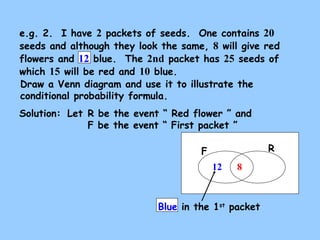
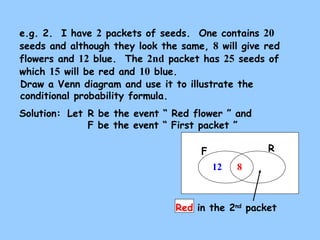
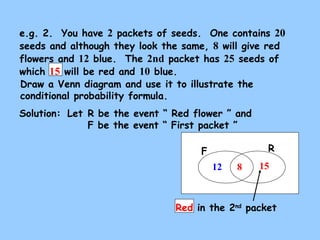
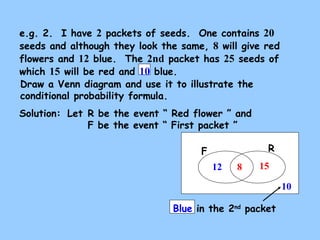
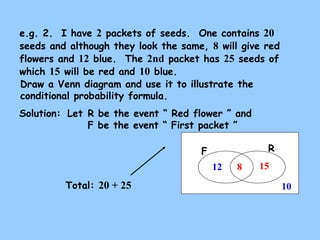
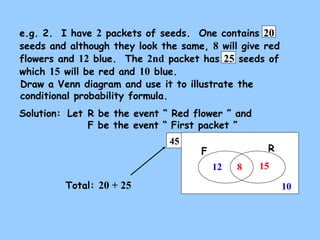
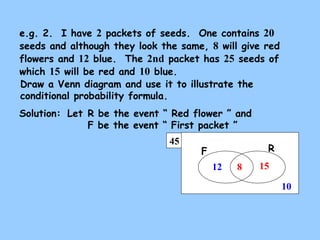
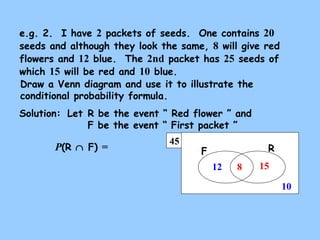
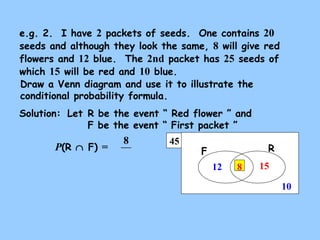
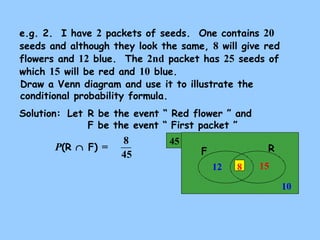
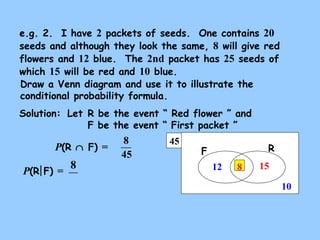
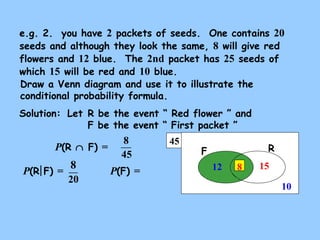
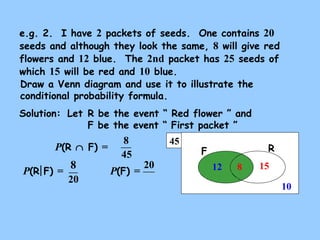
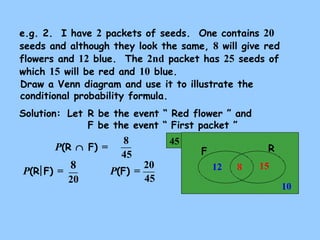
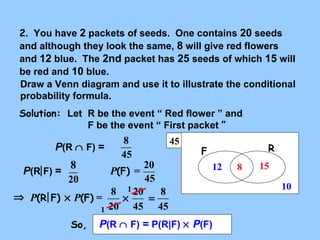
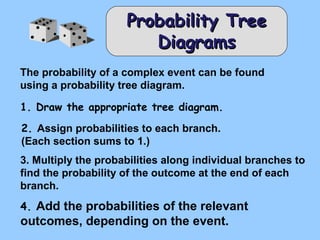
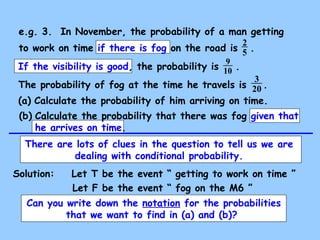
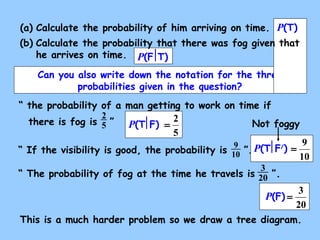
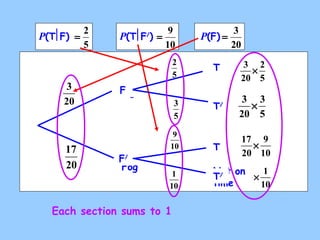
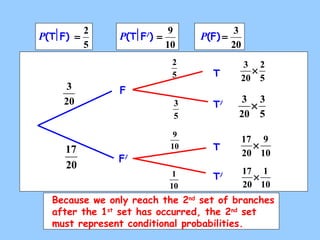
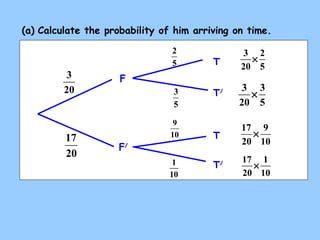
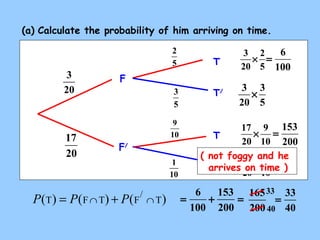
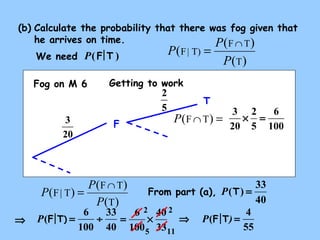
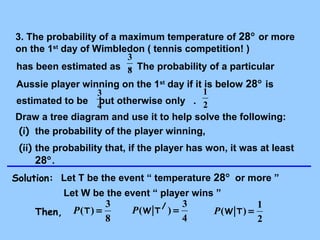
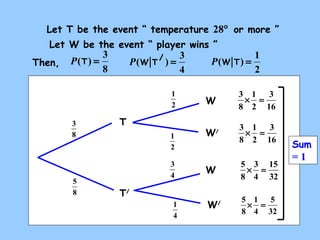
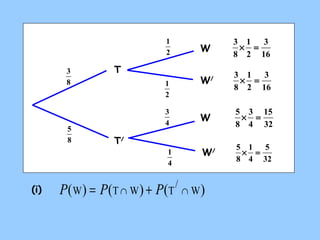
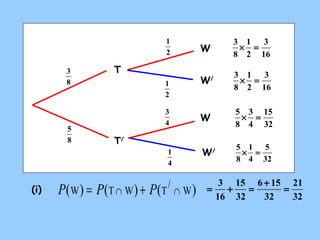
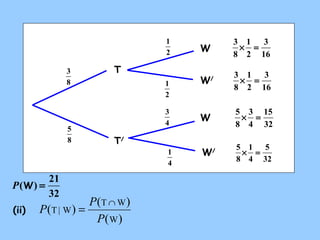
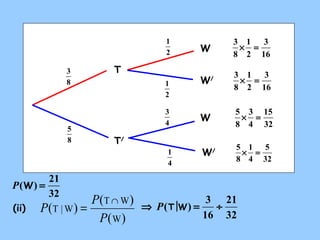
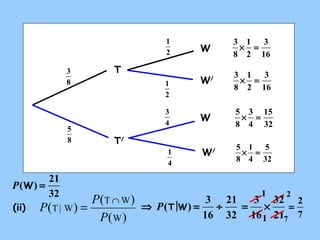
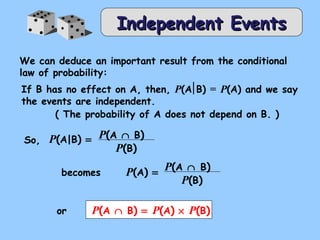
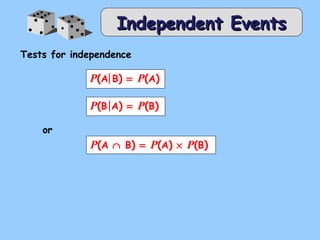
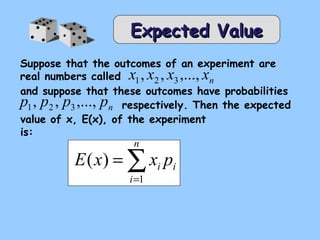
DDeeffiinniittiioonnss 
Probability is the mathematics of chance. 
It tells us the relative frequency with which we can 
expect an event to occur 
The greater the probability the more 
likely the event will occur. 
It can be written as a fraction, decimal, percent, 
or ratio.
DDeeffiinniittiioonnss 
Certain 
Impossible 
1 
.5 
0 
50/50 
Probability is the numerical 
measure of the likelihood that 
the event will occur. 
Value is between 0 and 1. 
Sum of the probabilities of all events 
is 1.
DDeeffiinniittiioonnss 
A probability experiment is an action through which 
specific results (counts, measurements, or responses) 
are obtained. 
The result of a single trial in a probability experiment 
is an outcome. 
The set of all possible outcomes of a probability 
experiment is the sample space, denoted as S. 
e.g. All 6 faces of a die: S = { 1 , 2 , 3 , 4 , 5 , 6 }
DDeeffiinniittiioonnss 
An event consists of one or more outcomes and is a 
subset of the sample space. 
Events are often represented by uppercase letters, 
such as A, B, or C. 
Notation: The probability that event E will occur is 
written P(E) and is read 
“the probability of event E.”
DDeeffiinniittiioonnss 
• The Probability of an Event, E: 
P(E) = 
Number of Event Outcomes 
Total Number of Possible Outcomes in S 
Consider a pair of Dice 
• Each of the Outcomes in the Sample Space are random 
ea.ngd. e qPu( a l ly li k e l y t o o)c c=u r. 
2 = 
1 
36 
18 
(There are 2 ways to get one 6 and the other 4)
DDeeffiinniittiioonnss 
There are three types of probability 
1. Theoretical Probability 
Theoretical probability is used when each outcome 
in a sample space is equally likely to occur. 
P(E) = 
Number of Event Outcomes 
Total Number of Possible Outcomes in S 
The Ultimate probability formula 
DDeeffiinniittiioonnss 
There are three types of probability 
2. Experimental Probability 
Experimental probability is based upon observations 
obtained from probability experiments. 
P(E) = 
Number of Event Occurrences 
Total Number of Observations 
The experimental probability of an event 
E is the relative frequency of event E
DDeeffiinniittiioonnss 
There are three types of probability 
3. Subjective Probability 
Subjective probability is a probability measure 
resulting from intuition, educated guesses, and 
estimates. 
Therefore, there is no formula to calculate it. 
Usually found by consulting an expert.
DDeeffiinniittiioonnss 
Law of Large Numbers. 
As an experiment is repeated over and over, the 
experimental probability of an event approaches 
the theoretical probability of the event. 
The greater the number of trials the more likely 
the experimental probability of an event will equal 
its theoretical probability.
CCoommpplliimmeennttaarryy EEvveennttss 
The complement of event E is the set of all 
outcomes in a sample space that are not included in 
event E. 
The complement of event E is denoted by 
Properties of Probability: 
E¢ or E 
P E 
£ £ 
0 ( ) 1 
P E P E 
+ = 
( ) ( ) 1 
P E = - 
P E 
( ) 1 ( ) 
P E = - 
P E 
( ) 1 ( )
TThhee MMuullttiipplliiccaattiioonn RRuullee 
If events A and B are independent, then the 
probability of two events, A and B occurring in a 
sequence (or simultaneously) is: 
P(Aand B) = P(AÇB) = P(A)´ P(B) 
This rule can extend to any number of independent 
events. 
Two events are independent if the occurrence of the 
first event does not affect the probability of the 
occurrence of the second event.
MMuuttuuaallllyy EExxcclluussiivvee 
Two events A and B are mutually exclusive if and 
only if: 
P(AÇB) = 0 
In a Venn diagram this means that event A is 
disjoint from event B. 
A B A B 
A and B are M.E. 
A and B are not M.E.
TThhee AAddddiittiioonn RRuullee 
The probability that at least one of the events A 
or B will occur, P(A or B), is given by: 
P(Aor B) = P(AÈB) = P(A) + P(B) - P(AÇB) 
If events A and B are mutually exclusive, then the 
addition rule is simplified to: 
P(Aor B) = P(AÈB) = P(A) + P(B) 
This simplified rule can be extended to any number 
of mutually exclusive events.
CCoonnddiittiioonnaall PPrroobbaabbiilliittyy 
Conditional probability is the probability of an event 
occurring, given that another event has already 
occurred. 
Conditional probability restricts the sample space. 
The conditional probability of event B occurring, 
given that event A has occurred, is denoted by P(B| 
A) and is read as “probability of B, given A.”
CCoonnddiittiioonnaall PPrroobbaabbiilliittyy 
Formula for Conditional Probability 
P A B = P AÇB = Ç 
or P B A P B A 
( | ) ( ) 
( ) 
( | ) ( ) 
( ) 
P A 
P B
CCoonnddiittiioonnaall PPrroobbaabbiilliittyy 
e.g. There are 2 red and 3 blue counters in a bag 
and, without looking, we take out one counter and 
do not replace it. 
The probability of a 2nd counter taken from the bag 
being red depends on whether the 1st was red or 
blue. 
Conditional probability problems can be solved by 
considering the individual possibilities or by using a 
table, a Venn diagram, a tree diagram or a formula. 
Harder problems are best solved by using a formula 
together with a tree diagram.
e.g. 1. The following table gives data on the type of car, 
grouped by petrol consumption, owned by 100 people. 
Low Medium High 
Male 12 33 7 
Female 23 21 4 
One person is selected at random. 
Total 
100 
L is the event “the person owns a low rated car”
e.g. 1. The following table gives data on the type of car, 
grouped by petrol consumption, owned by 100 people. 
Female 
Low 
Male 
Medium High 
12 33 7 
23 21 4 
One person is selected at random. 
Total 
100 
L is the event “the person owns a low rated car” 
F is the event “a female is chosen”.
e.g. 1. The following table gives data on the type of car, 
grouped by petrol consumption, owned by 100 people. 
Female 
Low 
Male 
Medium High 
12 33 7 
23 21 4 
One person is selected at random. 
Total 
100 
L is the event “the person owns a low rated car” 
F is the event “a female is chosen”.
e.g. 1. The following table gives data on the type of car, 
grouped by petrol consumption, owned by 100 people. 
Female 
Low 
Male 
Medium High 
12 33 7 
23 21 4 
One person is selected at random. 
Total 
100 
L is the event “the person owns a low rated car” 
F is the event “a female is chosen”. 
Find (i) P(L) (ii) P(F Ç L) (iii) P(F L) 
There is no need for a Venn diagram or a formula to 
solve this type of problem. 
We just need to be careful which row or column we look at.
Low 
Medium High Total 
Male 12 
33 7 
Female 23 
21 4 
100 
Solution: 
Find (i) P(L) (ii) P(F Ç L) (iii) P(F L) 
(i) P(L) = 
35 
(Best to leave the answers as fractions) 
7 = 
35 7 
100 
20 20
Solution: 
Low Medium High 
Male 12 33 7 
Find (i) P(L) (ii) P(F Ç L) (iii) P(F L) 
(i) P(L) = 
100 
Female 23 
21 4 
7 = 
35 7 
100 
20 20 
(ii) P(F Ç L) = The probability of selecting a 
female with a low rated car. 
23 
Total 
100
Solution: 
Low Medium High 
Male 12 
33 7 
Female 23 
21 4 
Find (i) P(L) (ii) P(F Ç L) (iii) P(F L) 
(i) P(L) = 
35 100 
7 = 
35 7 
100 
20 20 
(ii) P(F Ç L) = 
23 
Total 
100 
23 We must be careful with the 
(iii) P(F L) = The probability of selecting a 
denominators female given the in (ii) car and is (low iii). rated. 
Here 
we are given the car is low rated. 
We want the total of that column. 
35 
The sample space is restricted 
from 100 to 35.
Solution: 
Low Medium High 
Male 12 33 7 
Find (i) P(L) (ii) P(F Ç L) (iii) P(F L) 
(i) P(L) = 
100 
Female 23 21 4 
7 = 
35 7 
100 
20 20 
(ii) P(F Ç L) = 
23 
Total 
100 
(iii) P(F L) = 
23 
Notice that 
P(L) ´ P(F L) 
23 
35 
= 7 ´ 
20 
= 23 
100 
= P(F Ç L) 
So, P(F Ç L) = P(F|L) ´ P(L) 
35 
5 
1
e.g. 2. you have 2 packets of seeds. One contains 20 
seeds and although they look the same, 8 will give red 
flowers and 12 blue. The 2nd packet has 25 seeds of 
which 15 will be red and 10 blue. 
Draw a Venn diagram and use it to illustrate the 
conditional probability formula. 
Solution: Let R be the event “ Red flower ” and 
F be the event “ First packet ” 
F R 
Red in the 1st packet
e.g. 2. I have 2 packets of seeds. One contains 20 
seeds and although they look the same, 8 will give red 
flowers and 12 blue. The 2nd packet has 25 seeds of 
which 15 will be red and 10 blue. 
Draw a Venn diagram and use it to illustrate the 
conditional probability formula. 
Solution: 
Let R be the event “ Red flower ” and 
F be the event “ First packet ” 
F R 
8 
Blue in the 1st packet
e.g. 2. I have 2 packets of seeds. One contains 20 
seeds and although they look the same, 8 will give red 
flowers and 12 blue. The 2nd packet has 25 seeds of 
which 15 will be red and 10 blue. 
Draw a Venn diagram and use it to illustrate the 
conditional probability formula. 
Solution: 
Let R be the event “ Red flower ” and 
F be the event “ First packet ” 
F R 
12 8 
Red in the 2nd packet
e.g. 2. You have 2 packets of seeds. One contains 20 
seeds and although they look the same, 8 will give red 
flowers and 12 blue. The 2nd packet has 25 seeds of 
which 15 will be red and 10 blue. 
Draw a Venn diagram and use it to illustrate the 
conditional probability formula. 
Solution: 
Let R be the event “ Red flower ” and 
F be the event “ First packet ” 
F R 
12 8 15 
Red in the 2nd packet
e.g. 2. I have 2 packets of seeds. One contains 20 
seeds and although they look the same, 8 will give red 
flowers and 12 blue. The 2nd packet has 25 seeds of 
which 15 will be red and 10 blue. 
Draw a Venn diagram and use it to illustrate the 
conditional probability formula. 
Solution: 
Let R be the event “ Red flower ” and 
F be the event “ First packet ” 
F R 
12 8 15 
Blue in the 2nd packet
e.g. 2. I have 2 packets of seeds. One contains 20 
seeds and although they look the same, 8 will give red 
flowers and 12 blue. The 2nd packet has 25 seeds of 
which 15 will be red and 10 blue. 
Draw a Venn diagram and use it to illustrate the 
conditional probability formula. 
Solution: 
Let R be the event “ Red flower ” and 
F be the event “ First packet ” 
F R 
15 
10 
12 8 
Total: 20 + 25
e.g. 2. I have 2 packets of seeds. One contains 20 
seeds and although they look the same, 8 will give red 
flowers and 12 blue. The 2nd packet has 25 seeds of 
which 15 will be red and 10 blue. 
Draw a Venn diagram and use it to illustrate the 
conditional probability formula. 
Solution: 
Let R be the event “ Red flower ” and 
F be the event “ First packet ” 
45 
F R 
15 
10 
12 8
e.g. 2. I have 2 packets of seeds. One contains 20 
seeds and although they look the same, 8 will give red 
flowers and 12 blue. The 2nd packet has 25 seeds of 
which 15 will be red and 10 blue. 
Draw a Venn diagram and use it to illustrate the 
conditional probability formula. 
Solution: 
Let R be the event “ Red flower ” and 
F be the event “ First packet ” 
45 F R 
15 
10 
12 8 
P(R Ç F) =
e.g. 2. I have 2 packets of seeds. One contains 20 
seeds and although they look the same, 8 will give red 
flowers and 12 blue. The 2nd packet has 25 seeds of 
which 15 will be red and 10 blue. 
Draw a Venn diagram and use it to illustrate the 
conditional probability formula. 
Solution: 
Let R be the event “ Red flower ” and 
F be the event “ First packet ” 
8 45 F R 
15 
10 
12 8 
P(R Ç F) = 
45
e.g. 2. I have 2 packets of seeds. One contains 20 
seeds and although they look the same, 8 will give red 
flowers and 12 blue. The 2nd packet has 25 seeds of 
which 15 will be red and 10 blue. 
Draw a Venn diagram and use it to illustrate the 
conditional probability formula. 
Solution: 
Let R be the event “ Red flower ” and 
F be the event “ First packet ” 
45 F R 
15 
10 
12 
P(R Ç F) = 
P(R F) = 8 
8 
45 
8
e.g. 2. you have 2 packets of seeds. One contains 20 
seeds and although they look the same, 8 will give red 
flowers and 12 blue. The 2nd packet has 25 seeds of 
which 15 will be red and 10 blue. 
Draw a Venn diagram and use it to illustrate the 
conditional probability formula. 
Solution: 
Let R be the event “ Red flower ” and 
F be the event “ First packet ” 
45 F R 
15 
10 
12 
P(R Ç F) = 
8 
45 
P(R F) = 8 P(F) = 
20 
8
e.g. 2. I have 2 packets of seeds. One contains 20 
seeds and although they look the same, 8 will give red 
flowers and 12 blue. The 2nd packet has 25 seeds of 
which 15 will be red and 10 blue. 
Draw a Venn diagram and use it to illustrate the 
conditional probability formula. 
Solution: 
Let R be the event “ Red flower ” and 
F be the event “ First packet ” 
45 F R 
15 
10 
12 
P(R Ç F) = 
8 
45 
P(R F) = 8 P(F) = 20 
20 
8 
45
2. You have 2 packets of seeds. One contains 20 seeds 
and although they look the same, 8 will give red flowers 
and 12 blue. The 2nd packet has 25 seeds of which 15 will 
be red and 10 blue. 
Draw a Venn diagram and use it to illustrate the conditional 
probability formula. 
Solution: 
Let R be the event “ Red flower ” and 
F be the event “ First packet ” 
45 F R 
15 
10 
12 
P(R Ç F) = 
8 
45 
P(R F) = 8 P(F) = 
20 
8 
20 
45 
1 
8 ´ 
20 
Þ P(R F) ´ P(F) = 
20 
45 
= 8 
45 
1 
So, P(R Ç F) = P(R|F) ´ P(F)
PPrroobbaabbiilliittyy TTrreeee 
DDiiaaggrraammss 
The probability of a complex event can be found 
using a probability tree diagram. 
1. Draw the appropriate tree diagram. 
2. Assign probabilities to each branch. 
(Each section sums to 1.) 
3. Multiply the probabilities along individual branches to 
find the probability of the outcome at the end of each 
branch. 
4. Add the probabilities of the relevant 
outcomes, depending on the event.
E.g. 3. In November, the probability of a man getting to 
2 
work on time if there is fog on the road is 5 . 
If the visibility is good, the probability is 9 . 
10 
The probability of fog at the time he travels is 3 20 
. 
(a) Calculate the probability of him arriving on time. 
(b) Calculate the probability that there was fog given that 
he arrives on time. 
There are lots of clues in the question to tell us we are 
dealing with conditional probability.
e.g. 3. In November, the probability of a man getting 
to work on time if there is fog on the road is 2 
5 . 
9 
If the visibility is good, the probability is 10 
. 
The probability of fog at the time he travels is 3 
20 
. 
(a) Calculate the probability of him arriving on time. 
(b) Calculate the probability that there was fog given that 
he arrives on time. 
There are lots of clues in the question to tell us we are 
dealing with conditional probability. 
Solution: Let T be the event “ getting to work on time ” 
Let F be the event “ fog on the M6 ” 
Can you write down the notation for the probabilities 
that we want to find in (a) and (b)?
(a) Calculate the probability of him arriving on time. 
(b) Calculate the probability that there was fog given that 
P(F T) 
P(T) 
he arrives on time. 
Can you also write down the notation for the three 
“ the probability of a man getting to work on time if 
there is fog is 2 
5 ” 
P(T F) = 2 
5 
Not foggy 
“ If the visibility is good, the probability is 9 ”. 
10 
P(T F/) = 9 
“ The probability of fog at the time he travels is 3 ”. 
20 
probabilities given in the question? 
10 
P(F) = 3 
20 
This is a much harder problem so we draw a tree diagram.
P(T F/) = 9 
2 
5 
P(T F) = 2 
3 
20 
17 
20 
3 
9 
10 
1 
10 
2 
5 
3 ´ 
20 
3 
5 
3 ´ 
20 
9 
10 
17 ´ 
20 
1 
10 
17 ´ 
20 
Fog 
P(F) = 3 
No 
Fog Not on 
time 
5 
10 
20 
5 
F 
F/ 
T 
T/ 
T 
T/ 
Each section sums to 1
P(T F) = 2 
5 
P(T F/) = 9 
10 
P(F) = 3 
20 
2 
5 
3 
20 
17 
20 
3 
9 
10 
1 
10 
2 
5 
3 ´ 
20 
3 
5 
3 ´ 
20 
9 
10 
17 ´ 
20 
1 
10 
17 ´ 
20 
5 
F 
F/ 
T 
T/ 
T 
T/ 
Because we only reach the 2nd set of branches 
after the 1st set has occurred, the 2nd set 
must represent conditional probabilities.
(a) Calculate the probability of him arriving on time. 
2 
5 
3 
20 
17 
20 
3 
9 
10 
1 
10 
2 
5 
3 ´ 
20 
3 
5 
3 ´ 
20 
9 
10 
17 ´ 
20 
1 
10 
17 ´ 
20 
5 
F 
F/ 
T 
T/ 
T 
T/
(a) Calculate the probability of him arriving on time. 
2 
5 
3 
20 
17 
20 
3 
9 
10 
1 
10 
2 
3 
5 
3 ´ 
3 ´ 
20 
6 = 
9 
10 
17 ´ 
20 
1 
10 
17 ´ 
20 
5 
F 
F/ 
T 
T/ 
T 
T/ 
5 
20 
100 
( foggy and he 
arrives on time )
2 
5 
3 
20 
17 
20 
3 
9 
10 
1 
10 
2 
3 
5 
3 ´ 
3 ´ 
20 
5 
F 
F/ 
T 
T/ 
T 
( not foggy and he 
arrives T/ 
on time ) 
6 = 
9 
10 
17 ´ 
20 
1 
10 
17 ´ 
20 
5 
20 
100 
(a) Calculate the probability of him arriving on time. 
= 153 
200 
153 
6 
P ( 165 33 
T ) = P ( F Ç T ) + P ( F/ Ç T ) = + = 
200 
100 
200 
= 33 
40 40
(b) Calculate the probability that there was fog given that 
P P Ç = 
( ( ) 
Fog on M 6 Getting to work 
F 
T 
3 
20 
2 
5 
F T 
( ) 
3 ´ 2 
= 
P(F Ç T) = 100 
From part (a), P(T) = 33 
40 
6 
5 
20 
he arrives on time. 
We need 
P( F T ) 
P P Ç = 
( ) ( F T 
) 
( T 
) 
F | T 
P 
Þ P(F T) = 4 
55 
T 
F | T) 
P 
Þ 
33 
40 
( = 6 ¸ P F T) 
100 
2 2 
40 
33 
= 6 ´ 
100 
5 
11
3. The probability of a maximum temperature of 28° or more 
on the 1st day of Wimbledon ( tennis competition! ) 
3 
has been estimated as 8 
. The probability of a particular 
Aussie player winning on the 1st day if it is below 28° is 
3 
1 
estimated to be 4 
but otherwise only . 
2 
Draw a tree diagram and use it to help solve the following: 
(i) the probability of the player winning, 
(ii) the probability that, if the player has won, it was at least 
28°. 
Solution: Let T be the event “ temperature 28° or more ” 
Let W be the event “ player wins ” 
( ) = 3 Then, P T 4 
8 
( / ) = 3 P W T 
( ) = 1 P W T 
2
( ) = 3 Then, P T 
3 
8 
( / ) = 3 P W T 
1 
2 
1 
2 
3 
4 
1 
4 
3 
16 
( ) = 1 P W T 
3 ´ 1 
= 
2 
8 
3 
16 
3 ´ 1 
= 
2 
8 
15 
32 
5 ´ 3 
= 
4 
8 
5 
32 
5 1 
´ = 
4 
8 
5 
8 
W 
W/ 
Sum 
= 1 
Let T be the event “ temperature 28° or more ” 
Let W be the event “ player wins ” 
8 
4 
2 
T 
T/ 
W 
W/
3 
8 
1 
2 
1 
2 
3 
4 
1 
4 
5 
W/ 
(i) P(W) = P(T Ç W) + P(T/ Ç W) 
3 
16 
3 ´ 1 
= 
2 
8 
3 
16 
3 ´ 1 
= 
2 
8 
15 
32 
5 ´ 3 
= 
4 
8 
5 
32 
5 1 
´ = 
4 
8 
8 
W 
T 
T/ 
W 
W/
21 
32 
3 
1 
1 
3 
1 
3 
3 ´ 1 
= 
3 
3 ´ 1 
= 
15 
5 ´ 3 
= 
5 
5 1 
´ = 
5 
W/ 
(i) P(W) = P(W) + P(T/ W) 3 6 + 15 
T Ç Ç = + = = 
32 
15 
32 
16 
8 
2 
2 
4 
4 
16 
2 
8 
16 
2 
8 
32 
4 
8 
32 
4 
8 
8 
W 
T 
T/ 
W 
W/
P(W) = 21 
32 
3 
8 
1 
2 
1 
2 
3 
4 
1 
4 
3 
16 
3 ´ 1 
= 
2 
8 
3 
16 
3 ´ 1 
= 
2 
8 
15 
32 
5 ´ 3 
= 
4 
8 
5 
32 
5 1 
´ = 
4 
8 
5 
8 
W 
T 
T/ 
W/ 
W 
W/ 
P P Ç (ii) = 
( ) ( T W 
) 
( W 
) 
T | W 
P
P(W) = 21 
32 
3 
1 
1 
3 
1 
3 ´ = 
3 ´ = 
5 ´ = 
5 ´ = 
5 
W/ 
P ( ) = P ( T Ç W 
) 
(ii) 32 
( W 
) 
T | W 
P 
21 
Þ ( ) = 3 ¸ P T W 
16 
8 
2 
2 
4 
4 
3 
16 
1 
2 
8 
3 
16 
1 
2 
8 
15 
32 
3 
4 
8 
5 
32 
1 
4 
8 
8 
W 
T 
T/ 
W 
W/
1 2 
2 = 
7 
P(W) = 21 
32 
3 
5 
P P Ç (ii) = 
( ) ( T W 
) 
( W 
) 
T | W 
P 
32 
21 
3 
3 ´ 1 
= 
3 
3 ´ 1 
= 
15 
5 ´ 3 
= 
5 
5 1 
´ = 
= 3 ´ 
16 
8 
1 
2 
1 
2 
3 
4 
1 
4 
16 
2 
8 
16 
2 
8 
32 
4 
8 
32 
4 
8 
8 
W 
T 
T/ 
W/ 
W 
W/ 
7 
21 
32 1 
Þ ( ) = 3 ¸ P T W 
16
IInnddeeppeennddeenntt EEvveennttss 
We can deduce an important result from the conditional 
law of probability: 
If B has no effect on A, then, P(A B) = P(A) and we say 
the events are independent. 
( The probability of A does not depend on B. ) 
So, P(A|B) = P(A Ç B) 
P(B) 
becomes P(A) = P(A Ç B) 
P(B) 
or P(A Ç B) = P(A) ´ P(B)
Tests for independence 
P(A B) = P(A) 
P(A Ç B) = P(A) ´ P(B) 
or 
IInnddeeppeennddeenntt EEvveennttss 
P(B A) = P(B)
n x , x , x ,..., x 1 2 3 
n p , p , p ,..., p 1 2 3 
value of x, E(x), of the experiment 
is: 
å= 
E x = 
x p 
i i n 
i 
1 
( ) 
EExxppeecctteedd VVaalluuee 
Suppose that the outcomes of an experiment are 
real numbers called 
and suppose that these outcomes have probabilities 
respectively. Then the expected
EExxppeecctteedd VVaalluuee 
Example 
At a raffle, 1500 tickets are sold at $2 each for 
four prizes of $500, $250, $150, and $75. What 
is the expected value of your gain if you play? 
Gain $498 $248 $148 $73 -$2 
P(x) 
1 
1500 
1 
1500 
1 
1500 
1 
1500 
1496 
1500 
( ) 498 1 
E x = ´ + ´ + ´ + ´ + - ´ 
$1.35 
2 1496 
1500 
73 1 
1500 
148 1 
1500 
248 1 
1500 
1500 
= -

Probability 2(final)

  • 1.
    DDeeffiinniittiioonnss Probability isthe mathematics of chance. It tells us the relative frequency with which we can expect an event to occur The greater the probability the more likely the event will occur. It can be written as a fraction, decimal, percent, or ratio.
  • 2.
    DDeeffiinniittiioonnss Certain Impossible 1 .5 0 50/50 Probability is the numerical measure of the likelihood that the event will occur. Value is between 0 and 1. Sum of the probabilities of all events is 1.
  • 3.
    DDeeffiinniittiioonnss A probabilityexperiment is an action through which specific results (counts, measurements, or responses) are obtained. The result of a single trial in a probability experiment is an outcome. The set of all possible outcomes of a probability experiment is the sample space, denoted as S. e.g. All 6 faces of a die: S = { 1 , 2 , 3 , 4 , 5 , 6 }
  • 4.
    DDeeffiinniittiioonnss An eventconsists of one or more outcomes and is a subset of the sample space. Events are often represented by uppercase letters, such as A, B, or C. Notation: The probability that event E will occur is written P(E) and is read “the probability of event E.”
  • 5.
    DDeeffiinniittiioonnss • TheProbability of an Event, E: P(E) = Number of Event Outcomes Total Number of Possible Outcomes in S Consider a pair of Dice • Each of the Outcomes in the Sample Space are random ea.ngd. e qPu( a l ly li k e l y t o o)c c=u r. 2 = 1 36 18 (There are 2 ways to get one 6 and the other 4)
  • 6.
    DDeeffiinniittiioonnss There arethree types of probability 1. Theoretical Probability Theoretical probability is used when each outcome in a sample space is equally likely to occur. P(E) = Number of Event Outcomes Total Number of Possible Outcomes in S The Ultimate probability formula 
  • 7.
    DDeeffiinniittiioonnss There arethree types of probability 2. Experimental Probability Experimental probability is based upon observations obtained from probability experiments. P(E) = Number of Event Occurrences Total Number of Observations The experimental probability of an event E is the relative frequency of event E
  • 8.
    DDeeffiinniittiioonnss There arethree types of probability 3. Subjective Probability Subjective probability is a probability measure resulting from intuition, educated guesses, and estimates. Therefore, there is no formula to calculate it. Usually found by consulting an expert.
  • 9.
    DDeeffiinniittiioonnss Law ofLarge Numbers. As an experiment is repeated over and over, the experimental probability of an event approaches the theoretical probability of the event. The greater the number of trials the more likely the experimental probability of an event will equal its theoretical probability.
  • 10.
    CCoommpplliimmeennttaarryy EEvveennttss Thecomplement of event E is the set of all outcomes in a sample space that are not included in event E. The complement of event E is denoted by Properties of Probability: E¢ or E P E £ £ 0 ( ) 1 P E P E + = ( ) ( ) 1 P E = - P E ( ) 1 ( ) P E = - P E ( ) 1 ( )
  • 11.
    TThhee MMuullttiipplliiccaattiioonn RRuullee If events A and B are independent, then the probability of two events, A and B occurring in a sequence (or simultaneously) is: P(Aand B) = P(AÇB) = P(A)´ P(B) This rule can extend to any number of independent events. Two events are independent if the occurrence of the first event does not affect the probability of the occurrence of the second event.
  • 12.
    MMuuttuuaallllyy EExxcclluussiivvee Twoevents A and B are mutually exclusive if and only if: P(AÇB) = 0 In a Venn diagram this means that event A is disjoint from event B. A B A B A and B are M.E. A and B are not M.E.
  • 13.
    TThhee AAddddiittiioonn RRuullee The probability that at least one of the events A or B will occur, P(A or B), is given by: P(Aor B) = P(AÈB) = P(A) + P(B) - P(AÇB) If events A and B are mutually exclusive, then the addition rule is simplified to: P(Aor B) = P(AÈB) = P(A) + P(B) This simplified rule can be extended to any number of mutually exclusive events.
  • 14.
    CCoonnddiittiioonnaall PPrroobbaabbiilliittyy Conditionalprobability is the probability of an event occurring, given that another event has already occurred. Conditional probability restricts the sample space. The conditional probability of event B occurring, given that event A has occurred, is denoted by P(B| A) and is read as “probability of B, given A.”
  • 15.
    CCoonnddiittiioonnaall PPrroobbaabbiilliittyy Formulafor Conditional Probability P A B = P AÇB = Ç or P B A P B A ( | ) ( ) ( ) ( | ) ( ) ( ) P A P B
  • 16.
    CCoonnddiittiioonnaall PPrroobbaabbiilliittyy e.g.There are 2 red and 3 blue counters in a bag and, without looking, we take out one counter and do not replace it. The probability of a 2nd counter taken from the bag being red depends on whether the 1st was red or blue. Conditional probability problems can be solved by considering the individual possibilities or by using a table, a Venn diagram, a tree diagram or a formula. Harder problems are best solved by using a formula together with a tree diagram.
  • 17.
    e.g. 1. Thefollowing table gives data on the type of car, grouped by petrol consumption, owned by 100 people. Low Medium High Male 12 33 7 Female 23 21 4 One person is selected at random. Total 100 L is the event “the person owns a low rated car”
  • 18.
    e.g. 1. Thefollowing table gives data on the type of car, grouped by petrol consumption, owned by 100 people. Female Low Male Medium High 12 33 7 23 21 4 One person is selected at random. Total 100 L is the event “the person owns a low rated car” F is the event “a female is chosen”.
  • 19.
    e.g. 1. Thefollowing table gives data on the type of car, grouped by petrol consumption, owned by 100 people. Female Low Male Medium High 12 33 7 23 21 4 One person is selected at random. Total 100 L is the event “the person owns a low rated car” F is the event “a female is chosen”.
  • 20.
    e.g. 1. Thefollowing table gives data on the type of car, grouped by petrol consumption, owned by 100 people. Female Low Male Medium High 12 33 7 23 21 4 One person is selected at random. Total 100 L is the event “the person owns a low rated car” F is the event “a female is chosen”. Find (i) P(L) (ii) P(F Ç L) (iii) P(F L) There is no need for a Venn diagram or a formula to solve this type of problem. We just need to be careful which row or column we look at.
  • 21.
    Low Medium HighTotal Male 12 33 7 Female 23 21 4 100 Solution: Find (i) P(L) (ii) P(F Ç L) (iii) P(F L) (i) P(L) = 35 (Best to leave the answers as fractions) 7 = 35 7 100 20 20
  • 22.
    Solution: Low MediumHigh Male 12 33 7 Find (i) P(L) (ii) P(F Ç L) (iii) P(F L) (i) P(L) = 100 Female 23 21 4 7 = 35 7 100 20 20 (ii) P(F Ç L) = The probability of selecting a female with a low rated car. 23 Total 100
  • 23.
    Solution: Low MediumHigh Male 12 33 7 Female 23 21 4 Find (i) P(L) (ii) P(F Ç L) (iii) P(F L) (i) P(L) = 35 100 7 = 35 7 100 20 20 (ii) P(F Ç L) = 23 Total 100 23 We must be careful with the (iii) P(F L) = The probability of selecting a denominators female given the in (ii) car and is (low iii). rated. Here we are given the car is low rated. We want the total of that column. 35 The sample space is restricted from 100 to 35.
  • 24.
    Solution: Low MediumHigh Male 12 33 7 Find (i) P(L) (ii) P(F Ç L) (iii) P(F L) (i) P(L) = 100 Female 23 21 4 7 = 35 7 100 20 20 (ii) P(F Ç L) = 23 Total 100 (iii) P(F L) = 23 Notice that P(L) ´ P(F L) 23 35 = 7 ´ 20 = 23 100 = P(F Ç L) So, P(F Ç L) = P(F|L) ´ P(L) 35 5 1
  • 25.
    e.g. 2. youhave 2 packets of seeds. One contains 20 seeds and although they look the same, 8 will give red flowers and 12 blue. The 2nd packet has 25 seeds of which 15 will be red and 10 blue. Draw a Venn diagram and use it to illustrate the conditional probability formula. Solution: Let R be the event “ Red flower ” and F be the event “ First packet ” F R Red in the 1st packet
  • 26.
    e.g. 2. Ihave 2 packets of seeds. One contains 20 seeds and although they look the same, 8 will give red flowers and 12 blue. The 2nd packet has 25 seeds of which 15 will be red and 10 blue. Draw a Venn diagram and use it to illustrate the conditional probability formula. Solution: Let R be the event “ Red flower ” and F be the event “ First packet ” F R 8 Red in the 1st packet
  • 27.
    e.g. 2. Ihave 2 packets of seeds. One contains 20 seeds and although they look the same, 8 will give red flowers and 12 blue. The 2nd packet has 25 seeds of which 15 will be red and 10 blue. Draw a Venn diagram and use it to illustrate the conditional probability formula. Solution: Let R be the event “ Red flower ” and F be the event “ First packet ” F R 8 Blue in the 1st packet
  • 28.
    e.g. 2. Ihave 2 packets of seeds. One contains 20 seeds and although they look the same, 8 will give red flowers and 12 blue. The 2nd packet has 25 seeds of which 15 will be red and 10 blue. Draw a Venn diagram and use it to illustrate the conditional probability formula. Solution: Let R be the event “ Red flower ” and F be the event “ First packet ” F R 12 8 Blue in the 1st packet
  • 29.
    e.g. 2. Ihave 2 packets of seeds. One contains 20 seeds and although they look the same, 8 will give red flowers and 12 blue. The 2nd packet has 25 seeds of which 15 will be red and 10 blue. Draw a Venn diagram and use it to illustrate the conditional probability formula. Solution: Let R be the event “ Red flower ” and F be the event “ First packet ” F R 12 8 Red in the 2nd packet
  • 30.
    e.g. 2. Youhave 2 packets of seeds. One contains 20 seeds and although they look the same, 8 will give red flowers and 12 blue. The 2nd packet has 25 seeds of which 15 will be red and 10 blue. Draw a Venn diagram and use it to illustrate the conditional probability formula. Solution: Let R be the event “ Red flower ” and F be the event “ First packet ” F R 12 8 15 Red in the 2nd packet
  • 31.
    e.g. 2. Ihave 2 packets of seeds. One contains 20 seeds and although they look the same, 8 will give red flowers and 12 blue. The 2nd packet has 25 seeds of which 15 will be red and 10 blue. Draw a Venn diagram and use it to illustrate the conditional probability formula. Solution: Let R be the event “ Red flower ” and F be the event “ First packet ” F R 12 8 15 Blue in the 2nd packet
  • 32.
    e.g. 2. Ihave 2 packets of seeds. One contains 20 seeds and although they look the same, 8 will give red flowers and 12 blue. The 2nd packet has 25 seeds of which 15 will be red and 10 blue. Draw a Venn diagram and use it to illustrate the conditional probability formula. Solution: Let R be the event “ Red flower ” and F be the event “ First packet ” F R 15 10 12 8 Blue in the 2nd packet
  • 33.
    e.g. 2. Ihave 2 packets of seeds. One contains 20 seeds and although they look the same, 8 will give red flowers and 12 blue. The 2nd packet has 25 seeds of which 15 will be red and 10 blue. Draw a Venn diagram and use it to illustrate the conditional probability formula. Solution: Let R be the event “ Red flower ” and F be the event “ First packet ” F R 15 10 12 8 Total: 20 + 25
  • 34.
    e.g. 2. Ihave 2 packets of seeds. One contains 20 seeds and although they look the same, 8 will give red flowers and 12 blue. The 2nd packet has 25 seeds of which 15 will be red and 10 blue. Draw a Venn diagram and use it to illustrate the conditional probability formula. Solution: Let R be the event “ Red flower ” and F be the event “ First packet ” 45 F R 15 10 12 8 Total: 20 + 25
  • 35.
    e.g. 2. Ihave 2 packets of seeds. One contains 20 seeds and although they look the same, 8 will give red flowers and 12 blue. The 2nd packet has 25 seeds of which 15 will be red and 10 blue. Draw a Venn diagram and use it to illustrate the conditional probability formula. Solution: Let R be the event “ Red flower ” and F be the event “ First packet ” 45 F R 15 10 12 8
  • 36.
    e.g. 2. Ihave 2 packets of seeds. One contains 20 seeds and although they look the same, 8 will give red flowers and 12 blue. The 2nd packet has 25 seeds of which 15 will be red and 10 blue. Draw a Venn diagram and use it to illustrate the conditional probability formula. Solution: Let R be the event “ Red flower ” and F be the event “ First packet ” 45 F R 15 10 12 8 P(R Ç F) =
  • 37.
    e.g. 2. Ihave 2 packets of seeds. One contains 20 seeds and although they look the same, 8 will give red flowers and 12 blue. The 2nd packet has 25 seeds of which 15 will be red and 10 blue. Draw a Venn diagram and use it to illustrate the conditional probability formula. Solution: Let R be the event “ Red flower ” and F be the event “ First packet ” 8 45 F R 15 10 12 8 P(R Ç F) =
  • 38.
    e.g. 2. Ihave 2 packets of seeds. One contains 20 seeds and although they look the same, 8 will give red flowers and 12 blue. The 2nd packet has 25 seeds of which 15 will be red and 10 blue. Draw a Venn diagram and use it to illustrate the conditional probability formula. Solution: Let R be the event “ Red flower ” and F be the event “ First packet ” 8 45 F R 15 10 12 8 P(R Ç F) = 45
  • 39.
    e.g. 2. Ihave 2 packets of seeds. One contains 20 seeds and although they look the same, 8 will give red flowers and 12 blue. The 2nd packet has 25 seeds of which 15 will be red and 10 blue. Draw a Venn diagram and use it to illustrate the conditional probability formula. Solution: Let R be the event “ Red flower ” and F be the event “ First packet ” 45 F R 15 10 12 P(R Ç F) = P(R F) = 8 8 45 8
  • 40.
    e.g. 2. youhave 2 packets of seeds. One contains 20 seeds and although they look the same, 8 will give red flowers and 12 blue. The 2nd packet has 25 seeds of which 15 will be red and 10 blue. Draw a Venn diagram and use it to illustrate the conditional probability formula. Solution: Let R be the event “ Red flower ” and F be the event “ First packet ” 45 F R 15 10 12 P(R Ç F) = 8 45 P(R F) = 8 P(F) = 20 8
  • 41.
    e.g. 2. Ihave 2 packets of seeds. One contains 20 seeds and although they look the same, 8 will give red flowers and 12 blue. The 2nd packet has 25 seeds of which 15 will be red and 10 blue. Draw a Venn diagram and use it to illustrate the conditional probability formula. Solution: Let R be the event “ Red flower ” and F be the event “ First packet ” 45 F R 15 10 12 P(R Ç F) = 8 45 P(R F) = 8 P(F) = 20 20 8
  • 42.
    e.g. 2. Ihave 2 packets of seeds. One contains 20 seeds and although they look the same, 8 will give red flowers and 12 blue. The 2nd packet has 25 seeds of which 15 will be red and 10 blue. Draw a Venn diagram and use it to illustrate the conditional probability formula. Solution: Let R be the event “ Red flower ” and F be the event “ First packet ” 45 F R 15 10 12 P(R Ç F) = 8 45 P(R F) = 8 P(F) = 20 20 8 45
  • 43.
    2. You have2 packets of seeds. One contains 20 seeds and although they look the same, 8 will give red flowers and 12 blue. The 2nd packet has 25 seeds of which 15 will be red and 10 blue. Draw a Venn diagram and use it to illustrate the conditional probability formula. Solution: Let R be the event “ Red flower ” and F be the event “ First packet ” 45 F R 15 10 12 P(R Ç F) = 8 45 P(R F) = 8 P(F) = 20 8 20 45 1 8 ´ 20 Þ P(R F) ´ P(F) = 20 45 = 8 45 1 So, P(R Ç F) = P(R|F) ´ P(F)
  • 44.
    PPrroobbaabbiilliittyy TTrreeee DDiiaaggrraammss The probability of a complex event can be found using a probability tree diagram. 1. Draw the appropriate tree diagram. 2. Assign probabilities to each branch. (Each section sums to 1.) 3. Multiply the probabilities along individual branches to find the probability of the outcome at the end of each branch. 4. Add the probabilities of the relevant outcomes, depending on the event.
  • 45.
    E.g. 3. InNovember, the probability of a man getting to 2 work on time if there is fog on the road is 5 . If the visibility is good, the probability is 9 . 10 The probability of fog at the time he travels is 3 20 . (a) Calculate the probability of him arriving on time. (b) Calculate the probability that there was fog given that he arrives on time. There are lots of clues in the question to tell us we are dealing with conditional probability.
  • 46.
    e.g. 3. InNovember, the probability of a man getting to work on time if there is fog on the road is 2 5 . 9 If the visibility is good, the probability is 10 . The probability of fog at the time he travels is 3 20 . (a) Calculate the probability of him arriving on time. (b) Calculate the probability that there was fog given that he arrives on time. There are lots of clues in the question to tell us we are dealing with conditional probability. Solution: Let T be the event “ getting to work on time ” Let F be the event “ fog on the M6 ” Can you write down the notation for the probabilities that we want to find in (a) and (b)?
  • 47.
    (a) Calculate theprobability of him arriving on time. (b) Calculate the probability that there was fog given that P(F T) P(T) he arrives on time. Can you also write down the notation for the three “ the probability of a man getting to work on time if there is fog is 2 5 ” P(T F) = 2 5 Not foggy “ If the visibility is good, the probability is 9 ”. 10 P(T F/) = 9 “ The probability of fog at the time he travels is 3 ”. 20 probabilities given in the question? 10 P(F) = 3 20 This is a much harder problem so we draw a tree diagram.
  • 48.
    P(T F/) =9 2 5 P(T F) = 2 3 20 17 20 3 9 10 1 10 2 5 3 ´ 20 3 5 3 ´ 20 9 10 17 ´ 20 1 10 17 ´ 20 Fog P(F) = 3 No Fog Not on time 5 10 20 5 F F/ T T/ T T/ Each section sums to 1
  • 49.
    P(T F) =2 5 P(T F/) = 9 10 P(F) = 3 20 2 5 3 20 17 20 3 9 10 1 10 2 5 3 ´ 20 3 5 3 ´ 20 9 10 17 ´ 20 1 10 17 ´ 20 5 F F/ T T/ T T/ Because we only reach the 2nd set of branches after the 1st set has occurred, the 2nd set must represent conditional probabilities.
  • 50.
    (a) Calculate theprobability of him arriving on time. 2 5 3 20 17 20 3 9 10 1 10 2 5 3 ´ 20 3 5 3 ´ 20 9 10 17 ´ 20 1 10 17 ´ 20 5 F F/ T T/ T T/
  • 51.
    (a) Calculate theprobability of him arriving on time. 2 5 3 20 17 20 3 9 10 1 10 2 3 5 3 ´ 3 ´ 20 6 = 9 10 17 ´ 20 1 10 17 ´ 20 5 F F/ T T/ T T/ 5 20 100 ( foggy and he arrives on time )
  • 52.
    2 5 3 20 17 20 3 9 10 1 10 2 3 5 3 ´ 3 ´ 20 5 F F/ T T/ T ( not foggy and he arrives T/ on time ) 6 = 9 10 17 ´ 20 1 10 17 ´ 20 5 20 100 (a) Calculate the probability of him arriving on time. = 153 200 153 6 P ( 165 33 T ) = P ( F Ç T ) + P ( F/ Ç T ) = + = 200 100 200 = 33 40 40
  • 53.
    (b) Calculate theprobability that there was fog given that P P Ç = ( ( ) Fog on M 6 Getting to work F T 3 20 2 5 F T ( ) 3 ´ 2 = P(F Ç T) = 100 From part (a), P(T) = 33 40 6 5 20 he arrives on time. We need P( F T ) P P Ç = ( ) ( F T ) ( T ) F | T P Þ P(F T) = 4 55 T F | T) P Þ 33 40 ( = 6 ¸ P F T) 100 2 2 40 33 = 6 ´ 100 5 11
  • 54.
    3. The probabilityof a maximum temperature of 28° or more on the 1st day of Wimbledon ( tennis competition! ) 3 has been estimated as 8 . The probability of a particular Aussie player winning on the 1st day if it is below 28° is 3 1 estimated to be 4 but otherwise only . 2 Draw a tree diagram and use it to help solve the following: (i) the probability of the player winning, (ii) the probability that, if the player has won, it was at least 28°. Solution: Let T be the event “ temperature 28° or more ” Let W be the event “ player wins ” ( ) = 3 Then, P T 4 8 ( / ) = 3 P W T ( ) = 1 P W T 2
  • 55.
    ( ) =3 Then, P T 3 8 ( / ) = 3 P W T 1 2 1 2 3 4 1 4 3 16 ( ) = 1 P W T 3 ´ 1 = 2 8 3 16 3 ´ 1 = 2 8 15 32 5 ´ 3 = 4 8 5 32 5 1 ´ = 4 8 5 8 W W/ Sum = 1 Let T be the event “ temperature 28° or more ” Let W be the event “ player wins ” 8 4 2 T T/ W W/
  • 56.
    3 8 1 2 1 2 3 4 1 4 5 W/ (i) P(W) = P(T Ç W) + P(T/ Ç W) 3 16 3 ´ 1 = 2 8 3 16 3 ´ 1 = 2 8 15 32 5 ´ 3 = 4 8 5 32 5 1 ´ = 4 8 8 W T T/ W W/
  • 57.
    21 32 3 1 1 3 1 3 3 ´ 1 = 3 3 ´ 1 = 15 5 ´ 3 = 5 5 1 ´ = 5 W/ (i) P(W) = P(W) + P(T/ W) 3 6 + 15 T Ç Ç = + = = 32 15 32 16 8 2 2 4 4 16 2 8 16 2 8 32 4 8 32 4 8 8 W T T/ W W/
  • 58.
    P(W) = 21 32 3 8 1 2 1 2 3 4 1 4 3 16 3 ´ 1 = 2 8 3 16 3 ´ 1 = 2 8 15 32 5 ´ 3 = 4 8 5 32 5 1 ´ = 4 8 5 8 W T T/ W/ W W/ P P Ç (ii) = ( ) ( T W ) ( W ) T | W P
  • 59.
    P(W) = 21 32 3 1 1 3 1 3 ´ = 3 ´ = 5 ´ = 5 ´ = 5 W/ P ( ) = P ( T Ç W ) (ii) 32 ( W ) T | W P 21 Þ ( ) = 3 ¸ P T W 16 8 2 2 4 4 3 16 1 2 8 3 16 1 2 8 15 32 3 4 8 5 32 1 4 8 8 W T T/ W W/
  • 60.
    1 2 2= 7 P(W) = 21 32 3 5 P P Ç (ii) = ( ) ( T W ) ( W ) T | W P 32 21 3 3 ´ 1 = 3 3 ´ 1 = 15 5 ´ 3 = 5 5 1 ´ = = 3 ´ 16 8 1 2 1 2 3 4 1 4 16 2 8 16 2 8 32 4 8 32 4 8 8 W T T/ W/ W W/ 7 21 32 1 Þ ( ) = 3 ¸ P T W 16
  • 61.
    IInnddeeppeennddeenntt EEvveennttss Wecan deduce an important result from the conditional law of probability: If B has no effect on A, then, P(A B) = P(A) and we say the events are independent. ( The probability of A does not depend on B. ) So, P(A|B) = P(A Ç B) P(B) becomes P(A) = P(A Ç B) P(B) or P(A Ç B) = P(A) ´ P(B)
  • 62.
    Tests for independence P(A B) = P(A) P(A Ç B) = P(A) ´ P(B) or IInnddeeppeennddeenntt EEvveennttss P(B A) = P(B)
  • 63.
    n x ,x , x ,..., x 1 2 3 n p , p , p ,..., p 1 2 3 value of x, E(x), of the experiment is: å= E x = x p i i n i 1 ( ) EExxppeecctteedd VVaalluuee Suppose that the outcomes of an experiment are real numbers called and suppose that these outcomes have probabilities respectively. Then the expected
  • 64.
    EExxppeecctteedd VVaalluuee Example At a raffle, 1500 tickets are sold at $2 each for four prizes of $500, $250, $150, and $75. What is the expected value of your gain if you play? Gain $498 $248 $148 $73 -$2 P(x) 1 1500 1 1500 1 1500 1 1500 1496 1500 ( ) 498 1 E x = ´ + ´ + ´ + ´ + - ´ $1.35 2 1496 1500 73 1 1500 148 1 1500 248 1 1500 1500 = -