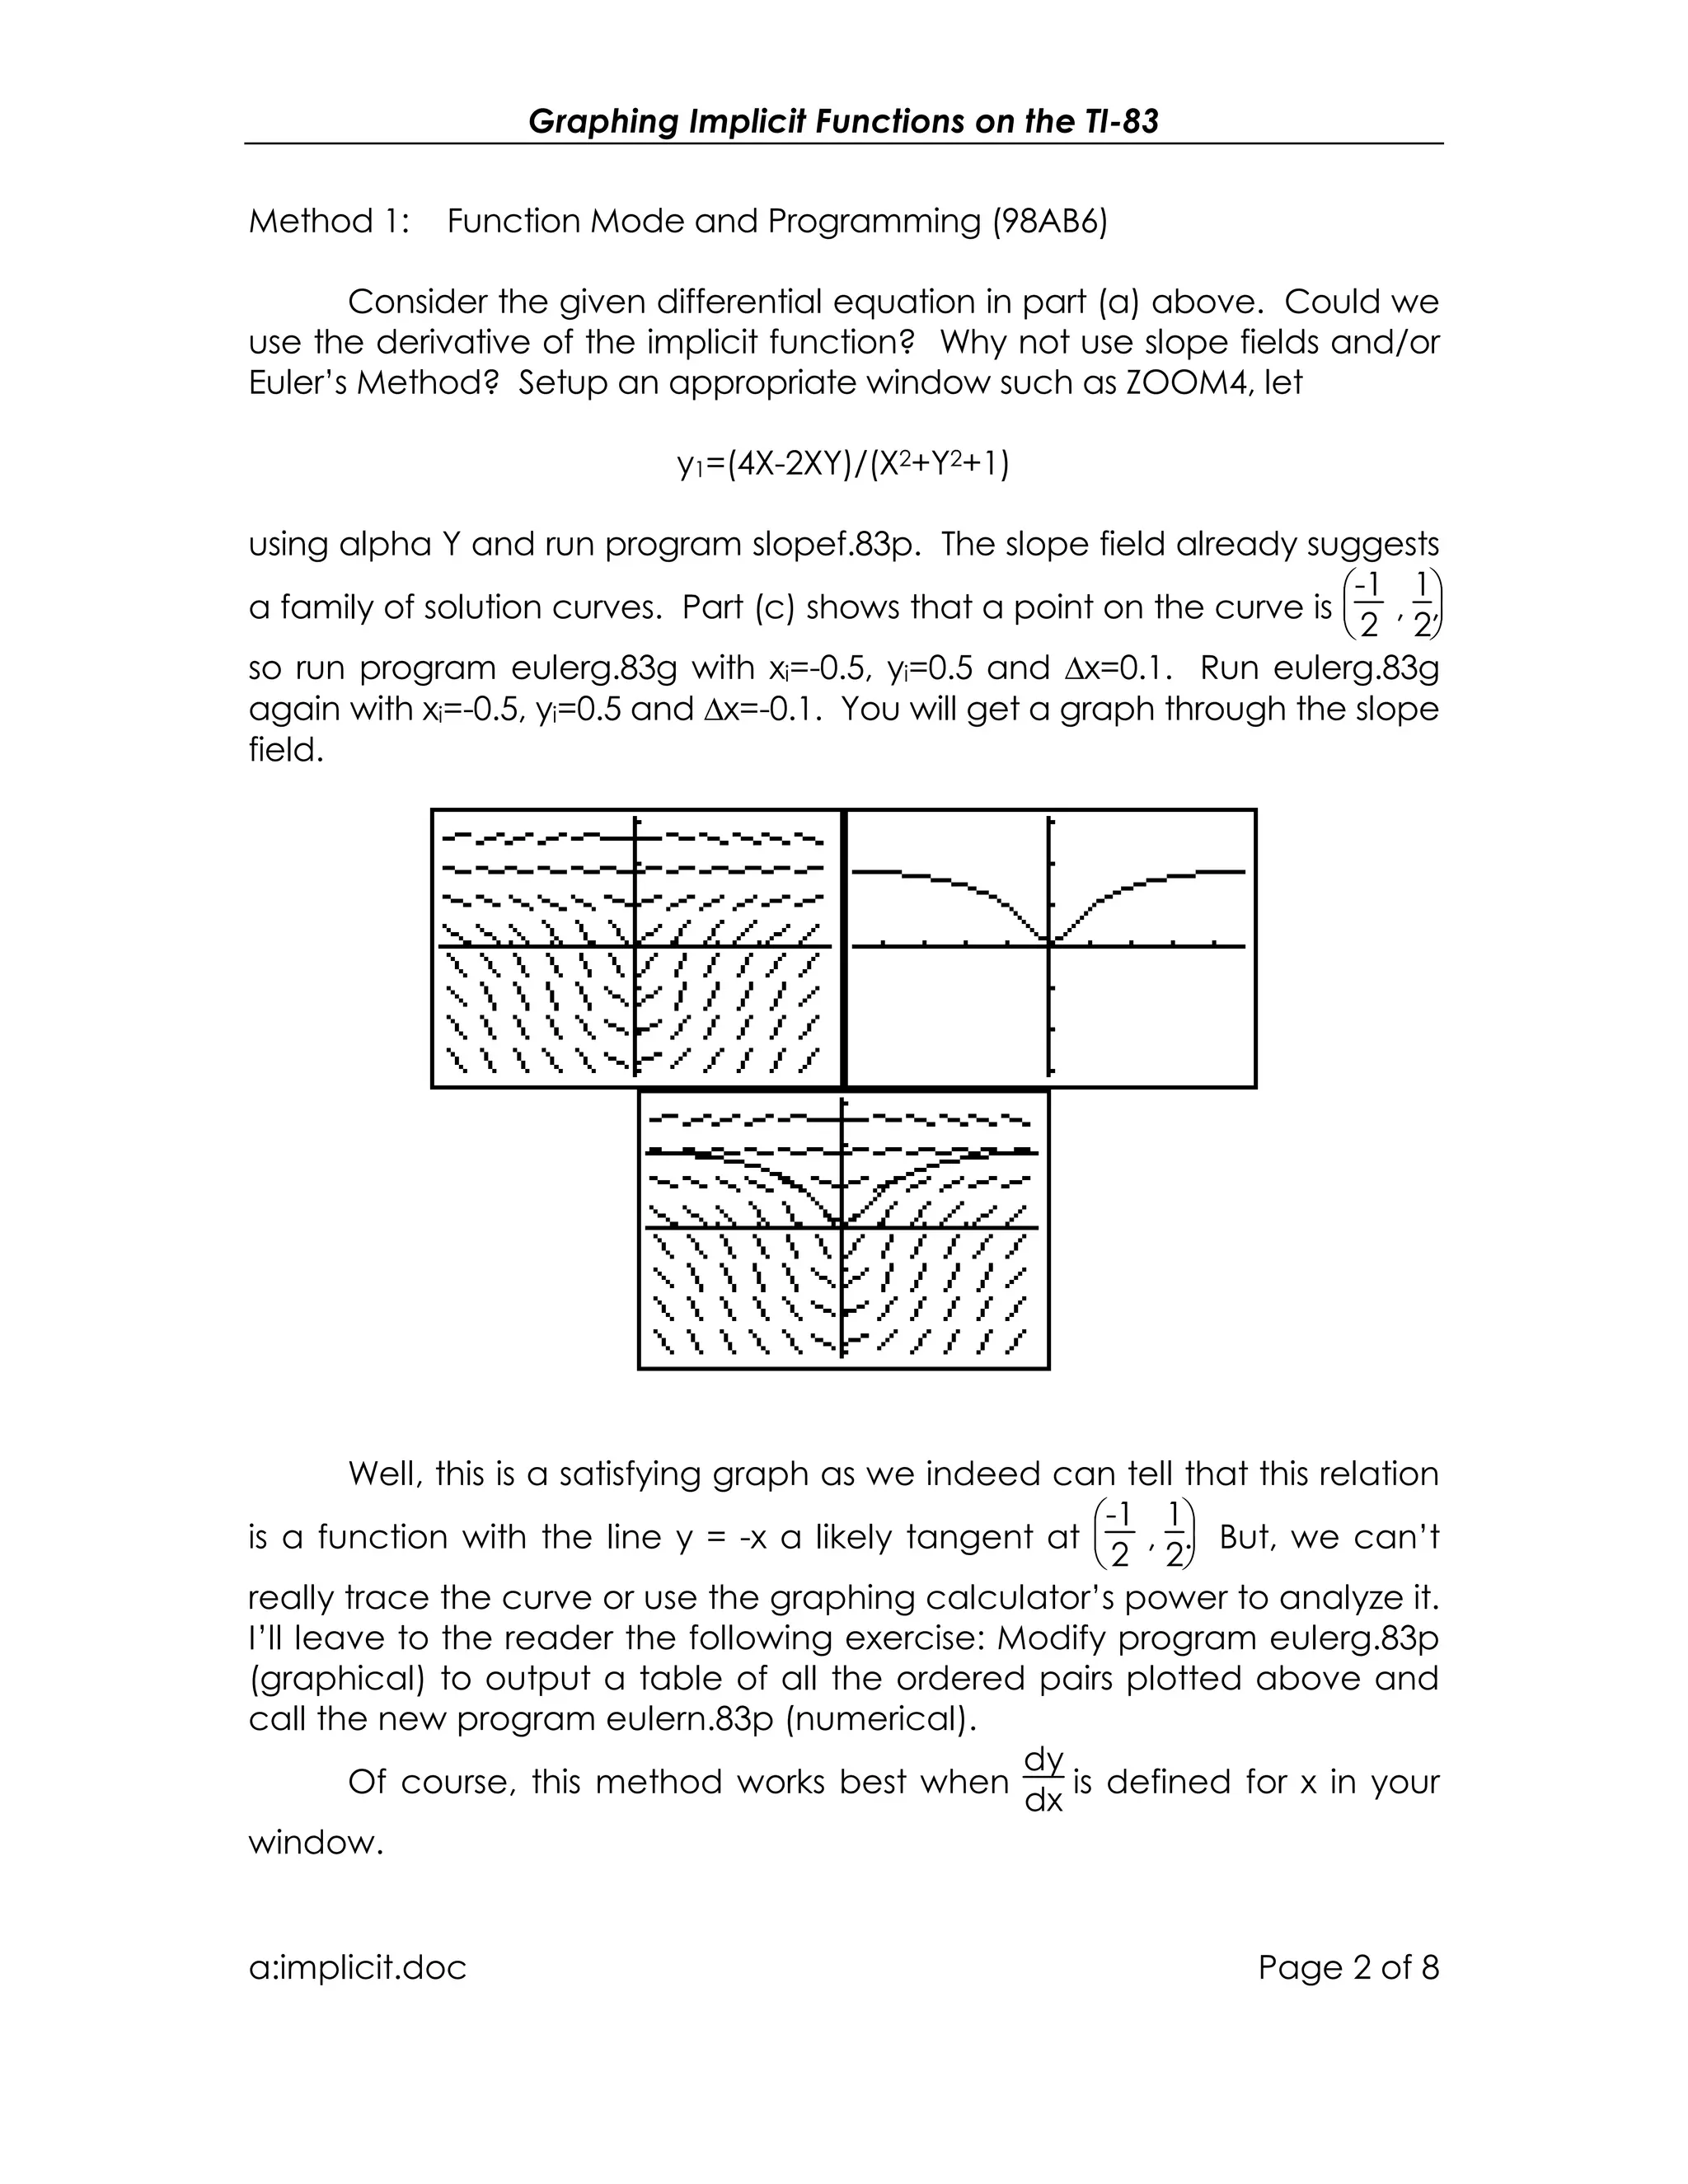
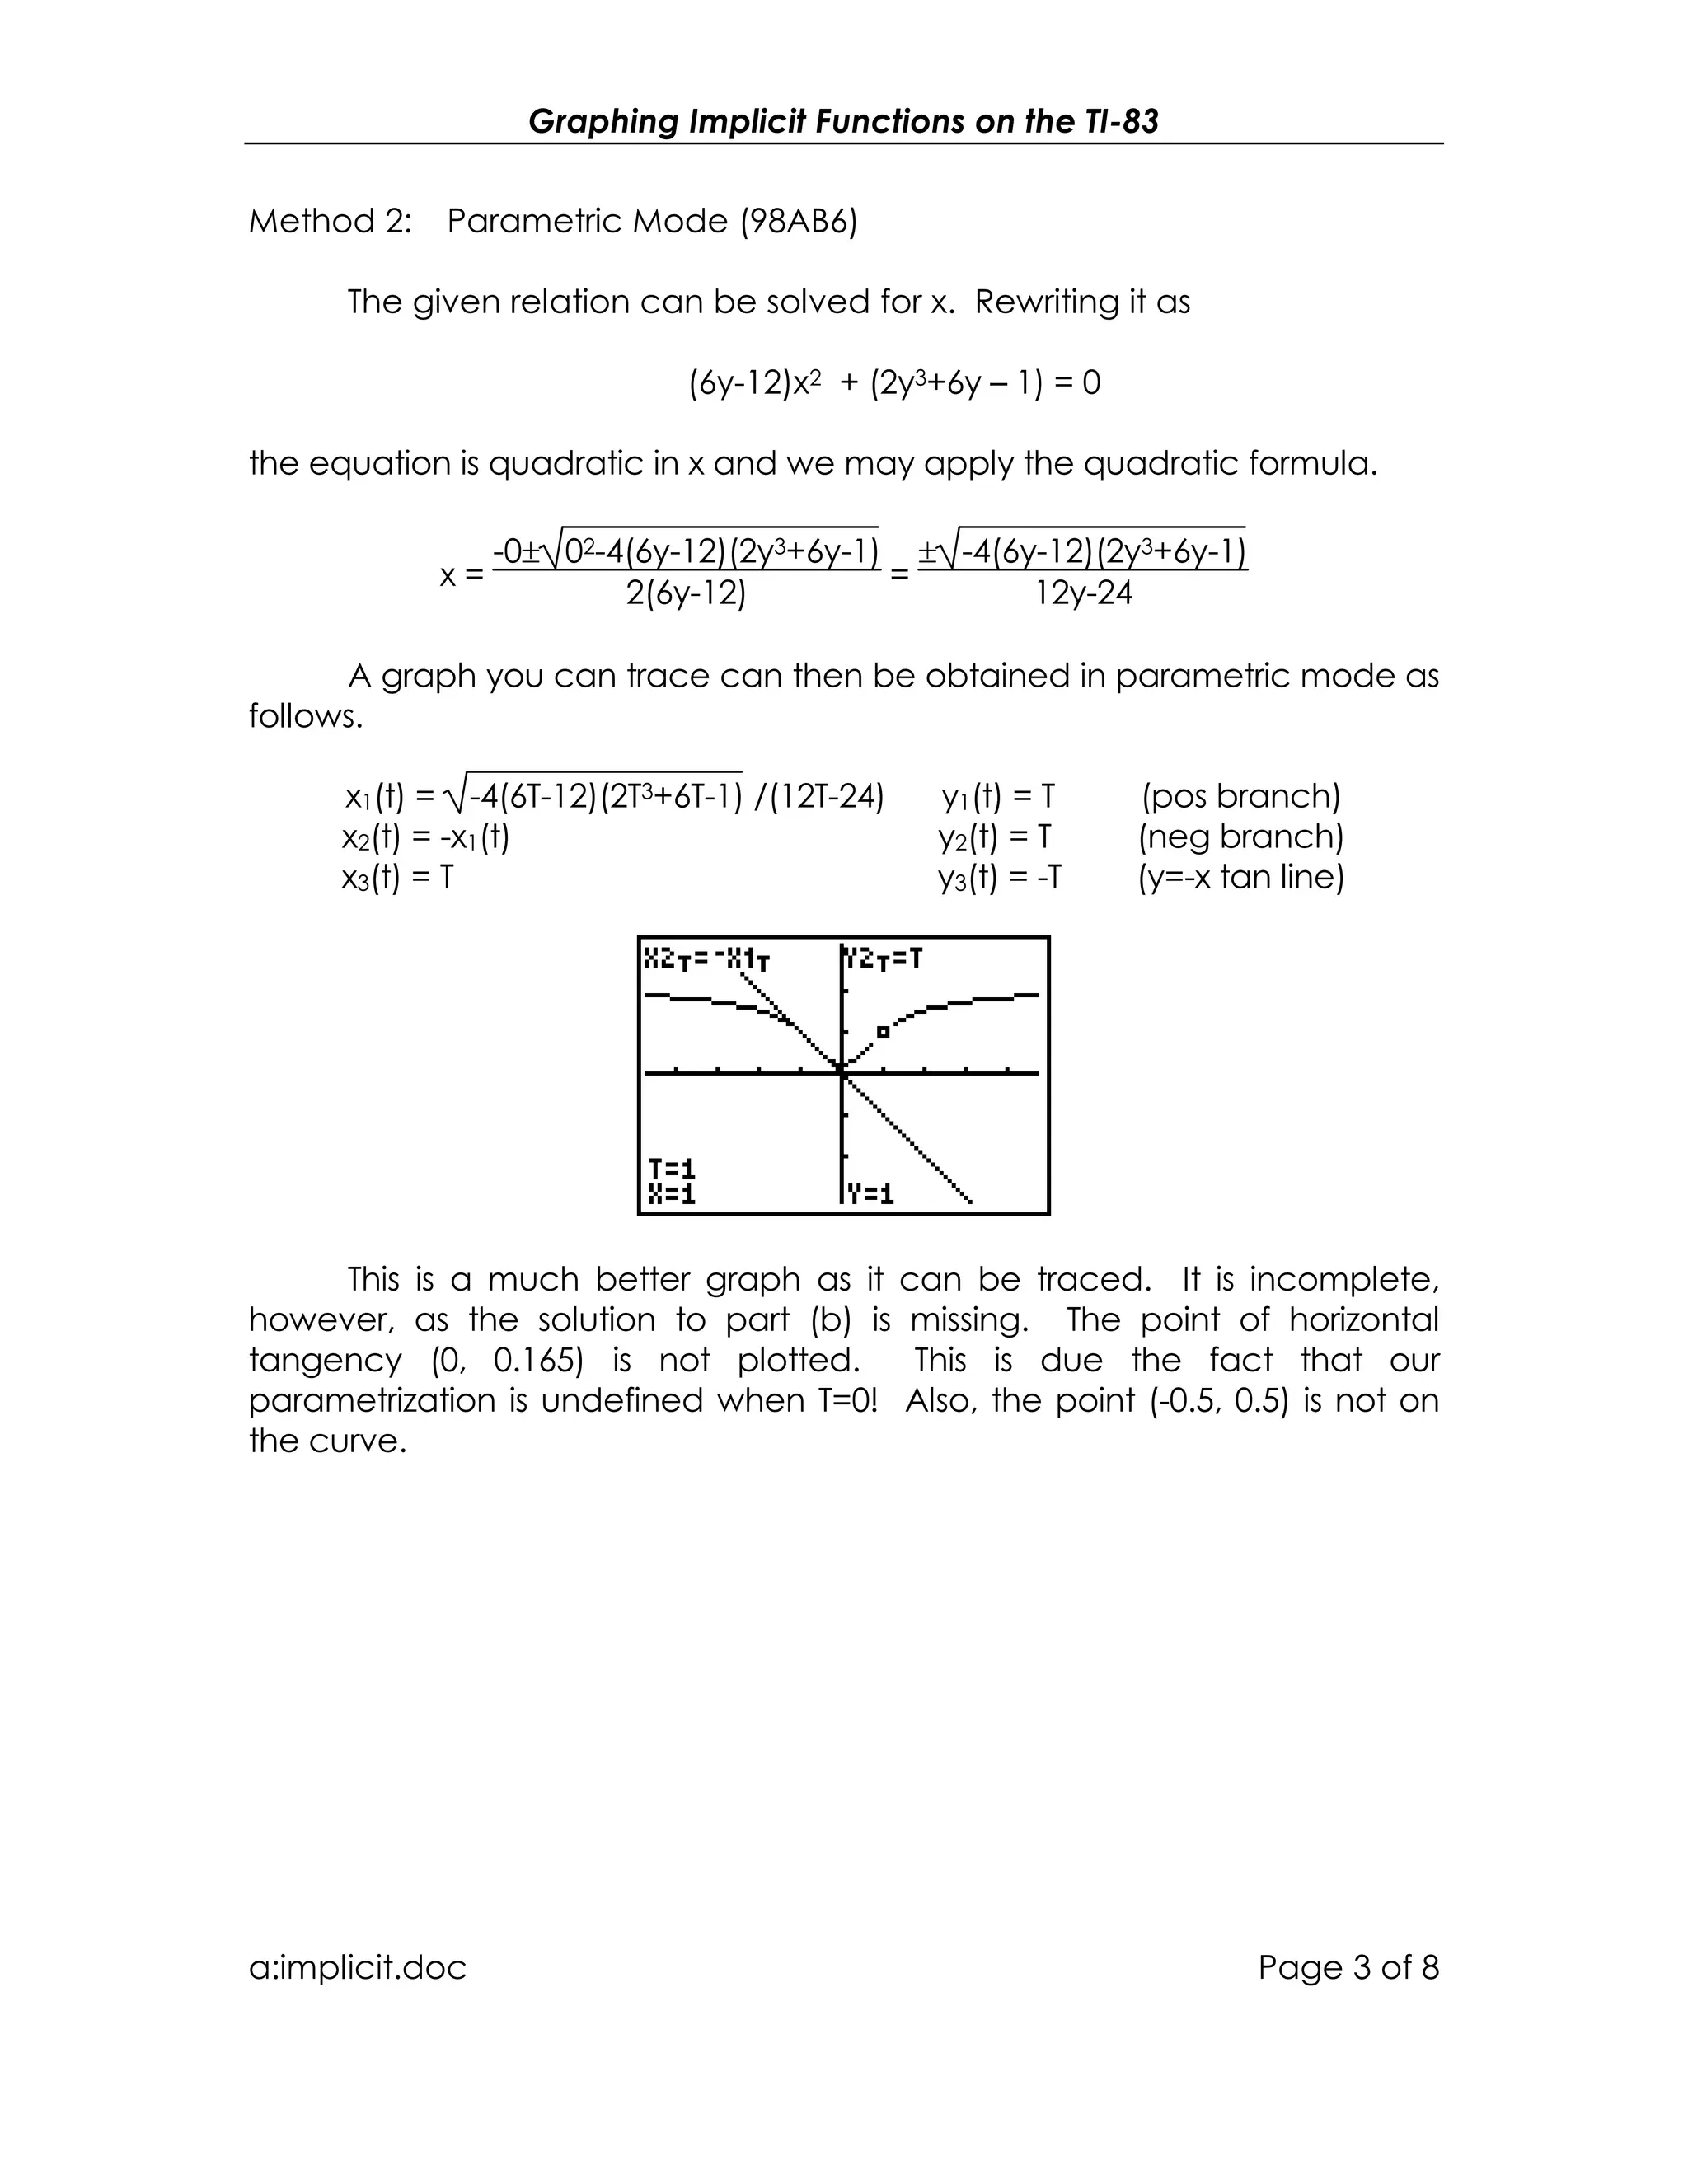
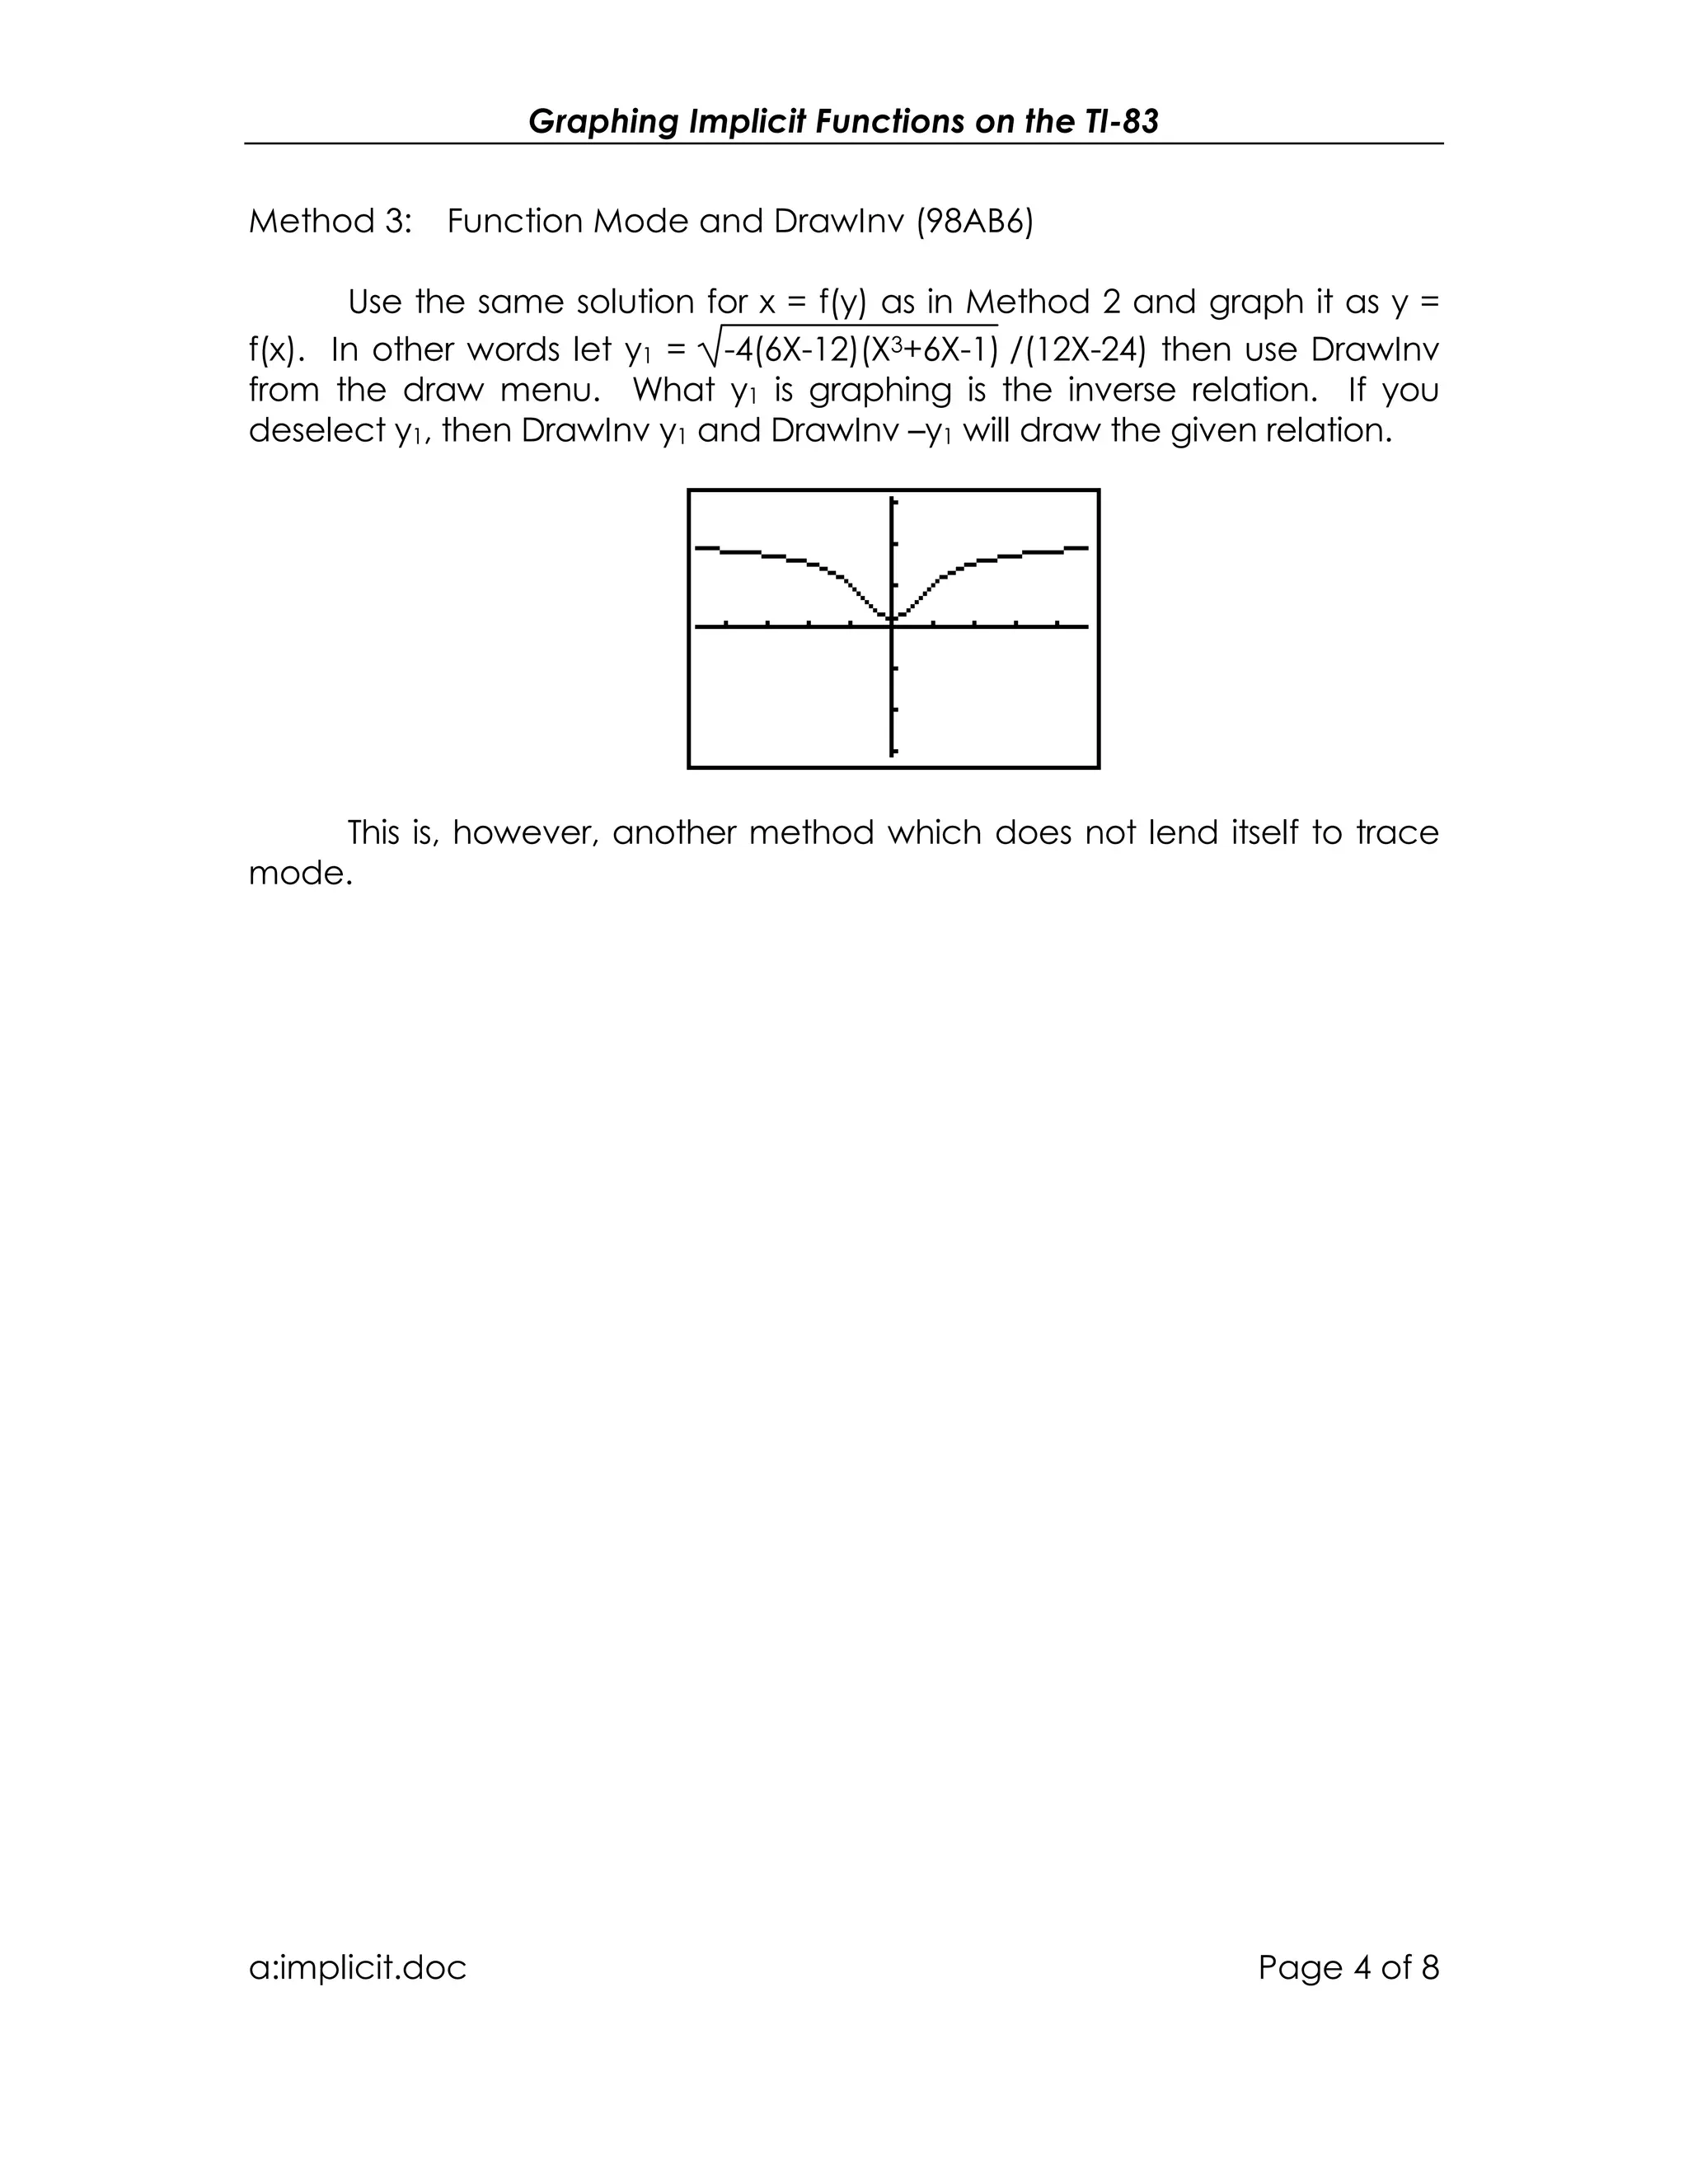
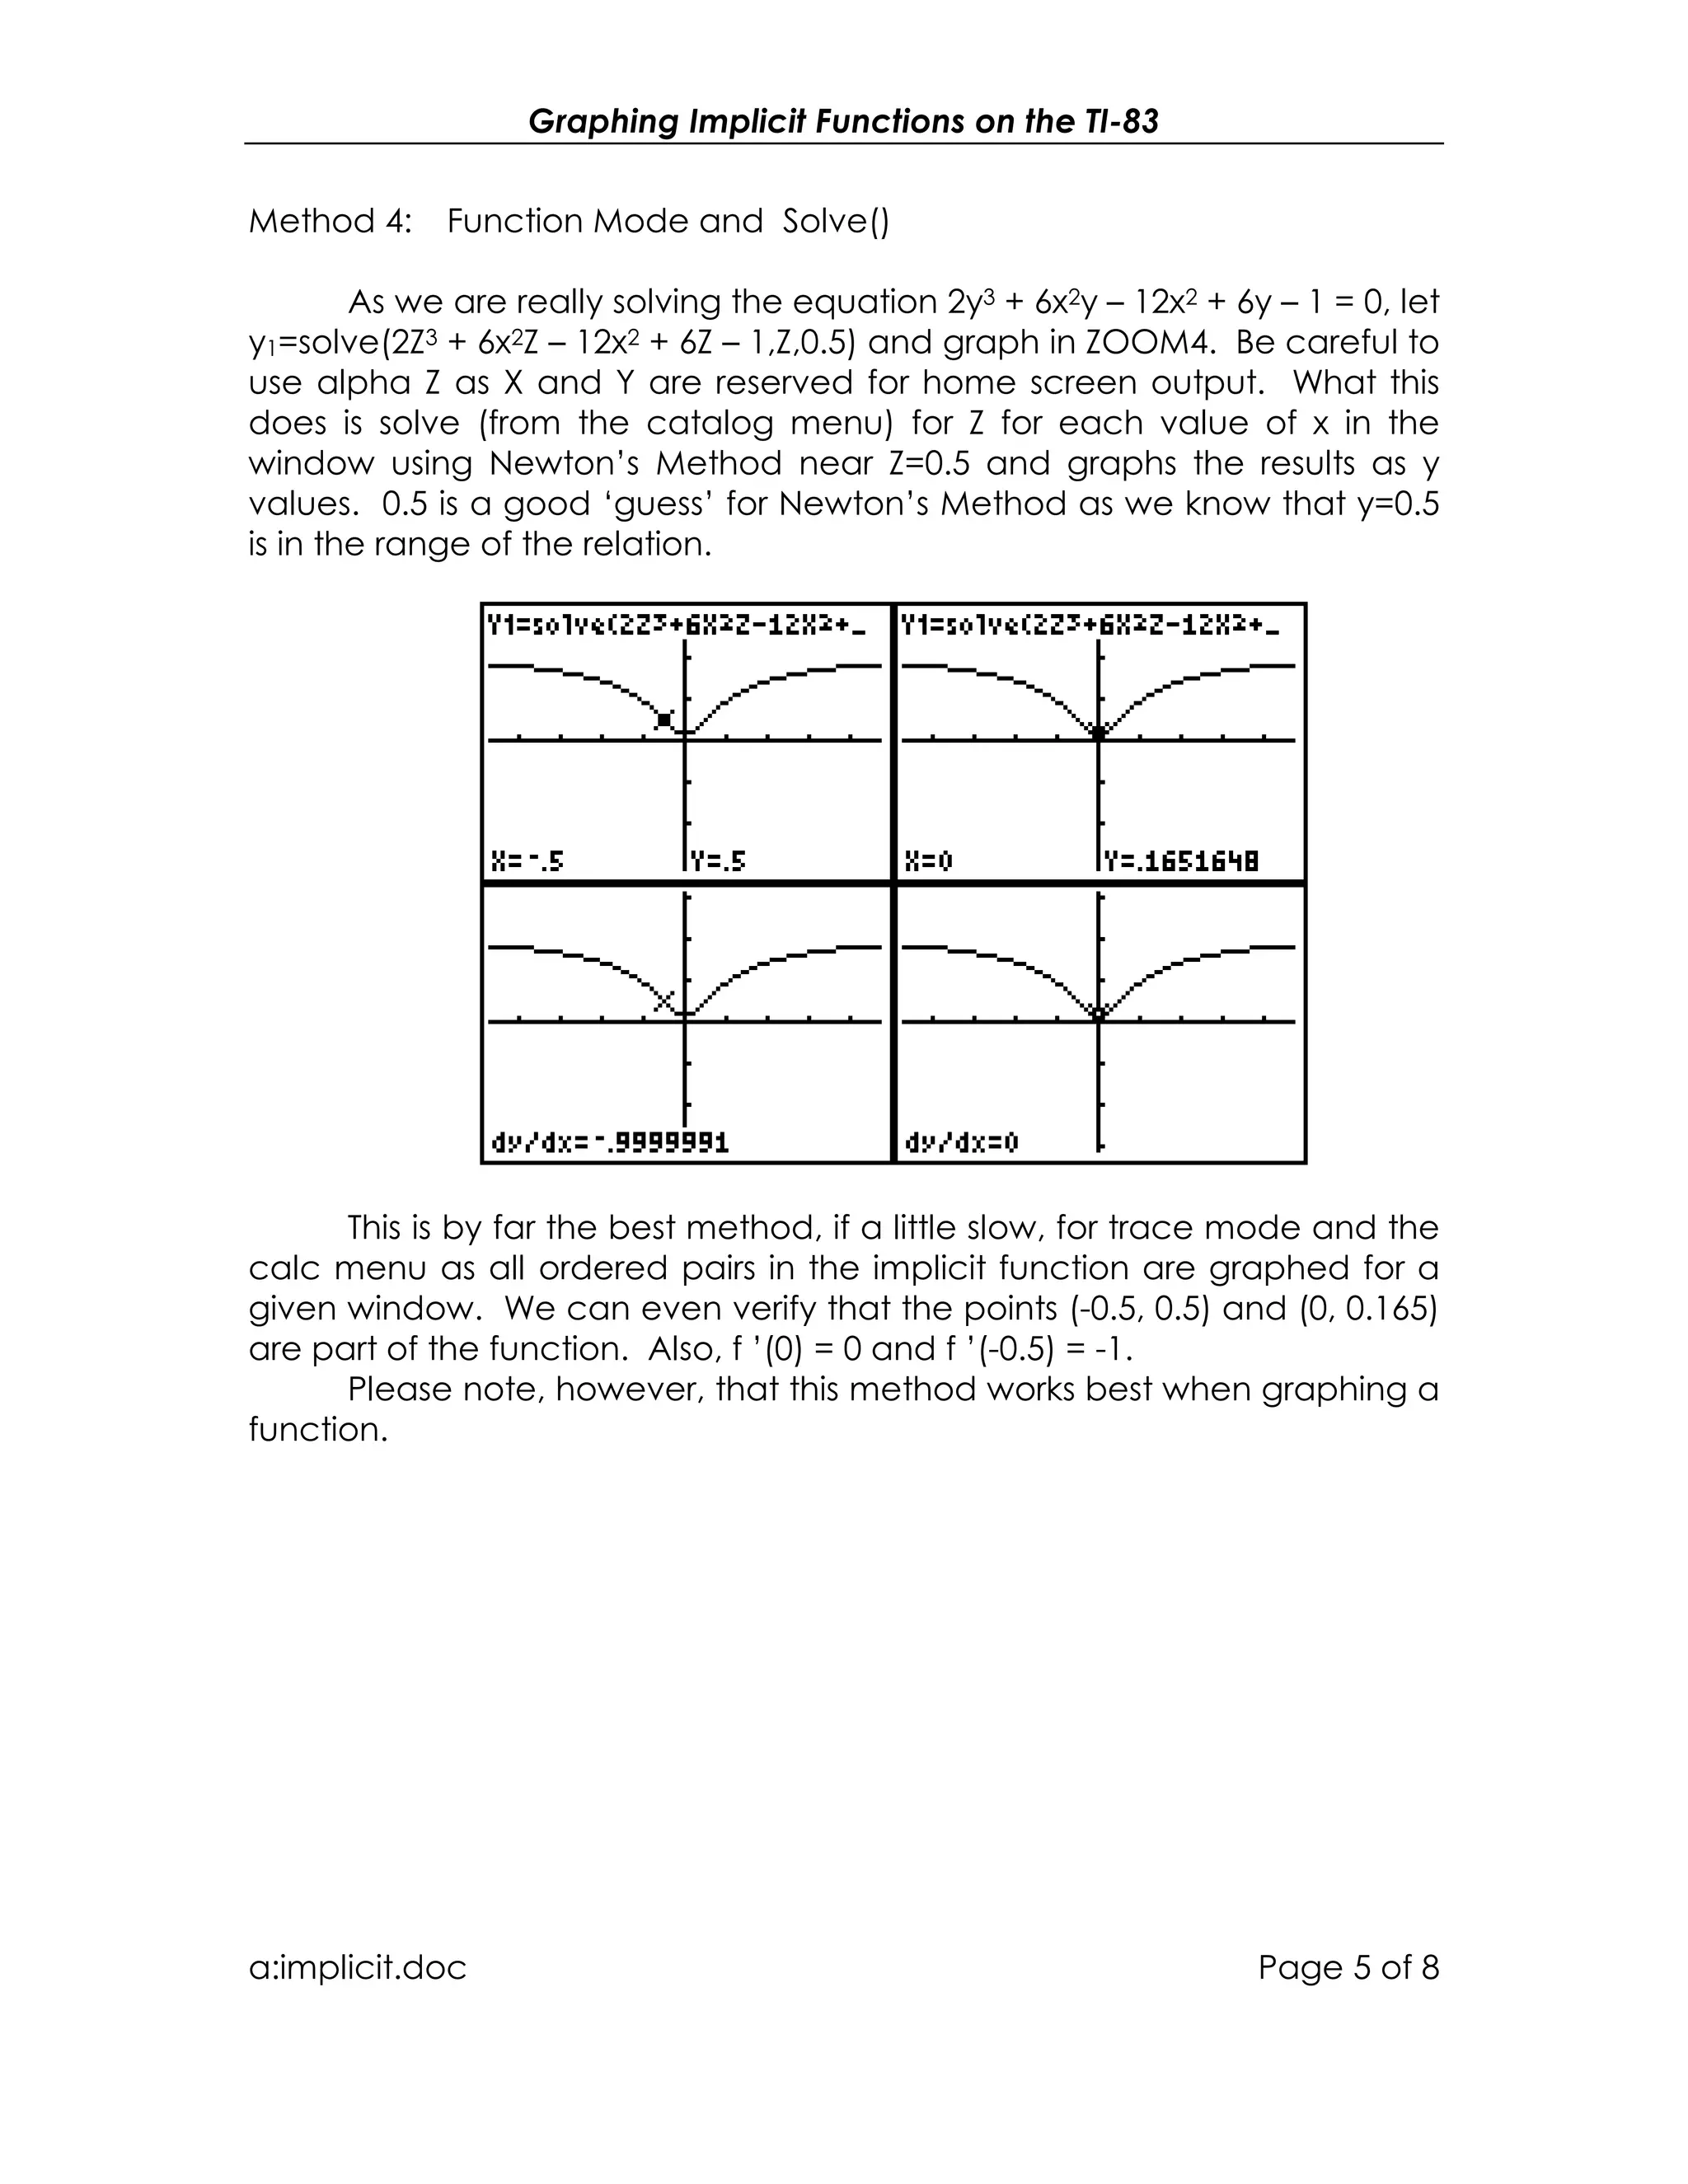
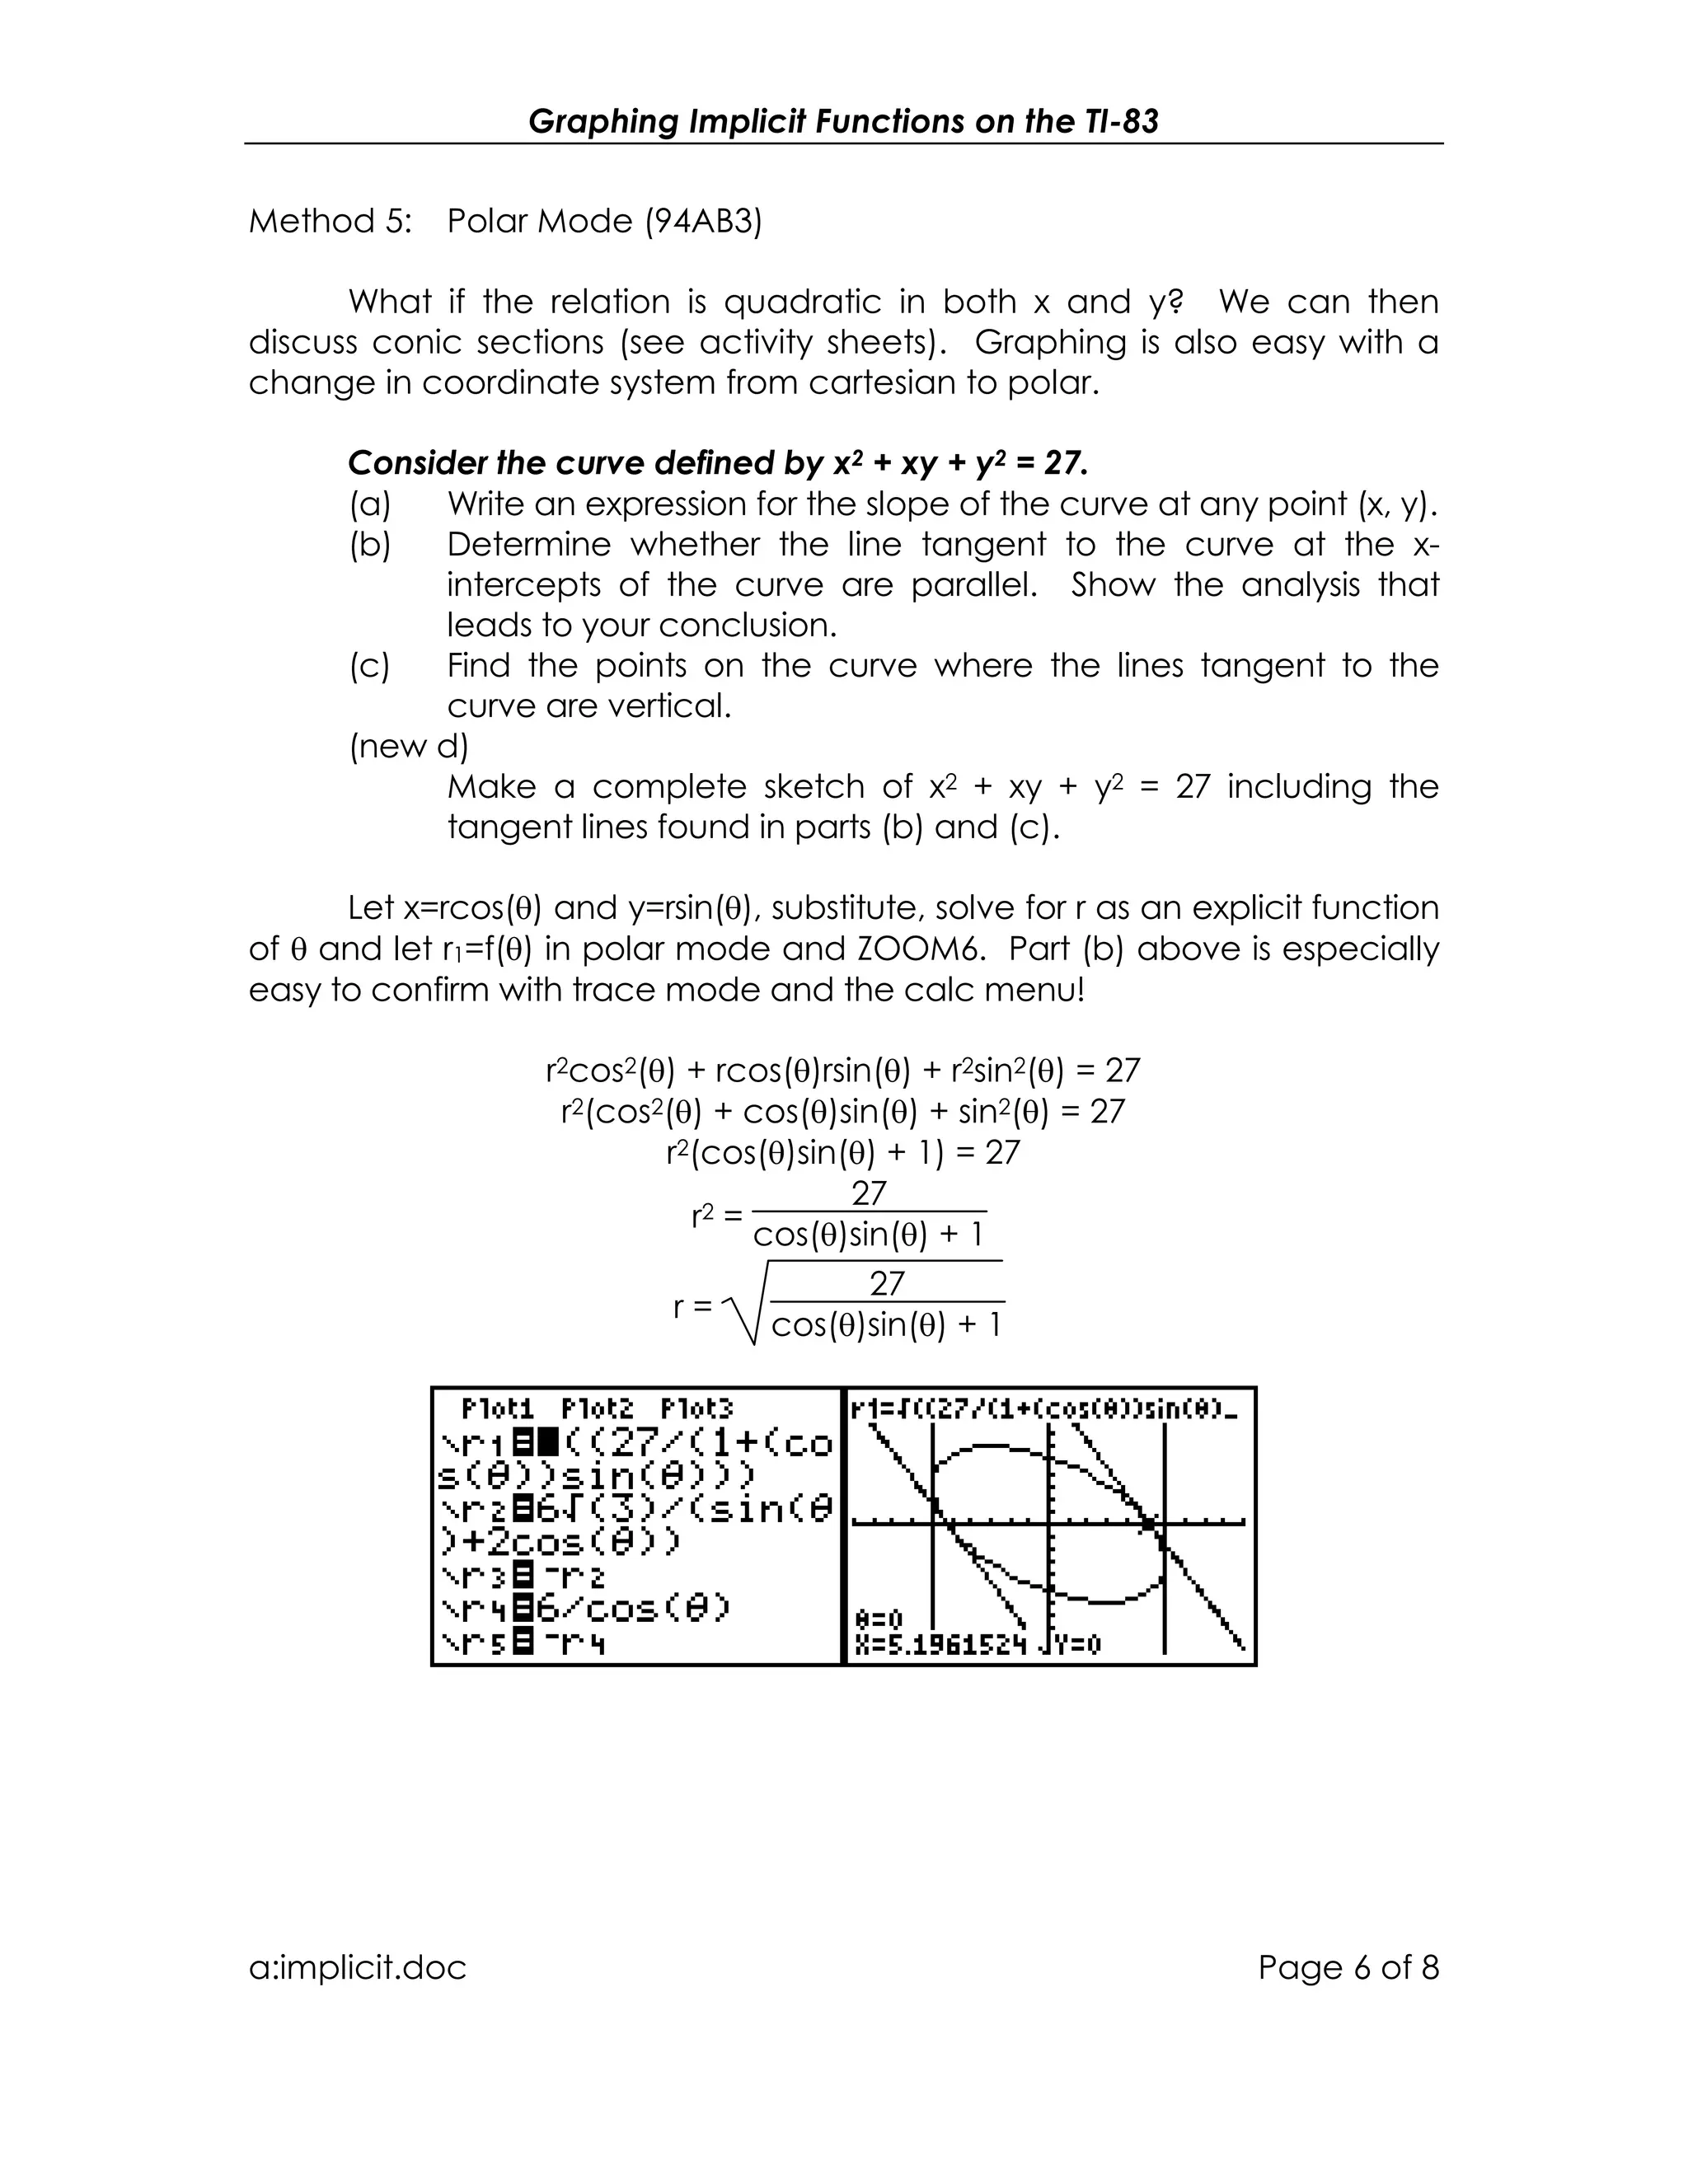
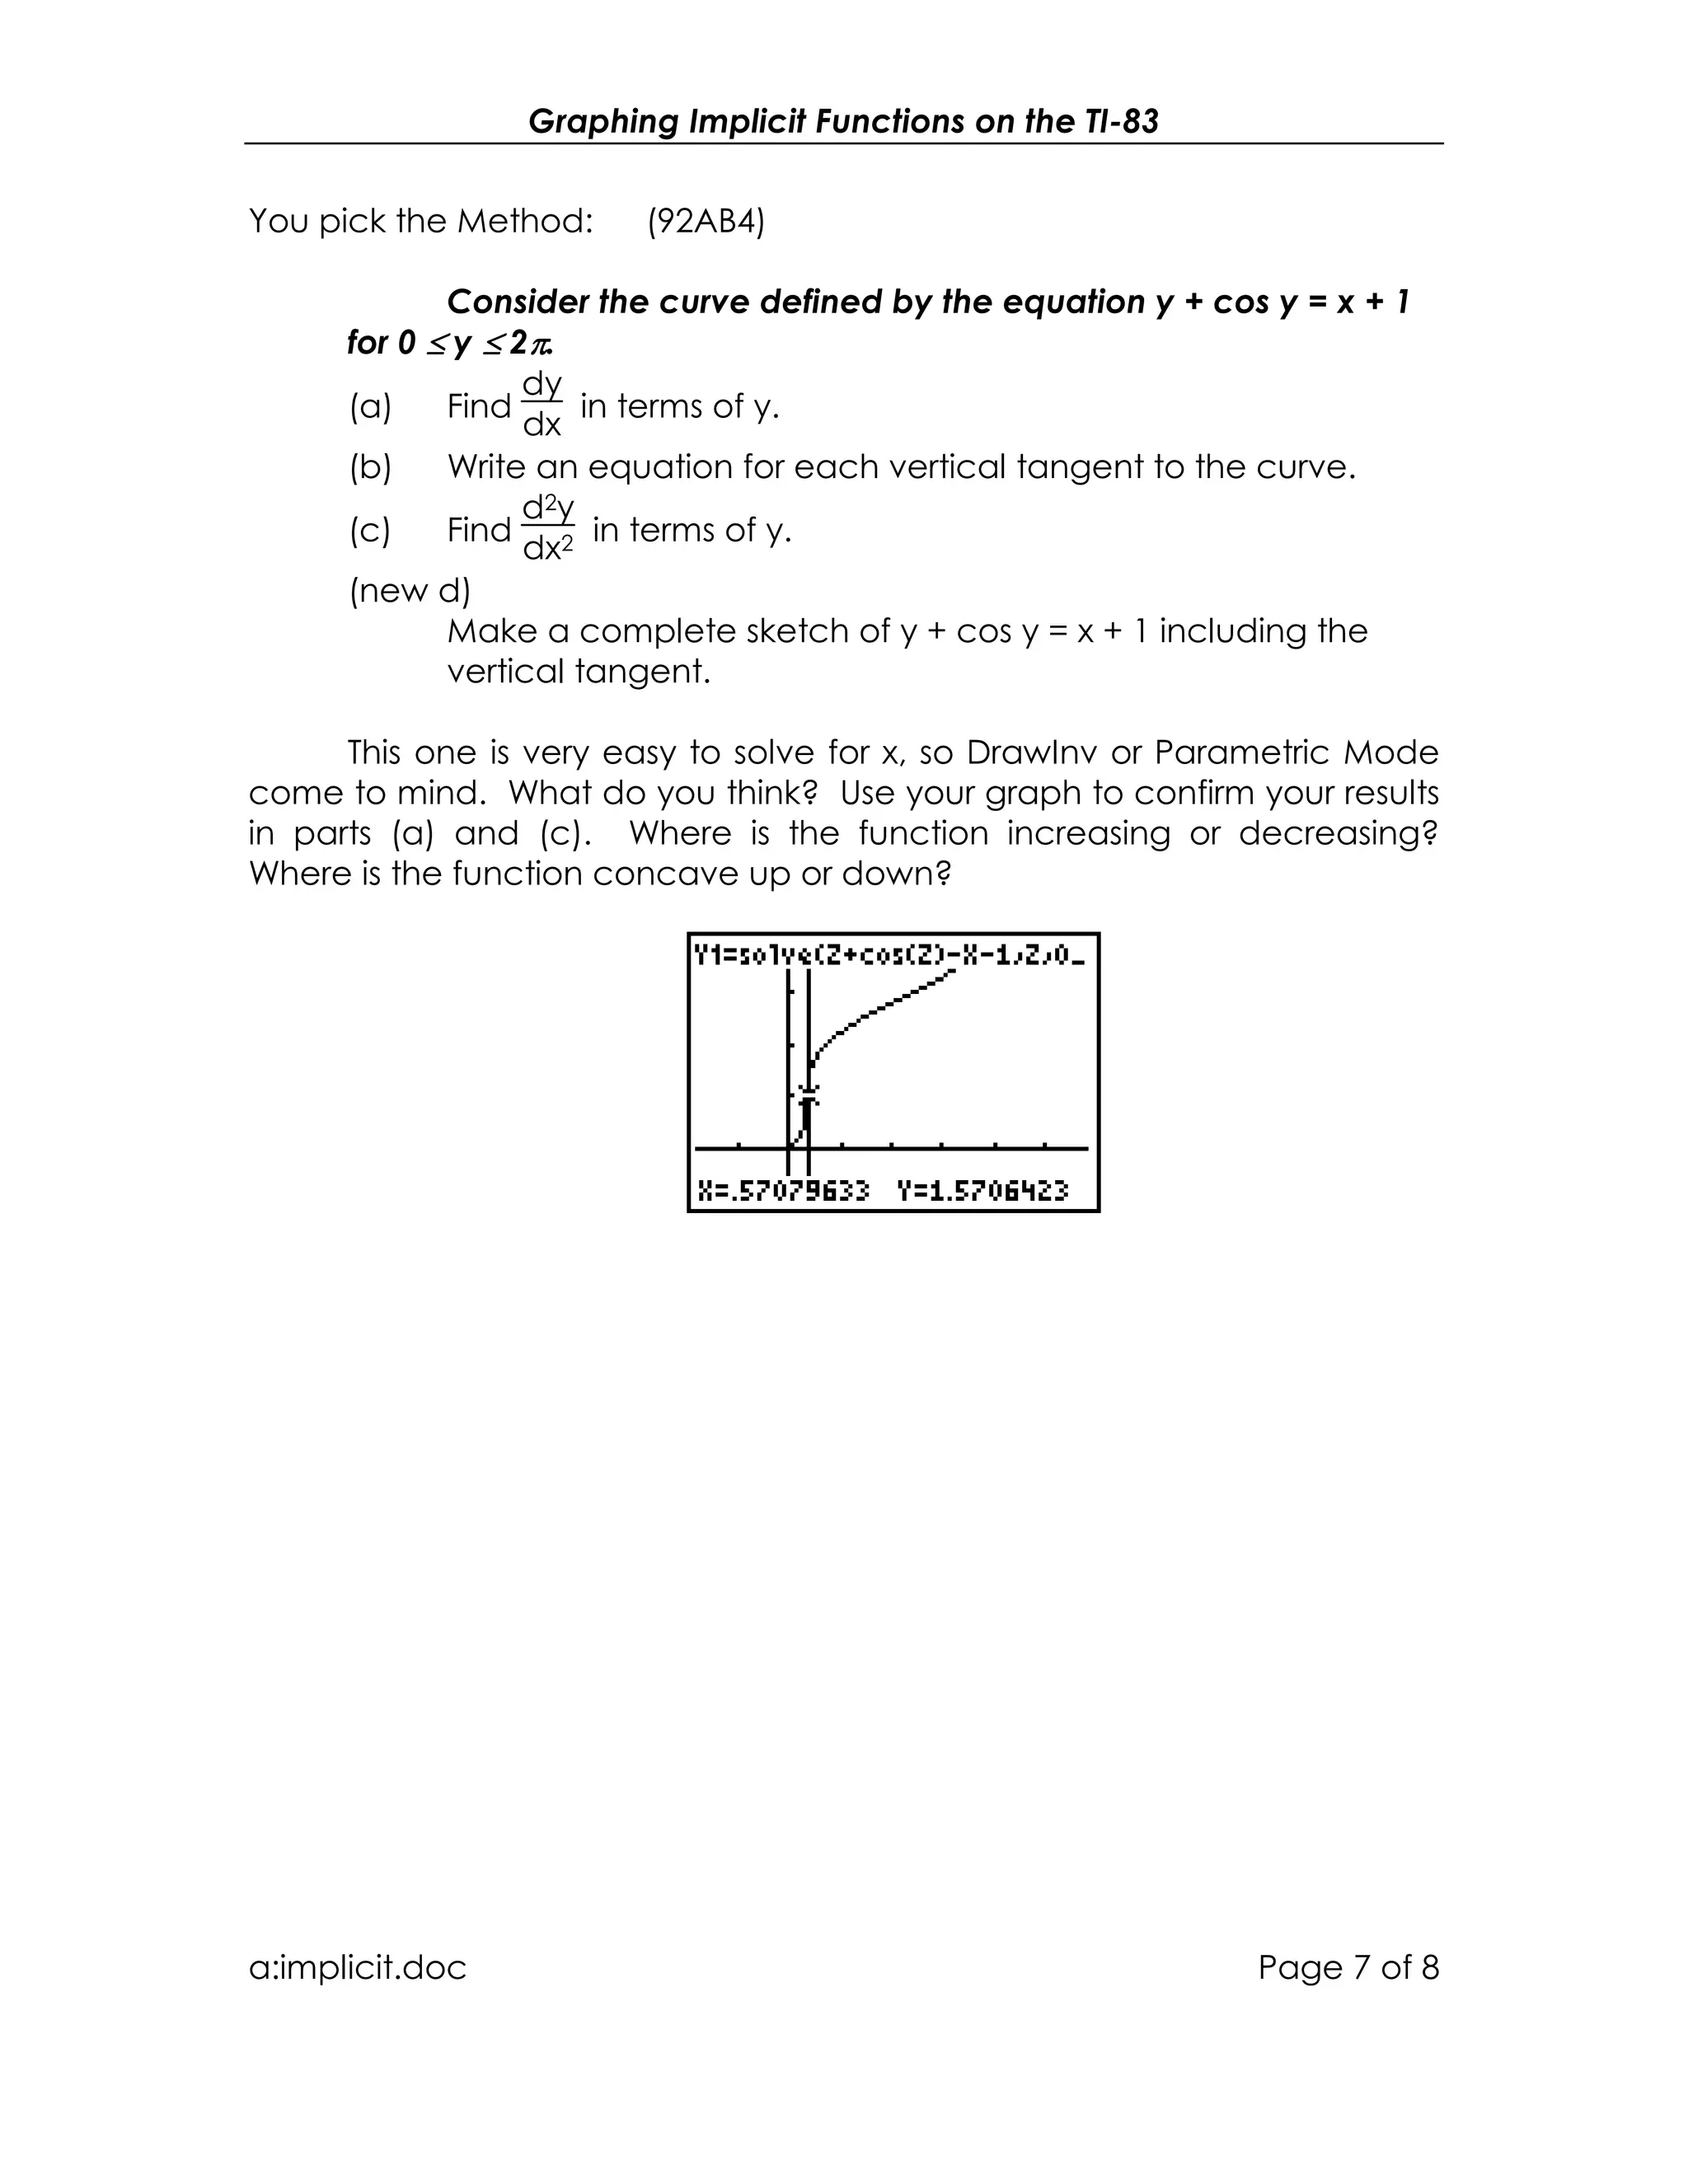
This document discusses five methods for graphing implicit functions on a TI-83 graphing calculator:
1. Using function mode, programming, and Euler's method to graph solutions to a differential equation defined by the implicit function.
2. Using parametric mode and the quadratic formula to solve the implicit function for x as a parametric function of t.
3. Using function mode, solving for x as a function of y, and using DrawInv to graph the inverse relation.
4. Using function mode and the Solve() command to numerically solve the implicit equation for y as a function of x.
5. Using polar mode by rewriting the implicit equation in terms of r and θ and graphing r
For graphs of mathematical functions, see Graph of a function. For other uses, see Graph (disambiguation). A drawing of a graph. In mathematics graph theory is the study of graphs, which are mathematical structures used.In mathematics, and more specifically in graph theory, a tree is an undirected graph in which any two vertices are connected by exactly one path. In other words, any acyclic connected graph is a tree. A forest is a disjoint union of trees.
Polynomials are very important mathematical tool for Engineers. In this lecture we will discuss about how to deal with Polynomials in MATLAB and one of its application, Curve Fitting.
In MATLAB, a vector is created by assigning the elements of the vector to a variable. This can be done in several ways depending on the source of the information.
—Enter an explicit list of elements
—Load matrices from external data files
—Using built-in functions
—Using own functions in M-files
In MATLAB, a vector is created by assigning the elements of the vector to a variable. This can be done in several ways depending on the source of the information.
—Enter an explicit list of elements
—Load matrices from external data files
—Using built-in functions
—Using own functions in M-files
SAMPLE QUESTIONExercise 1 Consider the functionf (x,C).docxanhlodge
SAMPLE QUESTION:
Exercise 1: Consider the function
f (x,C)=
sin(C x)
Cx
(a) Create a vector x with 100 elements from -3*pi to 3*pi. Write f as an inline or anonymous function
and generate the vectors y1 = f(x,C1), y2 = f(x,C2) and y3 = f(x,C3), where C1 = 1, C2 = 2 and
C3 = 3. Make sure you suppress the output of x and y's vectors. Plot the function f (for the three
C's above), name the axis, give a title to the plot and include a legend to identify the plots. Add a
grid to the plot.
(b) Without using inline or anonymous functions write a function+function structure m-file that does
the same job as in part (a)
SAMPLE LAB WRITEUP:
MAT 275 MATLAB LAB 1 NAME: __________________________
LAB DAY and TIME:______________
Instructor: _______________________
Exercise 1
(a)
x = linspace(-3*pi,3*pi); % generating x vector - default value for number
% of pts linspace is 100
f= @(x,C) sin(C*x)./(C*x) % C will be just a constant, no need for ".*"
C1 = 1, C2 = 2, C3 = 3 % Using commans to separate commands
y1 = f(x,C1); y2 = f(x,C2); y3 = f(x,C3); % supressing the y's
plot(x,y1,'b.-', x,y2,'ro-', x,y3,'ks-') % using different markers for
% black and white plots
xlabel('x'), ylabel('y') % labeling the axis
title('f(x,C) = sin(Cx)/(Cx)') % adding a title
legend('C = 1','C = 2','C = 3') % adding a legend
grid on
Command window output:
f =
@(x,C)sin(C*x)./(C*x)
C1 =
1
C2 =
2
C3 =
3
(b)
M-file of structure function+function
function ex1
x = linspace(-3*pi,3*pi); % generating x vector - default value for number
% of pts linspace is 100
C1 = 1, C2 = 2, C3 = 3 % Using commans to separate commands
y1 = f(x,C1); y2 = f(x,C2); y3 = f(x,C3); % function f is defined below
plot(x,y1,'b.-', x,y2,'ro-', x,y3,'ks-') % using different markers for
% black and white plots
xlabel('x'), ylabel('y') % labeling the axis
title('f(x,C) = sin(Cx)/(Cx)') % adding a title
legend('C = 1','C = 2','C = 3') % adding a legend
grid on
end
function y = f(x,C)
y = sin(C*x)./(C*x);
end
Command window output:
C1 =
1
C2 =
2
C3 =
3
More instructions for the lab write-up:
1) You are not obligated to use the 'diary' function. It was presented only for you convenience. You
should be copying and pasting your code, plots, and results into some sort of "Word" type editor that
will allow you to import graphs and such. Make sure you always include the commands to generate
what is been asked and include the outputs (from command window and plots), unless the pr.
Computer Graphics in Java and Scala - Part 1Philip Schwarz
Computer Graphics in Java and Scala - Part 1.
Continuous (Logical) and Discrete (Device) Coordinates,
with a simple yet pleasing example involving concentric triangles.
Scala code: https://github.com/philipschwarz/computer-graphics-50-triangles-scala
Errata:
1. Scala classes TrianglesPanel and Triangles need not be classes, they could just be objects.
I am Frank P. I am a SPSS Homework Solver at statisticshomeworksolver.com. I hold a Ph.D. in statistics, from Sunway University, Malaysia. I have been helping students with their homework for the past 6 years. I solve homework related to SPSS.
Visit statisticshomeworksolver.com or email support@statisticshomeworksolver.com. You can also call on +1 678 648 4277 for any assistance with SPSS Homework.
June 3, 2024 Anti-Semitism Letter Sent to MIT President Kornbluth and MIT Cor...Levi Shapiro
Letter from the Congress of the United States regarding Anti-Semitism sent June 3rd to MIT President Sally Kornbluth, MIT Corp Chair, Mark Gorenberg
Dear Dr. Kornbluth and Mr. Gorenberg,
The US House of Representatives is deeply concerned by ongoing and pervasive acts of antisemitic
harassment and intimidation at the Massachusetts Institute of Technology (MIT). Failing to act decisively to ensure a safe learning environment for all students would be a grave dereliction of your responsibilities as President of MIT and Chair of the MIT Corporation.
This Congress will not stand idly by and allow an environment hostile to Jewish students to persist. The House believes that your institution is in violation of Title VI of the Civil Rights Act, and the inability or
unwillingness to rectify this violation through action requires accountability.
Postsecondary education is a unique opportunity for students to learn and have their ideas and beliefs challenged. However, universities receiving hundreds of millions of federal funds annually have denied
students that opportunity and have been hijacked to become venues for the promotion of terrorism, antisemitic harassment and intimidation, unlawful encampments, and in some cases, assaults and riots.
The House of Representatives will not countenance the use of federal funds to indoctrinate students into hateful, antisemitic, anti-American supporters of terrorism. Investigations into campus antisemitism by the Committee on Education and the Workforce and the Committee on Ways and Means have been expanded into a Congress-wide probe across all relevant jurisdictions to address this national crisis. The undersigned Committees will conduct oversight into the use of federal funds at MIT and its learning environment under authorities granted to each Committee.
• The Committee on Education and the Workforce has been investigating your institution since December 7, 2023. The Committee has broad jurisdiction over postsecondary education, including its compliance with Title VI of the Civil Rights Act, campus safety concerns over disruptions to the learning environment, and the awarding of federal student aid under the Higher Education Act.
• The Committee on Oversight and Accountability is investigating the sources of funding and other support flowing to groups espousing pro-Hamas propaganda and engaged in antisemitic harassment and intimidation of students. The Committee on Oversight and Accountability is the principal oversight committee of the US House of Representatives and has broad authority to investigate “any matter” at “any time” under House Rule X.
• The Committee on Ways and Means has been investigating several universities since November 15, 2023, when the Committee held a hearing entitled From Ivory Towers to Dark Corners: Investigating the Nexus Between Antisemitism, Tax-Exempt Universities, and Terror Financing. The Committee followed the hearing with letters to those institutions on January 10, 202
How to Make a Field invisible in Odoo 17Celine George
It is possible to hide or invisible some fields in odoo. Commonly using “invisible” attribute in the field definition to invisible the fields. This slide will show how to make a field invisible in odoo 17.
Instructions for Submissions thorugh G- Classroom.pptxJheel Barad
This presentation provides a briefing on how to upload submissions and documents in Google Classroom. It was prepared as part of an orientation for new Sainik School in-service teacher trainees. As a training officer, my goal is to ensure that you are comfortable and proficient with this essential tool for managing assignments and fostering student engagement.
Welcome to TechSoup New Member Orientation and Q&A (May 2024).pdfTechSoup
In this webinar you will learn how your organization can access TechSoup's wide variety of product discount and donation programs. From hardware to software, we'll give you a tour of the tools available to help your nonprofit with productivity, collaboration, financial management, donor tracking, security, and more.
Francesca Gottschalk - How can education support child empowerment.pptxEduSkills OECD
Francesca Gottschalk from the OECD’s Centre for Educational Research and Innovation presents at the Ask an Expert Webinar: How can education support child empowerment?
Synthetic Fiber Construction in lab .pptxPavel ( NSTU)
Synthetic fiber production is a fascinating and complex field that blends chemistry, engineering, and environmental science. By understanding these aspects, students can gain a comprehensive view of synthetic fiber production, its impact on society and the environment, and the potential for future innovations. Synthetic fibers play a crucial role in modern society, impacting various aspects of daily life, industry, and the environment. ynthetic fibers are integral to modern life, offering a range of benefits from cost-effectiveness and versatility to innovative applications and performance characteristics. While they pose environmental challenges, ongoing research and development aim to create more sustainable and eco-friendly alternatives. Understanding the importance of synthetic fibers helps in appreciating their role in the economy, industry, and daily life, while also emphasizing the need for sustainable practices and innovation.
Operation “Blue Star” is the only event in the history of Independent India where the state went into war with its own people. Even after about 40 years it is not clear if it was culmination of states anger over people of the region, a political game of power or start of dictatorial chapter in the democratic setup.
The people of Punjab felt alienated from main stream due to denial of their just demands during a long democratic struggle since independence. As it happen all over the word, it led to militant struggle with great loss of lives of military, police and civilian personnel. Killing of Indira Gandhi and massacre of innocent Sikhs in Delhi and other India cities was also associated with this movement.
Unit 8 - Information and Communication Technology (Paper I).pdfThiyagu K
This slides describes the basic concepts of ICT, basics of Email, Emerging Technology and Digital Initiatives in Education. This presentations aligns with the UGC Paper I syllabus.
Embracing GenAI - A Strategic ImperativePeter Windle
Artificial Intelligence (AI) technologies such as Generative AI, Image Generators and Large Language Models have had a dramatic impact on teaching, learning and assessment over the past 18 months. The most immediate threat AI posed was to Academic Integrity with Higher Education Institutes (HEIs) focusing their efforts on combating the use of GenAI in assessment. Guidelines were developed for staff and students, policies put in place too. Innovative educators have forged paths in the use of Generative AI for teaching, learning and assessments leading to pockets of transformation springing up across HEIs, often with little or no top-down guidance, support or direction.
This Gasta posits a strategic approach to integrating AI into HEIs to prepare staff, students and the curriculum for an evolving world and workplace. We will highlight the advantages of working with these technologies beyond the realm of teaching, learning and assessment by considering prompt engineering skills, industry impact, curriculum changes, and the need for staff upskilling. In contrast, not engaging strategically with Generative AI poses risks, including falling behind peers, missed opportunities and failing to ensure our graduates remain employable. The rapid evolution of AI technologies necessitates a proactive and strategic approach if we are to remain relevant.
A Strategic Approach: GenAI in EducationPeter Windle
Artificial Intelligence (AI) technologies such as Generative AI, Image Generators and Large Language Models have had a dramatic impact on teaching, learning and assessment over the past 18 months. The most immediate threat AI posed was to Academic Integrity with Higher Education Institutes (HEIs) focusing their efforts on combating the use of GenAI in assessment. Guidelines were developed for staff and students, policies put in place too. Innovative educators have forged paths in the use of Generative AI for teaching, learning and assessments leading to pockets of transformation springing up across HEIs, often with little or no top-down guidance, support or direction.
This Gasta posits a strategic approach to integrating AI into HEIs to prepare staff, students and the curriculum for an evolving world and workplace. We will highlight the advantages of working with these technologies beyond the realm of teaching, learning and assessment by considering prompt engineering skills, industry impact, curriculum changes, and the need for staff upskilling. In contrast, not engaging strategically with Generative AI poses risks, including falling behind peers, missed opportunities and failing to ensure our graduates remain employable. The rapid evolution of AI technologies necessitates a proactive and strategic approach if we are to remain relevant.
5HBC: How to Graph Implicit Relations Intro Packet!
1. Graphing Implicit Functions on the TI-83
a:implicit.doc Page 1 of 8
Last year, the AP Calculus exam had a question involving an implicit
function. The question was 98AB6:
Consider the curve defined by 2y3 + 6x2y - 12x2 + 6y = 1.
(a) Show that
dy
dx
=
4x - 2xy
x2 + y2 + 1
.
(b) Write an equation of each horizontal tangent line to the curve.
(c) The line through the origin with slope -1 is tangent to the curve
at point P. Find the x- and y-coordinates of point P.
All this calculus is well and good, but this isn’t the first implicit relation
or function appearing on an AP Calculus exam. The AP Calculus
Committee seems to think this a baffling question. Why, say you? Well,
notice what they don’t ask. This curve is not easy to graph! What if we
could use a graphing calculator to demystify this question? My students
and I wrestled with just this issue last May after the exam arriving at methods
1 and 5. In September, my new AP Calculus BC class tackled this problem
and came up with method 3. Methods 2 and 4 were developed with help
from the ap-calc (www.ets.org), graph-ti (www.ti.com) and calc-reform
(www.ams.org) listservs!
Let’s add a new part (d) to this question.
(new d)
Make a complete sketch of the given implicit function.
2. Graphing Implicit Functions on the TI-83
a:implicit.doc Page 2 of 8
Method 1: Function Mode and Programming (98AB6)
Consider the given differential equation in part (a) above. Could we
use the derivative of the implicit function? Why not use slope fields and/or
Euler’s Method? Setup an appropriate window such as ZOOM4, let
y1=(4X-2XY)/(X2+Y2+1)
using alpha Y and run program slopef.83p. The slope field already suggests
a family of solution curves. Part (c) shows that a point on the curve is
-1
2
,
1
2
,
so run program eulerg.83g with xi=-0.5, yi=0.5 and ∆x=0.1. Run eulerg.83g
again with xi=-0.5, yi=0.5 and ∆x=-0.1. You will get a graph through the slope
field.
Well, this is a satisfying graph as we indeed can tell that this relation
is a function with the line y = -x a likely tangent at
-1
2
,
1
2
. But, we can’t
really trace the curve or use the graphing calculator’s power to analyze it.
I’ll leave to the reader the following exercise: Modify program eulerg.83p
(graphical) to output a table of all the ordered pairs plotted above and
call the new program eulern.83p (numerical).
Of course, this method works best when
dy
dx
is defined for x in your
window.
3. Graphing Implicit Functions on the TI-83
a:implicit.doc Page 3 of 8
Method 2: Parametric Mode (98AB6)
The given relation can be solved for x. Rewriting it as
(6y-12)x2 + (2y3+6y – 1) = 0
the equation is quadratic in x and we may apply the quadratic formula.
x =
-0± 02-4(6y-12)(2y3+6y-1)
2(6y-12)
=
± -4(6y-12)(2y3+6y-1)
12y-24
A graph you can trace can then be obtained in parametric mode as
follows.
x1(t) = -4(6T-12)(2T3+6T-1) /(12T-24) y1(t) = T (pos branch)
x2(t) = -x1(t) y2(t) = T (neg branch)
x3(t) = T y3(t) = -T (y=-x tan line)
This is a much better graph as it can be traced. It is incomplete,
however, as the solution to part (b) is missing. The point of horizontal
tangency (0, 0.165) is not plotted. This is due the fact that our
parametrization is undefined when T=0! Also, the point (-0.5, 0.5) is not on
the curve.
4. Graphing Implicit Functions on the TI-83
a:implicit.doc Page 4 of 8
Method 3: Function Mode and DrawInv (98AB6)
Use the same solution for x = f(y) as in Method 2 and graph it as y =
f(x). In other words let y1 = -4(6X-12)(X3+6X-1) /(12X-24) then use DrawInv
from the draw menu. What y1 is graphing is the inverse relation. If you
deselect y1, then DrawInv y1 and DrawInv –y1 will draw the given relation.
This is, however, another method which does not lend itself to trace
mode.
5. Graphing Implicit Functions on the TI-83
a:implicit.doc Page 5 of 8
Method 4: Function Mode and Solve()
As we are really solving the equation 2y3 + 6x2y – 12x2 + 6y – 1 = 0, let
y1=solve(2Z3 + 6x2Z – 12x2 + 6Z – 1,Z,0.5) and graph in ZOOM4. Be careful to
use alpha Z as X and Y are reserved for home screen output. What this
does is solve (from the catalog menu) for Z for each value of x in the
window using Newton’s Method near Z=0.5 and graphs the results as y
values. 0.5 is a good ‘guess’ for Newton’s Method as we know that y=0.5
is in the range of the relation.
This is by far the best method, if a little slow, for trace mode and the
calc menu as all ordered pairs in the implicit function are graphed for a
given window. We can even verify that the points (-0.5, 0.5) and (0, 0.165)
are part of the function. Also, f ’(0) = 0 and f ’(-0.5) = -1.
Please note, however, that this method works best when graphing a
function.
6. Graphing Implicit Functions on the TI-83
a:implicit.doc Page 6 of 8
Method 5: Polar Mode (94AB3)
What if the relation is quadratic in both x and y? We can then
discuss conic sections (see activity sheets). Graphing is also easy with a
change in coordinate system from cartesian to polar.
Consider the curve defined by x2 + xy + y2 = 27.
(a) Write an expression for the slope of the curve at any point (x, y).
(b) Determine whether the line tangent to the curve at the x-
intercepts of the curve are parallel. Show the analysis that
leads to your conclusion.
(c) Find the points on the curve where the lines tangent to the
curve are vertical.
(new d)
Make a complete sketch of x2 + xy + y2 = 27 including the
tangent lines found in parts (b) and (c).
Let x=rcos(θ) and y=rsin(θ), substitute, solve for r as an explicit function
of θ and let r1=f(θ) in polar mode and ZOOM6. Part (b) above is especially
easy to confirm with trace mode and the calc menu!
r2cos2(θ) + rcos(θ)rsin(θ) + r2sin2(θ) = 27
r2(cos2(θ) + cos(θ)sin(θ) + sin2(θ) = 27
r2(cos(θ)sin(θ) + 1) = 27
r2 =
27
cos(θ)sin(θ) + 1
r =
27
cos(θ)sin(θ) + 1
7. Graphing Implicit Functions on the TI-83
a:implicit.doc Page 7 of 8
You pick the Method: (92AB4)
Consider the curve defined by the equation y + cos y = x + 1
for 0 ≤≤≤≤ y ≤≤≤≤ 2ππππ.
(a) Find
dy
dx
in terms of y.
(b) Write an equation for each vertical tangent to the curve.
(c) Find
d2y
dx2 in terms of y.
(new d)
Make a complete sketch of y + cos y = x + 1 including the
vertical tangent.
This one is very easy to solve for x, so DrawInv or Parametric Mode
come to mind. What do you think? Use your graph to confirm your results
in parts (a) and (c). Where is the function increasing or decreasing?
Where is the function concave up or down?
8. Graphing Implicit Functions on the TI-83
a:implicit.doc Page 8 of 8
Activity Sheets: Exploring Implicit Functions and Conic Sections
In the attached activity sheets, we explore the world of conic
sections using questions similar to 94AB3. A conic section can be written
implicitly as:
Ax2 + Bxy + Cy2 + Dx + Ey + F = 0.
We will use Function Mode and Polar Mode methods here. By
letting some of these coefficients vary while others are zero, the student
can get a feel for what each coefficient affects in the shape of the conic.
When B=0, the student will see the effect of D and E by completing
the square and solving for y as an explicit function in x.
By letting D=E=0 and varying B, the student will learn to predict the
behavior of the implicit graph based on the value of B2 – 4AC in polar
mode.
We will investigate what happens when A and C are of equal
value, unequal value, same sign and differing sign.
All conic sections will be generated from circles and ellipses to
parabolas and hyperbolas to even the degenerate black sheep of the
family!