Download as PDF, PPTX


![copyright (c) 2013pixlcloud | turning data into actionable insights
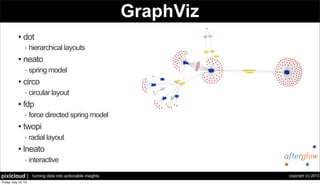
Data Processing
CSV File
AfterGlow
Graph
LanguageFile
digraph structs {
graph [label="AfterGlow 1.5.8", fontsize=8];
node [shape=ellipse, style=filled,
fontsize=10, width=1, height=1,
fixedsize=true];
edge [len=1.6];
"aaelenes" -> "Printing Resume" ;
"abbe" -> "Information Encryption" ;
"aanna" -> "Patent Access" ;
"aatharuv" -> "Ping" ;
}
aaelenes,Printing Resume
abbe,Information Encrytion
aanna,Patent Access
aatharuy,Ping
Parser Grapher](https://image.slidesharecdn.com/afterglow-130711012039-phpapp02/85/AfterGlow-2-320.jpg)
![copyright (c) 2013pixlcloud | turning data into actionable insights
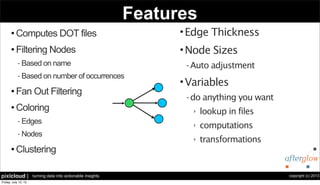
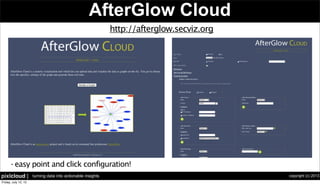
Data Processing
CSV File
AfterGlow
Graph
LanguageFile
digraph structs {
graph [label="AfterGlow 1.5.8", fontsize=8];
node [shape=ellipse, style=filled,
fontsize=10, width=1, height=1,
fixedsize=true];
edge [len=1.6];
"aaelenes" -> "Printing Resume" ;
"abbe" -> "Information Encryption" ;
"aanna" -> "Patent Access" ;
"aatharuv" -> "Ping" ;
}
aaelenes,Printing Resume
abbe,Information Encrytion
aanna,Patent Access
aatharuy,Ping
Parser Grapher](https://image.slidesharecdn.com/afterglow-130711012039-phpapp02/85/AfterGlow-3-320.jpg)
![copyright (c) 2013pixlcloud | turning data into actionable insights
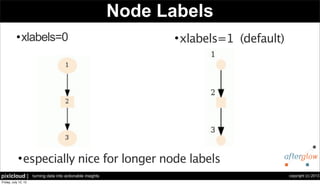
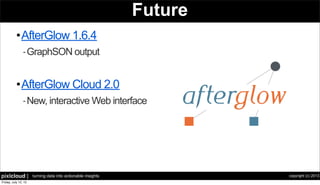
Configuration
l Coloring:
color.[source|event|target|edge|sourcetarget]=
<perl expression returning a color name>
l Array @fields contains input-line, split into tokens:
color.event=“red” if ($fields[1] =~ /^192..*/)
l Filter nodes with “invisible” color:
color.target=“invisible” if ($fields[0] eq “IIS Action”)](https://image.slidesharecdn.com/afterglow-130711012039-phpapp02/85/AfterGlow-5-320.jpg)
![copyright (c) 2013pixlcloud | turning data into actionable insights
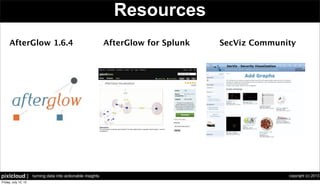
a
b
c
d
e
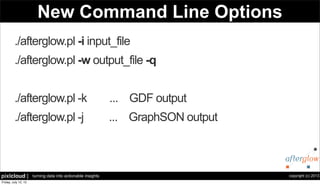
End-To-End Example
Output:
Input Data:
a,b
a,c
d,e
a
b
c
d
e
Command:
cat file | ./afterglow –c simple.properties –t |
neato –Tgif –o test.gif
simple.properties:
color.source=“green” if ($fields[0] ne “d”)
color.target=“blue” if ($fields[1] ne “e”)
color.source=“red”
color=“green”](https://image.slidesharecdn.com/afterglow-130711012039-phpapp02/85/AfterGlow-6-320.jpg)
![copyright (c) 2013pixlcloud | turning data into actionable insights
More Configuration
l Clustering:
cluster.[source|event|target]=
<perl expression returning a cluster name>
l Node Sizes:
size.[source|event|target]=
<perl expression returning a number>
maxnodesize=<value>
sum.[source|event|target]=[0|1]](https://image.slidesharecdn.com/afterglow-130711012039-phpapp02/85/AfterGlow-7-320.jpg)
![copyright (c) 2013pixlcloud | turning data into actionable insights
Variables / Code
l Variables
l Definition:
l Use:
l There are no limits on what to do with the “variables” keyword! You can put entire
scripts in there!
# Watch Lists
variable=@privileged=( "aaerchak" );
color.target="gold" if (grep(/$fields[0]/,@privileged));](https://image.slidesharecdn.com/afterglow-130711012039-phpapp02/85/AfterGlow-8-320.jpg)
![copyright (c) 2013pixlcloud | turning data into actionable insights
Command Line Options
Usage: afterglow.pl [-adhkmnqrstvx] [-b lines] [-c conffile] [-e length] [-f threshold ] [-g threshold] [-l lines]
[-o threshold] [-p mode] [-x color] [-m maxsize]
-a : turn off labelelling of the output graph with the configuration used
-b lines : number of lines to skip (e.g., 1 for header line)
-c conffile : config file
-d : print node count
-e length : edge length
-f threshold : source fan out threshold
-g threshold : event fan out threshold (only in three node mode)
-h : this (help) message
-i file : read from input file, instead of from STDIN
-k : output in GDF format instead of DOT
-l lines : the maximum number of lines to read
-m : the maximum size for a node
-n : don't print node labels
-o threshold : omit threshold (minimum count for nodes to be displayed)
Non-connected nodes will be filtered too.
-p mode : split mode for predicate nodes where mode is
0 = only one unique predicate node (default)
1 = one predicate node per unique subject node.
2 = one predicate node per unique target node.
3 = one predicate node per unique source/target node.
-q : suppress all output. Attention! You should use -w to write output to a file!
-r : print source node names
-s : split subject and object nodes
-t : two node mode (skip over objects)
-v : verbose output
-w file : write output to a file instead of STDOUT
-x : text label color](https://image.slidesharecdn.com/afterglow-130711012039-phpapp02/85/AfterGlow-10-320.jpg)
![copyright (c) 2013pixlcloud | turning data into actionable insights
Sample Configurations
# Variable and Color
variable=@violation=("Backdoor Access", "HackerTool Download”);
color.target="orange" if (grep(/$fields[1]/,@violation));
color.target="palegreen"
# Node Size and Threshold
maxnodesize=1;
size.source=$fields[2]
size=0.5
sum.source=0;
threshold.source=14;
# Color and Cluster
color.source="palegreen" if ($fields[0] =~ /^111/)
color.source="red"
color.target="palegreen"
cluster.source=regex_replace("(d+).d+")."/8"](https://image.slidesharecdn.com/afterglow-130711012039-phpapp02/85/AfterGlow-12-320.jpg)
![copyright (c) 2013pixlcloud | turning data into actionable insights
Advanced Configuration
• match() match("[0-9]")
- matches the current field and returns 0 or 1
• field() "red" if (field() eq "foo");
• subnet() subnet($fields[0],0.0.0.0/7)
- returns 0 or 1 depending on whether the value is in the given subnet
• regex_replace()
cluster.source=regex_replace("(d+.d+)")."/16"
if (!match("^(212.254.110|195.141.69)"))
- if one of the two ranges match(), then return the first two octets of the source IP and add the "/16" string.
• get_severity() color.source=get_severity($fields[2], 10)
- use a 10 step color range based on the third columns value](https://image.slidesharecdn.com/afterglow-130711012039-phpapp02/85/AfterGlow-13-320.jpg)


The document describes the Afterglow tool for processing data and turning it into visual insights, detailing features such as node filtering, color coding, and graph visualizations. It includes configuration options for customizing how data is displayed and parsed, with examples of usage and command line options. Additionally, the document highlights future developments and resources related to Afterglow.