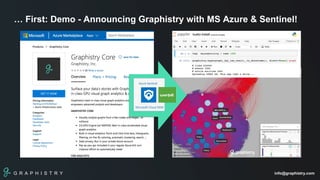
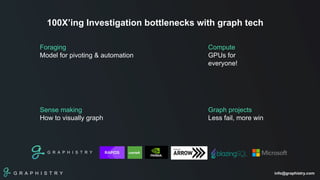
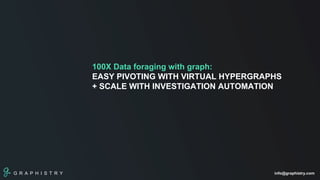
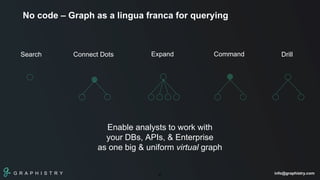
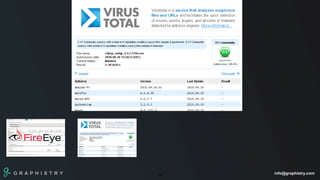
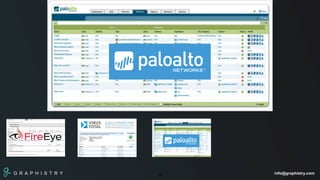
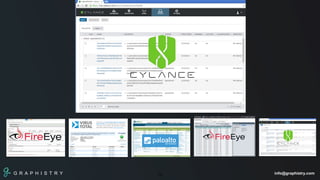
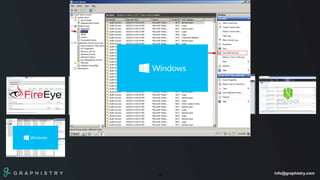
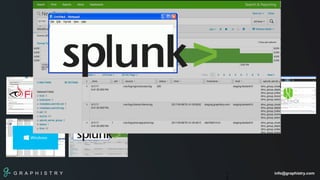
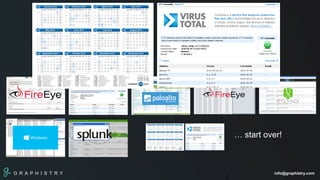
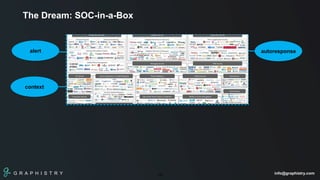
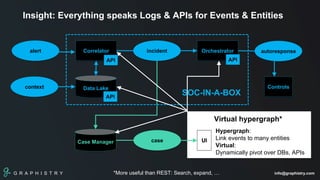
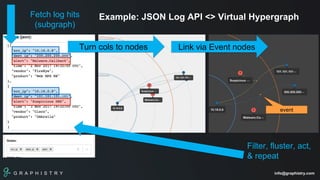
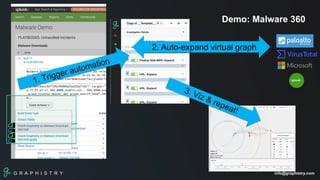
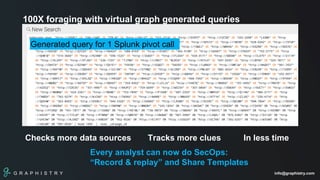
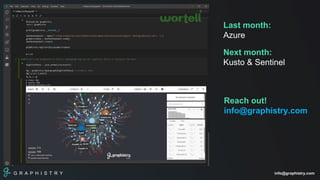
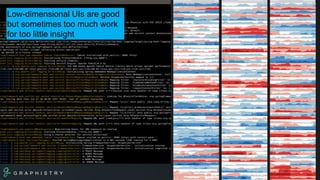
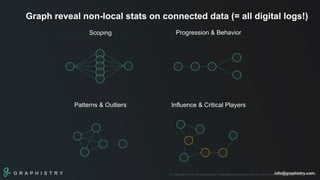
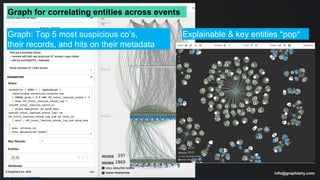
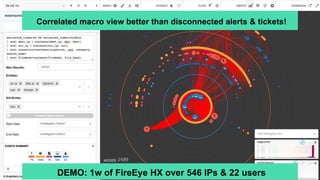
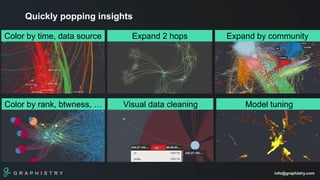
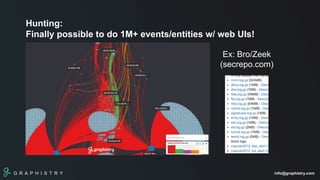
G R A P H I S T R Y info@graphistry.com
G R A P H I S T R Y
100X Investigations
Graph Workshop, BlueHat 2019, Seattle
Leo Meyerovich, CEO
G R A P H I S T R Y info@graphistry.com
… First: Demo - Announcing Graphistry with MS Azure & Sentinel!
G R A P H I S T R Y info@graphistry.com
100X’ing Investigation bottlenecks with graph tech
Foraging
Model for pivoting & automation
Compute
GPUs for
everyone!
Sense making
How to visually graph
Graph projects
Less fail, more win
G R A P H I S T R Y
G R A P H I S T R Y info@graphistry.com
100X Data foraging with graph:
EASY PIVOTING WITH VIRTUAL HYPERGRAPHS
+ SCALE WITH INVESTIGATION AUTOMATION
G R A P H I S T R Y info@graphistry.com5
Foraging Insight 1: The world as a virtual hypergraph
• 1K – 1M devices
• 1K – 1B users
• Digital activities: Payments, logins, clicks, …
• APIs: Software eating everything
G R A P H I S T R Y info@graphistry.com
No code – Graph as a lingua franca for querying
6
Search DrillCommandExpandConnect Dots
Enable analysts to work with
your DBs, APIs, & Enterprise
as one big & uniform virtual graph
G R A P H I S T R Y info@graphistry.com
IP=10.16.0.8; msg=Malware.Object;
time=2 Nov 2017 19:32:00 UTC;
vendor=FireEye; Product=Web MPS NX
7
Data foraging today
G R A P H I S T R Y info@graphistry.com8
G R A P H I S T R Y info@graphistry.com9
G R A P H I S T R Y info@graphistry.com10
G R A P H I S T R Y info@graphistry.com11
G R A P H I S T R Y info@graphistry.com12
G R A P H I S T R Y info@graphistry.com13
G R A P H I S T R Y info@graphistry.com1
4
14
G R A P H I S T R Y info@graphistry.com1
5
15
… start over!
G R A P H I S T R Y info@graphistry.com16
G R A P H I S T R Y info@graphistry.com17
knowing: tools x tables x fields
gathering: complete, fresh, fidelity… APIs??
stitching together into a story
… for each incident type x info source!
Foraging is TOUGH
G R A P H I S T R Y info@graphistry.com18
alert autoresponseCorrelator
Data Lake
Orchestratorincident
The Dream: SOC-in-a-Box
context
SOC-IN-A-BOX
G R A P H I S T R Y info@graphistry.com19
alert autoresponseCorrelator
Data Lake
Orchestrator
Controls
incident
Insight: Everything speaks Logs & APIs for Events & Entities
Case Manager
context
UIcase
Virtual hypergraph*
SOC-IN-A-BOX
Hypergraph:
Link events to many entities
Virtual:
Dynamically pivot over DBs, APIs
API API
API
*More useful than REST: Search, expand, …
G R A P H I S T R Y info@graphistry.com
Turn cols to nodes Link via Event nodes
event
Fetch log hits
(subgraph)
Filter, fluster, act,
& repeat
Example: JSON Log API <> Virtual Hypergraph
G R A P H I S T R Y info@graphistry.com
100X Data foraging with graph:
EASY PIVOTING WITH VIRTUAL HYPERGRAPHS
+ SCALE WITH INVESTIGATION AUTOMATION
G R A P H I S T R Y info@graphistry.com
Demo: Malware 360
2. Auto-expand virtual graph
G R A P H I S T R Y info@graphistry.com
100X foraging with virtual graph generated queries
Checks more data sources Tracks more clues In less time
Every analyst can now do SecOps:
“Record & replay” and Share Templates
Generated query for 1 Splunk pivot call
G R A P H I S T R Y info@graphistry.com
Management perspective: 80/20 rule for covering functional KPIs
80% of DATA
endpoint logs & alerts
user logs & alerts
server logs & alerts
network logs & alerts
service logs & alerts
ticket APIs
…
80% of INCIDENTS
malware
phishing
cloud tenant breach
app server takeover
device theft
offboarding
…
80% of TASKS
high-fidelity quick check
investigative deep dive
mitigation/containment/report
table top training
automation
...
Overdue to make investigation structured & predictable!
• Incident SLA
• Investigation depth (burnout!)
• Satellite team methodology
• …
G R A P H I S T R Y info@graphistry.com
Last month:
Azure
Next month:
Kusto & Sentinel
Reach out!
info@graphistry.com
G R A P H I S T R Y info@graphistry.com
100X Sense making with graph
G R A P H I S T R Y info@graphistry.com
Low-dimensional UIs are good
but sometimes too much work
for too little insight
G R A P H I S T R Y info@graphistry.com
Graph reveal non-local stats on connected data (= all digital logs!)
© 2018 Graphistry, Inc. All rights reserved. Confidential and proprietary information. Do not distribute. info@graphistry.com | 28
Scoping
Patterns & Outliers Influence & Critical Players
Progression & Behavior
G R A P H I S T R Y info@graphistry.com
Case study: Classic ML + graph analytics
PROJECT ARTEMIS
Massage parlor records & reviews:
• Normal
• Maybe illicit business
• Maybe human trafficking
G R A P H I S T R Y info@graphistry.com
UMAP: Classic ML likes numbers, times, pixel RGBs, scores,
…
@leland_mcinnes
G R A P H I S T R Y info@graphistry.com
RAPIDS UMAP layout
Tensorflow categorization
Graphistry visual analytics
Splunk data lake
regular review
potential illicit activity
potential trafficking
41K Reviews => 400 flagged
G R A P H I S T R Y info@graphistry.com
Graph: Top 5 most suspicious co’s,
their records, and hits on their metadata
Explainable & key entities *pop*
Graph for correlating entities across events
G R A P H I S T R Y info@graphistry.com
Correlated macro view better than disconnected alerts & tickets!
DEMO: 1w of FireEye HX over 546 IPs & 22 users
G R A P H I S T R Y info@graphistry.com
Quickly popping insights
Color by time, data source Expand 2 hops Expand by community
Color by rank, btwness, … Visual data cleaning Model tuning
G R A P H I S T R Y info@graphistry.com
100X Compute:
GPUs for everyone
What if we could easily compute over full datasets in subsecond?
G R A P H I S T R Y info@graphistry.com
Hunting:
Finally possible to do 1M+ events/entities w/ web UIs!
Ex: Bro/Zeek
(secrepo.com)
G R A P H I S T R Y info@graphistry.com
GPUs for everyone
2014/2015
GPU Dataframes
Graphistry NSF SBIR
2016/2017
GOAI, Apache Arrow
+ Nvidia, MapD, Blazing, …
2018/2019
RAPIDS
+ Databricks, Ursa, …
Shared GPU format,
portability (Docker, …)
Dataframes, SQL,
ML, graph, spatial,
& infra (IO, multi-gpu)
G R A P H I S T R Y info@graphistry.com
Faster Speeds, Real-World Benefits
cuIO/cuDF –
Load and Data Preparation cuML - XGBoost
Time in seconds (shorter is better)
cuIO/cuDF (Load and Data Prep) Data Conversion XGBoost
Benchmark
200GB CSV dataset; Data prep includes
joins, variable transformations
CPU Cluster Configuration
CPU nodes (61 GiB memory, 8 vCPUs, 64-
bit platform), Apache Spark
DGX Cluster Configuration
5x DGX-1 on InfiniBand
network
8762
6148
3925
3221
322
213
End-to-End
my_gdf.groupby([‘src_ip’,’dest_ip’])[‘time’].plot()
G R A P H I S T R Y info@graphistry.com
cuGraph
Multi-GPU PageRank Performance
PageRank portion of the HiBench benchmark suite
HiBench Scale Vertices Edges CSV File
(GB)
# of GPUs PageRank for
3 Iterations (secs)
Huge 5,000,000 198,000,000 3 1 1.1
BigData 50,000,000 1,980,000,000 34 3 5.1
BigData x2 100,000,000 4,000,000,000 69 6 9.0
BigData x4 200,000,000 8,000,000,000 146 12 18.2
BigData x8 400,000,000 16,000,000,000 300 16 31.8
Graph().add_edges(my_df).pagerank()
G R A P H I S T R Y info@graphistry.com
graph = netflow_df.sql(“““
SELECT
sum(bytes),
min(time),
max(time)
GROUP BY src_ip, dest_ip
”””)
graphistry.plot(graph)
BlazingSQL’s C++ skips cuDF’s Python Numba JIT…
so _great_ for subsecond interactivity!
G R A P H I S T R Y info@graphistry.com
Closing remarks: Scaling graph _projects_
Avoid failure to launch by avoiding infra & NIH:
1d-1mo: Cloud, viz, on-the-fly compute, notebooks, API connectors
3mo-never: Graph DB, Kafka ingest, Hadoop, on-prem, custom analytics, custom UIs
Useful by design: Make user+problem #1 driver, not infra
Win ROI politics w/ cupcake principle: Big projects start as small projects
Lower switching costs by augmenting vs. replacing
Everyone used to status quo and uninterested in avoidable work..
Start w/ good champions: Ideally innovative, influential, technical, & has time
grow from there
Gartner: “85% of data science projects fail.”
G R A P H I S T R Y info@graphistry.com
100X investigations
Modeling: Virtual graph, hypergraphs, & automations
Insight: Graph viz + graph stats + ML
GPUs for full data pipeline! Try RAPIDS ecosystem –
cudf, blazingsql, cugraph, graphistry, …
Use data project best practices: Less fail, faster win
info@graphistry.com
• Now in Azure
• Contact for Kusto/Sentinel!
• GPU graph viz & investigation
automation

100X Investigations - Graphistry / Microsoft BlueHat

  • 1.
    G R AP H I S T R Y info@graphistry.com G R A P H I S T R Y 100X Investigations Graph Workshop, BlueHat 2019, Seattle Leo Meyerovich, CEO
  • 2.
    G R AP H I S T R Y info@graphistry.com … First: Demo - Announcing Graphistry with MS Azure & Sentinel!
  • 3.
    G R AP H I S T R Y info@graphistry.com 100X’ing Investigation bottlenecks with graph tech Foraging Model for pivoting & automation Compute GPUs for everyone! Sense making How to visually graph Graph projects Less fail, more win G R A P H I S T R Y
  • 4.
    G R AP H I S T R Y info@graphistry.com 100X Data foraging with graph: EASY PIVOTING WITH VIRTUAL HYPERGRAPHS + SCALE WITH INVESTIGATION AUTOMATION
  • 5.
    G R AP H I S T R Y info@graphistry.com5 Foraging Insight 1: The world as a virtual hypergraph • 1K – 1M devices • 1K – 1B users • Digital activities: Payments, logins, clicks, … • APIs: Software eating everything
  • 6.
    G R AP H I S T R Y info@graphistry.com No code – Graph as a lingua franca for querying 6 Search DrillCommandExpandConnect Dots Enable analysts to work with your DBs, APIs, & Enterprise as one big & uniform virtual graph
  • 7.
    G R AP H I S T R Y info@graphistry.com IP=10.16.0.8; msg=Malware.Object; time=2 Nov 2017 19:32:00 UTC; vendor=FireEye; Product=Web MPS NX 7 Data foraging today
  • 8.
    G R AP H I S T R Y info@graphistry.com8
  • 9.
    G R AP H I S T R Y info@graphistry.com9
  • 10.
    G R AP H I S T R Y info@graphistry.com10
  • 11.
    G R AP H I S T R Y info@graphistry.com11
  • 12.
    G R AP H I S T R Y info@graphistry.com12
  • 13.
    G R AP H I S T R Y info@graphistry.com13
  • 14.
    G R AP H I S T R Y info@graphistry.com1 4 14
  • 15.
    G R AP H I S T R Y info@graphistry.com1 5 15 … start over!
  • 16.
    G R AP H I S T R Y info@graphistry.com16
  • 17.
    G R AP H I S T R Y info@graphistry.com17 knowing: tools x tables x fields gathering: complete, fresh, fidelity… APIs?? stitching together into a story … for each incident type x info source! Foraging is TOUGH
  • 18.
    G R AP H I S T R Y info@graphistry.com18 alert autoresponseCorrelator Data Lake Orchestratorincident The Dream: SOC-in-a-Box context SOC-IN-A-BOX
  • 19.
    G R AP H I S T R Y info@graphistry.com19 alert autoresponseCorrelator Data Lake Orchestrator Controls incident Insight: Everything speaks Logs & APIs for Events & Entities Case Manager context UIcase Virtual hypergraph* SOC-IN-A-BOX Hypergraph: Link events to many entities Virtual: Dynamically pivot over DBs, APIs API API API *More useful than REST: Search, expand, …
  • 20.
    G R AP H I S T R Y info@graphistry.com Turn cols to nodes Link via Event nodes event Fetch log hits (subgraph) Filter, fluster, act, & repeat Example: JSON Log API <> Virtual Hypergraph
  • 21.
    G R AP H I S T R Y info@graphistry.com 100X Data foraging with graph: EASY PIVOTING WITH VIRTUAL HYPERGRAPHS + SCALE WITH INVESTIGATION AUTOMATION
  • 22.
    G R AP H I S T R Y info@graphistry.com Demo: Malware 360 2. Auto-expand virtual graph
  • 23.
    G R AP H I S T R Y info@graphistry.com 100X foraging with virtual graph generated queries Checks more data sources Tracks more clues In less time Every analyst can now do SecOps: “Record & replay” and Share Templates Generated query for 1 Splunk pivot call
  • 24.
    G R AP H I S T R Y info@graphistry.com Management perspective: 80/20 rule for covering functional KPIs 80% of DATA endpoint logs & alerts user logs & alerts server logs & alerts network logs & alerts service logs & alerts ticket APIs … 80% of INCIDENTS malware phishing cloud tenant breach app server takeover device theft offboarding … 80% of TASKS high-fidelity quick check investigative deep dive mitigation/containment/report table top training automation ... Overdue to make investigation structured & predictable! • Incident SLA • Investigation depth (burnout!) • Satellite team methodology • …
  • 25.
    G R AP H I S T R Y info@graphistry.com Last month: Azure Next month: Kusto & Sentinel Reach out! info@graphistry.com
  • 26.
    G R AP H I S T R Y info@graphistry.com 100X Sense making with graph
  • 27.
    G R AP H I S T R Y info@graphistry.com Low-dimensional UIs are good but sometimes too much work for too little insight
  • 28.
    G R AP H I S T R Y info@graphistry.com Graph reveal non-local stats on connected data (= all digital logs!) © 2018 Graphistry, Inc. All rights reserved. Confidential and proprietary information. Do not distribute. info@graphistry.com | 28 Scoping Patterns & Outliers Influence & Critical Players Progression & Behavior
  • 29.
    G R AP H I S T R Y info@graphistry.com Case study: Classic ML + graph analytics PROJECT ARTEMIS Massage parlor records & reviews: • Normal • Maybe illicit business • Maybe human trafficking
  • 30.
    G R AP H I S T R Y info@graphistry.com UMAP: Classic ML likes numbers, times, pixel RGBs, scores, … @leland_mcinnes
  • 31.
    G R AP H I S T R Y info@graphistry.com RAPIDS UMAP layout Tensorflow categorization Graphistry visual analytics Splunk data lake regular review potential illicit activity potential trafficking 41K Reviews => 400 flagged
  • 32.
    G R AP H I S T R Y info@graphistry.com Graph: Top 5 most suspicious co’s, their records, and hits on their metadata Explainable & key entities *pop* Graph for correlating entities across events
  • 33.
    G R AP H I S T R Y info@graphistry.com Correlated macro view better than disconnected alerts & tickets! DEMO: 1w of FireEye HX over 546 IPs & 22 users
  • 34.
    G R AP H I S T R Y info@graphistry.com Quickly popping insights Color by time, data source Expand 2 hops Expand by community Color by rank, btwness, … Visual data cleaning Model tuning
  • 35.
    G R AP H I S T R Y info@graphistry.com 100X Compute: GPUs for everyone What if we could easily compute over full datasets in subsecond?
  • 36.
    G R AP H I S T R Y info@graphistry.com Hunting: Finally possible to do 1M+ events/entities w/ web UIs! Ex: Bro/Zeek (secrepo.com)
  • 37.
    G R AP H I S T R Y info@graphistry.com GPUs for everyone 2014/2015 GPU Dataframes Graphistry NSF SBIR 2016/2017 GOAI, Apache Arrow + Nvidia, MapD, Blazing, … 2018/2019 RAPIDS + Databricks, Ursa, … Shared GPU format, portability (Docker, …) Dataframes, SQL, ML, graph, spatial, & infra (IO, multi-gpu)
  • 38.
    G R AP H I S T R Y info@graphistry.com Faster Speeds, Real-World Benefits cuIO/cuDF – Load and Data Preparation cuML - XGBoost Time in seconds (shorter is better) cuIO/cuDF (Load and Data Prep) Data Conversion XGBoost Benchmark 200GB CSV dataset; Data prep includes joins, variable transformations CPU Cluster Configuration CPU nodes (61 GiB memory, 8 vCPUs, 64- bit platform), Apache Spark DGX Cluster Configuration 5x DGX-1 on InfiniBand network 8762 6148 3925 3221 322 213 End-to-End my_gdf.groupby([‘src_ip’,’dest_ip’])[‘time’].plot()
  • 39.
    G R AP H I S T R Y info@graphistry.com cuGraph Multi-GPU PageRank Performance PageRank portion of the HiBench benchmark suite HiBench Scale Vertices Edges CSV File (GB) # of GPUs PageRank for 3 Iterations (secs) Huge 5,000,000 198,000,000 3 1 1.1 BigData 50,000,000 1,980,000,000 34 3 5.1 BigData x2 100,000,000 4,000,000,000 69 6 9.0 BigData x4 200,000,000 8,000,000,000 146 12 18.2 BigData x8 400,000,000 16,000,000,000 300 16 31.8 Graph().add_edges(my_df).pagerank()
  • 40.
    G R AP H I S T R Y info@graphistry.com graph = netflow_df.sql(“““ SELECT sum(bytes), min(time), max(time) GROUP BY src_ip, dest_ip ”””) graphistry.plot(graph) BlazingSQL’s C++ skips cuDF’s Python Numba JIT… so _great_ for subsecond interactivity!
  • 41.
    G R AP H I S T R Y info@graphistry.com Closing remarks: Scaling graph _projects_ Avoid failure to launch by avoiding infra & NIH: 1d-1mo: Cloud, viz, on-the-fly compute, notebooks, API connectors 3mo-never: Graph DB, Kafka ingest, Hadoop, on-prem, custom analytics, custom UIs Useful by design: Make user+problem #1 driver, not infra Win ROI politics w/ cupcake principle: Big projects start as small projects Lower switching costs by augmenting vs. replacing Everyone used to status quo and uninterested in avoidable work.. Start w/ good champions: Ideally innovative, influential, technical, & has time grow from there Gartner: “85% of data science projects fail.”
  • 42.
    G R AP H I S T R Y info@graphistry.com 100X investigations Modeling: Virtual graph, hypergraphs, & automations Insight: Graph viz + graph stats + ML GPUs for full data pipeline! Try RAPIDS ecosystem – cudf, blazingsql, cugraph, graphistry, … Use data project best practices: Less fail, faster win info@graphistry.com • Now in Azure • Contact for Kusto/Sentinel! • GPU graph viz & investigation automation