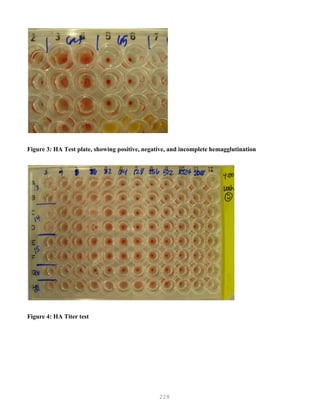
Downloaded 95 times


![9
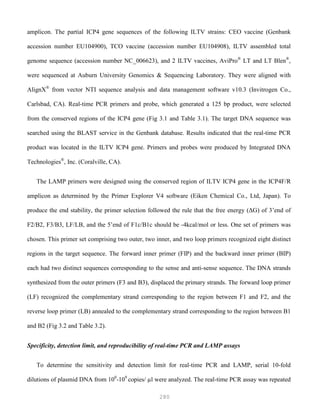
Streptococcus pyogenes abbreviation S. pyogenes). There is always two parts to the species
name one defining the genus in this case "Streptococcus" and the other the species (in this case
"pyogenes"). The genus name is always capitalized but the species name is not. Both species and genus
are underlined or in italics.
B. The Diagnostic Laboratory
The diagnostic laboratory uses taxonomic principles to identify bacterial species from birds.
When birds are suspected of having a bacterial infection, it is usual to isolate visible colonies of the
organism in pure culture (on agar plates) and then speciate the organism. Physiological methods for
speciation of bacteria (based on morphological and metabolic characteristics) are simple to perform,
reliable and easy to learn and are the backbone of hospital clinical microbiology laboratory. More
advanced reference laboratories, or laboratories based in larger medical schools additionally use
genetic testing.
Isolation by culture and identification of bacteria from patients, aids treatment since infectious
diseases caused by different bacteria has a variety of clinical courses and consequences. Susceptibility
testing of isolates (i.e. establishing the minimal inhibitory concentration [MIC]) can help in selection of
antibiotics for therapy. Recognizing that certain species (or strains) are being isolated atypically may
suggest that an outbreak has occurred e.g. from contaminated hospital supplies or poor aseptic
technique on the part of certain personnel.
Steps in diagnostic isolation and identification of bacteria
Step 1. Samples of body fluids (e.g. blood, urine, cerebrospinal fluid) are streaked on culture plates and
isolated colonies of bacteria (which are visible to the naked eye) appear after incubation for one - several
days. It is not uncommon for cultures to contain more than one bacterial species (mixed cultures). If
they are not separated from one another, subsequent tests can’t be readily interpreted. Each colony
consists of millions of bacterial cells. Observation of these colonies for size, texture, color, and (if
grown on blood agar) hemolysis reactions, is highly important as a first step in bacterial identification.
Whether the organism requires oxygen for growth is another important differentiating characteristic.
Step 2. Colonies are Gram stained and individual bacterial cells observed under the microscope.
Step 3. The bacteria are speciated using these isolated colonies. This often requires an additional 24 hr
of growth.
Step 4. Antibiotic susceptibility testing is performed (optional)
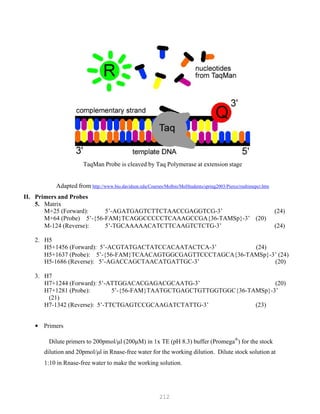
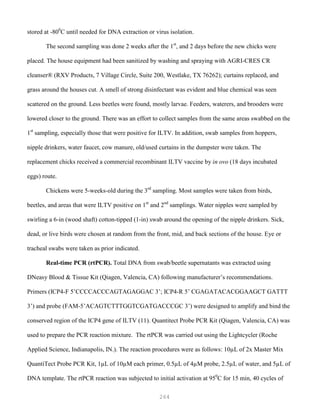
THE GRAM STAIN, a colony is dried on a slide and treated as follows: 3
Step 1. Staining with crystal violet.
Step 2. Fixation with iodine stabilizes crystal violet staining. All bacteria remain purple or blue.
Step 3. Extraction with alcohol or other solvent. Decolorizes some bacteria (Gram negative) and not
others (Gram positive).
Step 4. Counterstaining with safranin. Gram positive bacteria are already stained with crystal violet
and remain purple. Gram negative bacteria are stained pink.
Under the microscope the appearance of bacteria are observed including: Are they Gram
positive or negative? What is the morphology (rod, coccus, spiral, pleomorphic [variable form] etc)?
Do cells occur singly or in chains, pairs etc? How large are the cells? There are other less commonly
employed stains available (e.g. for spores and capsules).
Another similar colony from the primary isolation plate is then examined for biochemical
properties (e.g. will it ferment a sugar such as lactose). In some instances the bacteria are identified](https://image.slidesharecdn.com/advancedlabtechniquesrevised8-12-2013-160325173547/85/Advanced-Lab-Techniques-in-Avian-Medicine-9-320.jpg)
![10
(e.g. by aggregation) with commercially available antibodies recognizing defined surface antigens. As
noted above genetic tests are now widely used.
Genetic characterization of bacteria
Whole genomes of a representative strain of many of the major human pathogens have been
sequenced, and this is referred to as genomics. This huge data-base of sequences is highly useful in
helping design diagnostic tests. However, rarely are more than one or two representative genomes
sequenced. There is a lot of variability in sequences among individual strains. Thus for practical
reasons, genetic comparisons must involve multiple strains. Certain genes have been selected to define
common traits among species and then this information is used to develop diagnostic tests.
1. Sequencing of 16S ribosomal RNA molecules (16S rRNA) has become the "gold standard" in
bacterial taxonomy. The molecule is approximately sixteen hundred nucleotides in length. The
sequence of 16S rRNA differentiates bacterial species.
2. Once the sequence is known, specific genes (e.g. 16S rRNA) are detected by amplification using the
polymerase chain reaction, PCR. The amplified product is then detected most simply by fluorescence
(“real time” PCR) or by gel electrophoresis (the molecular weight of the product).
3. DNA-DNA homology (or how well two strands of DNA from different bacteria bind [hybridize]
together) is employed to compare the genetic relatedness of bacterial strains/species. If the DNA from
two bacterial strains display a high degree of homology (i.e. they bind well) the strains are considered
to be members of the same species.
4. The guanine (G)+ cytosine (C) content usually expressed as a percentage (% GC) is now only of
historical value.
Chemical analysis
Commonly fatty acid profiling is used. The chain length of structural fatty acids present in the
membranes of bacteria is determined. Protein profiling is rapidly expanding. Characterization of
secreted metabolic products (e.g. volatile alcohols and short chain fatty acids) is also employed.
Rapid diagnosis without prior culture
Certain pathogens either can’t be isolated in the laboratory or grow extremely poorly.
Successful isolation can be slow and in some instances currently impossible. Direct detection of
bacteria without culture is possible in some cases; some examples are given below.
Bacterial DNA sequences can be amplified directly from human body fluids using PCR. For
example, great success has been achieved in rapid diagnosis of tuberculosis.
A simple approach to rapid diagnosis (as an example of antigen detection) is used in many
doctor's offices for the group A streptococcus. The patient's throat is swabbed and streptococcal
antigen extracted directly from the swab (without prior bacteriological culture). The bacterial antigen is
detected by aggregation (agglutination) of antibody coated latex beads.
Direct microscopic observation of certain clinical samples for the presence of bacteria can be
helpful (e.g. detection of M. tuberculosis in sputum). However, sensitivity is poor and many false
negatives occur.
Serologic identification of an antibody response (in patient's serum) to the infecting agent can
only be successful several weeks after an infection has occurred. This is commonly used in](https://image.slidesharecdn.com/advancedlabtechniquesrevised8-12-2013-160325173547/85/Advanced-Lab-Techniques-in-Avian-Medicine-10-320.jpg)
![121
It is important to use the same batch of electrophoresis buffer in both the electrophoresis tank
and the gel. Small differences in ionic strength of pH create fronts in the gel that can greatly
affect the mobility of the fragments.
3. Loosely plug the neck of the Erlenmeyer flask with tissue paper such as Kimwipes®. When
using a glass bottle, make sure the cap is loose. Heat the slurry in a boiling-water bath or a
microwave oven until the agarose dissolves.
Wearing an oven mitt, gingerly swirl the bottle or flask from time to time to make sure that any
grains sticking to the walls enter the solution. Take care—the agarose solution can become
superheated and may boil violently if it has been heated for too long in the microwave oven.
Undissolved agarose appears as small “lenses” floating in the solution. Check that the volume
of the solution has not been decreased by evaporation during boiling; replenish with water, if
necessary.
4. Cool the solution to 60C, and, if desired, add ethidium bromide (from a stock solution of 10
mg/ml in water) to a final concentration of 0.5 g/ml and mix thoroughly.
Caution: Ethidium bromide is a powerful mutagen and is moderately toxic. Gloves should be
worn when working with solutions that contain this dye. Stock solutions of ethidium bromide
should be stored in light-tight containers (e.g., in a bottle completely wrapped in aluminum
foil) in the refrigerator.
5. Position the comb 0.5 – 1.0 mm above the plate so that a complete well is formed when the
agarose is added. If the comb is closer to the glass plate, there is a risk that the base of the well
may tear when the comb is withdrawn, allowing the sample to leak between the gel and the glass
plate.
5. Pour the warm agarose solution into the mold. The gel should be between 3 mm and 5 mm
thick. Check to see that there are no air bubbles under or between the teeth of the comb.
7. After the gel is completely set (30 – 45 minutes at room temperature), carefully remove the
comb and autoclave tape and mount the gel in the electrophoresis tank.
8. Add just enough electrophoresis buffer to cover the gel to a depth of about 1 mm.
9. Mix the samples of RNA with the desired gel-loading buffer (Table 1.1). Slowly load the
mixture into the slots of the submerged gel using a disposable micropipette, an automatic
micropipettor, or, if you have a very steady hand, a Pasteur pipette.
The maximum volume of solution that can be loaded is determined by the dimensions
of the slot. A typical slot [0.5 cm x 0.5 cm x 0.15 cm] will hold about 37.5 l. However, to
reduce the possibility of contaminating neighboring samples, it is best to make the gel a little](https://image.slidesharecdn.com/advancedlabtechniquesrevised8-12-2013-160325173547/85/Advanced-Lab-Techniques-in-Avian-Medicine-121-320.jpg)
![134
RESTRICTION FRAGMENT LENGTH POLYMORPHISM
Introduction
Examination of DNA fragment patterns by electrophoresis in agarose gels following digestion
with restriction endonucleases is a sensitive method for distinguishing between strains of
microorganisms. The technique has been described for numerous bacteria, mycoplasma and DNA
viruses. If workers use the enzymes, which cut DNA in specific sites, the result of DNA fragments are
separated by electrophoresis in a gel. Differences in the number and the length of the fragments can be
used to distinguish between closely related organisms. This technique is commonly referred to as
restriction endonuclease analysis, restriction fragment length polymorphism (RFLP), or DNA finger
printing. Before one can utilize these techniques, the concept of restriction enzyme should be
thoroughly understood.
An important tool used by the molecular biologist in manipulating DNA, is restriction
enzymes. Over the years, the number and uses of these enzymes have increased as new molecules
have been discovered, our understanding of the details of the enzymatic reactions has improved, and
many commercial manufacturers of products have emerged to guarantee the widespread availability of
these reagents. With these advances, the task of the molecular biologist has been both simplified and
expanded in scope. In this section, we describe many of the properties and uses of these important
components in various procedures.
Restriction enzymes bind specifically to and cleave double-stranded DNA at specific sites
within or adjacent to a particular sequence known as the recognition sequence. These enzymes cut the
DNA at the recognition site and then dissociate from the substrate. These enzymes are referred to as
restriction endonucleases. Other enzymes may modify the DNA such as DNA methylation enzymes.
In addition to cutting the DNA, they may change it with a separate methylase that modifies the
recognition site. Restriction enzymes may recognize specific sequences that are four, five or six
nucleotides in length.
Different manufacturers of restriction enzymes recommend different digestion conditions, even
for the same restriction enzyme. Because most manufacturers have optimized the reaction conditions
for their particular preparations, it is recommended to follow the instructions on the information sheets
supplied with the enzymes. Some manufacturers also supply concentrated buffers that have been
tested for efficacy with each batch of purified enzyme. These buffers should be used whenever
possible.
Buffers for different restriction enzymes differ chiefly in the concentration of NaCl that they
contain. When DNA is to be cleaved with two or more restriction enzymes, the digestions can be
carried out simultaneously if both enzymes work well in the same buffer. If the enzymes have
different requirements, two alternatives are possible: (1) The DNA should be digested first with the
enzyme that works best in the buffer in lower ionic strength. The appropriate amount of NaCl and the
second enzyme can then be added and the incubation continued. (2) A single buffer (potassium
glutamate buffer [KGB]) can be used for virtually all restriction enzymes.](https://image.slidesharecdn.com/advancedlabtechniquesrevised8-12-2013-160325173547/85/Advanced-Lab-Techniques-in-Avian-Medicine-134-320.jpg)
![138
with lambda DNA double cut with EcoRI and HindIII as molecular weight markers, are added (20) and
electrophoresis conducted at 50 V (1.6 V/cm) for 16 to 17 h at 200
C. After electrophoresis, the gels are
stained for 1 h at 200
C with 500 g ethidium bromide in 1 liter H O. They are destained for 30 min in 1B
2B
liter of HB
2BO and exposed for 45 s with UV light from a transilluminator camera with a Wrattan filter.
Restriction enzyme analysis for Mycoplasma synoviae
Procedures for MG and MS are similar with a few modifications. MS is propagated in Frey’s
broth medium with 12% swine serum. Cells are harvested by centrifugation and washed three times in
phosphate –buffered saline (pH 7.2, 150 mM), and pellets stored at -700
C.
Preparation of DNA
Cell pellets in microcentrifuge tubes are resuspended in 1.0 ml of TNE buffer (25 mM Tris-Cl
[pH 7.4], 150 mM NaCl, 2 mM EDTA) and transferred to 15 ml glass centrifuge tubes. Cells are lysed
by adding 1.0 ml 5% sodium dodecyl sulfate (SDS) and incubating at room temperature for 5 minutes.
DNA is extracted with 2.0 ml TNE-saturated phenol-chloroform (350 g redistilled phenol, 70 ml
chloroform, 50 ml m-cresol, 0.4 g 8-hydroxyquinoline) by vortex mixing, and then incubating for 10
minutes on ice. The aqueous phase is collected after centrifugation. DNA is precipitated by addition
of two volumes of cold (-20 0
C) 95% ethanol. Precipitate collected by centrifugation at 15,000 x g for
15 minutes, decanting the supernatant, and allowing the tube interior to dry. Precipitated DNA is
resuspended in 1.0 ml distilled water containing Rnase A (50 µg /ml, Sigma Chemical Co., St. Louis,
Missouri), incubated 2 hr at 37 0
C, and stored at -20 0
C.
DNA Digestion
Digestion mixtures contained 1 ul (10 units) of restriction endonuclease (RE), BglII, EcoRI, or
HindIII (Bethesda Research Laboratories, Gaithersburg, MD), 3ul of 10 x digestion buffer, and
sufficient DNA (usually 15 to 25 ul) to produce clear DNA bands. Distilled water is added to make a
total digestion volume of 30 ul, and the mixture incubated for 1.5 hr at 37 C. Six ul of loading buffer
(0.25% bromophenol blue, 0.25% xylene cyanol, 15% Ficoll type 400) is added.
Electrophoresis of digested DNA
Electrophoresis of digested DNA is conducted in a 15 x 20-cm horizontal slab gel
electrophoresis apparatus. Gels are poured to a depth of 5 mm with 0.7% agarose (Agarose NA;
Pharmacia AB, Uppsala, Sweden) in TBE (89 mM Tris [pH 8.3], 89 mM boric acid, 2 mM EDTA)
buffer (Sigma). Gels are submerged in TBE; DNA digestion mixture (20 to 30 ul) is added, and
electrophoresis conducted at 36 V (1.2 V/cm) for 15 hr. Gels are stained for 30 minutes with 750 µg
ethidium bromide (Sigma) in 500 ml deionized water, destained for 20 minutes in 500 ml deionized
water, exposed with ultraviolet light from a transilluminator and photographed.
This technique is rapid, highly sensitive and provides useful data for comparing and differentiating
mycoplasma strains in epidemiological studies.](https://image.slidesharecdn.com/advancedlabtechniquesrevised8-12-2013-160325173547/85/Advanced-Lab-Techniques-in-Avian-Medicine-138-320.jpg)
![151
Table 4.0 List a number of commercially available nonradioactive nucleic acid detection systems. The number
continues to expand at a rapid rate.
Mode of labeling
Mode of
detection
Sensitivity [pg]/
copy number PaP
Development/availability
Systems on
polynucleotide basis
Enzymatic modification
Biotin-dUTP/Nick
translation
Streptavidin-AP 10/1 x 10P6P
Enzo Chemical lab., Inc.
Biotin-dUTP/Tailing Streptavidin-AP 10/1 x 10P6P
Enzo
Biotin-dATP/Nick 4P
translation
Streptavidin-AP 0.5/5 x 10P
Digoxigenin-
Life Technologies
dUTP/Random
Priming
Digoxigenin-
Anti-
Digoxigenin-AP
Anti-
1.1/1 x 10P4P Boehringer Mannheim,
Inc.
4P Boehringer Mannheim,
rUTP/Transcription
AP = Alkaline phosphatase
Digoxigenin-AP
0.1/1 x 10P
Inc.
Dot and Slot Hybridization
Dot hybridizations are performed by spotting a small sample of the nucleic acid preparation onto dry
32
nitrocellulose, which was then dried, hybridized with a specific P PP-labeled DNA or RNA probe, and
exposed to X-ray film. Although accurate quantitation was not feasible because of the large and
variable size of the spots, it was possible to obtain an idea of the intensity of specific gene expression
in tissues or cultured cells. Recently, this technique has been improved:
Filtration manifolds have been designed to accept a large number of samples and to deposit the nucleic
acids onto the nitrocellulose in a fixed pattern that allows the results to be quantitated by scanning
densitometry. The filtration manifold consists of a Lucite block containing a number of slots into which
the samples are applied. The manifold fits onto a suction platform containing a sheet of nitrocellulose
onto which the samples are deposited. These manifolds are available commercially
(e.g., Minifold II, Schleicher and Schuell; Fisher Scientific, Springfield, NJ).
Slot Hybridization of RNA
5. Wet a piece of nitrocellulose (0.45-u pore size) in water and soak in 10 x SSC for 10 minutes.
Meanwhile, clean the manifold carefully with 0.1 N NaOH and then rinse it with sterile water.
2. Place two sheets of heavy, absorbent paper, previously wetted with 10 x SSC, on the top of the
vacuum unit of the apparatus. Place the wet nitrocellulose on the bottom of the sample wells
cut into the upper section of the manifold. Smooth away air bubbles trapped between the upper](https://image.slidesharecdn.com/advancedlabtechniquesrevised8-12-2013-160325173547/85/Advanced-Lab-Techniques-in-Avian-Medicine-151-320.jpg)
![156
P
P
7. To maximize the rate of annealing of the probe with its target, hybridizations are usually
carried out in solutions of high ionic strength (6 x SSC or 6 x SSPE) at a temperature
that is 20-25C below the melting temperature (TB
mB). The TB
mB is calculated as follows:
TB
mB = 81.5C – 16.6 (logB
10B[Na+]) + 0.41 (%G+C) – 0.63 (% formamide) – (600/l)
where 1 = length of the molecule in base pairs. Both solutions work equally well when
hybridization is carried out in aqueous solvents. However, when formamide is included
in the hybridization buffer, 6 x SSPE is preferred because of its greater buffering power.
8. The washing conditions should be as stringent as possible (i.e., a combination of
temperature and salt concentration should be chosen that is approximately 12-20C
below the calculated TB
mB of the hybrid under study).
9. To minimize background problems, it is best to hybridize for the shortest possible time
using the minimum amount of probe. Typically, hybridization is carried out for 6-8
hours using 1-2 ng/ml radiolabeled probe (sp. act. = 109
cpm/ g or greater).
Hybridization of Radiolabeled Probes to Nucleic Acids Immobilized on Nitrocellulose Filters
or Nylon Membranes
Although the method given below deals with RNA or DNA immobilized on
nitrocellulose filters, only slight modifications are required to adapt the procedure to nylon
membranes. These modifications are noted at the appropriate places in the text.
5. Prepare the prehybridization solution. Approximately 0.2 ml of prehybridization
solution will be required for each square centimeter of nitrocellulose filter or nylon
membrane. The prehybridization solution should be filtered through a 0.45-micron
disposable cellulose acetate filter (Schleicher and Schuell Uniflow syringe filter No.
57240 or equivalent).
Prehybridization solutions
For detection of low-abundance sequences:
Either
6 x SSC (or 6 x SSPE)
5 x Denhardt’s reagent
0.5% SDS
100 g/ml denatured, fragmented salmon sperm DNA
or
6 x SSC (or 6 x SSPE)
5 x Denhardt’s reagent](https://image.slidesharecdn.com/advancedlabtechniquesrevised8-12-2013-160325173547/85/Advanced-Lab-Techniques-in-Avian-Medicine-156-320.jpg)
![162
P
P
agar gel precipitation assays. Nonetheless, radiolabeled probes have disadvantages that limit their
usefulness; radioisotopes present a safety hazard, are relatively expensive, and have a short shelf-life.
These problems can be overcome by utilizing non-radioactive labeled probes. One source of
non-radioactive label is digoxigenin (DIG), a steroid hapten and a derivative of the cardiac glycoside
drug digilanide C. Digoxigenin is linked by an 11-base spacer arm to the nucleotide deoxyuridine
triphosphate (dUTP). Probes containing digoxigenin-dUTP can be visualized by specific
immunoenzymatic staining using anti-digoxigenin antibodies conjugated to alkaline phosphatase.
Previous research found Digoxigenin-dUTP-labeled probes to be as reliable and sensitive as
radioactive ones.
IBDV viruses are propagated in primary CEFs. Upon development of 50-70% cytopathic
effect, the monolayers are harvested by three rapid freeze-thaw cycle and frozen at -20C until needed.
Virulent IBDV strains which are not cell-culture-adapted are propagated in three-week-old specific-
pathogen-free white leghorns. Each chicken is inoculated intra-nasally and subconjunctivally with 50
l of a virus suspension containing at least 105
chicken infective doses per ml. The birds are housed
in separate modified Horsfall-Bauer isolation units maintained with filtered air under negative
pressure. Three days post-inoculation, the birds are killed and bursae removed. The bursae are
immediately placed in NET buffer (10 mM Tris [pH 8.0], 100 mM NaCl, 1 mM EDTA). Cells are
harvested from intact bursae either by scraping a cut surface of the organ or from a crude suspension
prepared by homogenizing an entire bursa in buffer. The cell suspension is then frozen at -20C until
needed.
RNA extraction. Bursal homogenates or pooled CEFs infected with the IBDV strains are
concentrated by centrifugation at 50,000 x g for 3 hr at 4 C over a 40% sucrose cushion. Pellets are
suspended in NET and Freon-extracted (1,1,2-trichlorotrifluoroethane; Sigma Chemical Co., St. Louis,
Missouri) to release intact virions (12). A second centrifugation at 50,000 x g for 3 hr is performed to
concentrate the virus before extraction of the nucleic acid. The viral RNA is extracted by suspending
the pellet from the second centrifugation in an extraction buffer containing 10 mM Tris (pH 7.5), 10
mM NaCl, 10 mM EDTA, 0.2% sodium dodecyl sulfate (SDS), and 0.1% diethylpyrocarbonate and
incubating for 1 hr at 37 C. Proteinase K (Sigma) is added at a concentration of 1 mg/ml and
incubated for an additional 30 minutes at 37 C. Two consecutive hot phenol:chloroform (1:1)
extractions are performed, and the double-stranded RNA recovered from the aqueous phase by ethanol
precipitation. Further purification of the viral RNA can be determined after examination by agar gel
electrophoresis and spectrophotometric analysis. If needed it can be accomplished by LiCl precipitation
as previously described.
Preparation of digoxigenin-labeled cDNA probe. The cDNA probe is prepared and labeled in
a one-step process using M-MLV reverse transcriptase (Bethesda Research Laboratories, Inc.,
Gaithersburg, MD) and digoxigenin-11-dUTP (Boehringer-Mannheim Biochemicals, Indianapolis,
Ind.). An 18-base oligonucleotide, 5’TGGAGCATAGCCATAGAC-3’, is synthetically synthesized
and used as a specific primer to initiate cDNA synthesis. The sequence is complementary to the
positive strand of the VP-4 region of the viral genome, bases 1821-1839, of an Australian strain of
IBDV.](https://image.slidesharecdn.com/advancedlabtechniquesrevised8-12-2013-160325173547/85/Advanced-Lab-Techniques-in-Avian-Medicine-162-320.jpg)
![163
P
P
Briefly, 1-5 g of purified IBDV RNA and 0.5 g specific primer per g of viral RNA are
mixed together in a microcentrifuge tube, heat-denatured for 10 minutes in a boiling-water bath, and
then rapidly chilled. This is added to a labeling mix containing 200 M each of cytosine
triphosphate, 325 M thymidine triphosphate, and 175 M digoxigenin-11-dUPT. The remainder of
the solution consists of reaction buffer composed of 50 mM Tris-HCl (pH 8.3), 75 mM KCl, 10 mM
dithiothreitol, and 3 mM MgClB
2B. All solutions and reactants are prepared using diethylpyrocarbonate-
treated water. Once all the reactants are combined and mixed, 200 units of M-MLV reverse
transcriptase per ug of RNA are added, and the solution incubated for 2 hr at 37 C. The labeled cDNA
probe can be used for hybridization without further purification; however, purification by centrifugation
through Sephadex G-25 spun columns is advised. (For procedure see section under preparation of
radiolabeled probes).
Dot-blot hybridizations. Twofold dilutions of infected or control cells are prepared in 10 x
SSC (1.5 M NaCl, 0.15 M sodium citrate) using a 96-well plate. The cells are denatured by adding six
parts formaldehyde and four parts 20 x SSC to each well and incubated for 15 minutes at 65C. The
denatured samples—25 l of cell suspension in 100 l total volume—are filtered onto nitrocellulose
(Bio-Rad Laboratories, Richmond, CA) using a vacuum blot apparatus (Fisher Scientific, Springfield,
NJ). After filtration of the samples, the filters are air-dried and vacuum-baked for 2 hr.
The sensitivity of the digoxigenin-labeled cDNA probe is determined by preparing twofold
dilutions of purified IBDV RNA in 10 x SSC. One ml of purified RNA is serially diluted in 10 x SSC
before denaturation.
The membranes are prehybridized for 1 hr at 65 C in a solution containing 5 x SSPE (0.75 M
NaCl, 50 mM NaB
2B HPOB
4B[pH 7.0]. 1 mM EDTA), 5 x Denhardt’s solution (0.1% [wt:vol] Ficoll, 0.1%
[wt:vol] polyvinylpyrrolidone, 0.1% [wt:vol] bovine serum albumin), 0.02% SDS, 0.1% N-
lauroylsarcosine, 50 g/ml denatured salmon sperm DNA, and 0.5% [wt:vol] blocking reagent
(Boehringer Mannheim) using 100 l per cm2
of nitrocellulose. For hybridization, the
prehybridization buffer is removed, and fresh buffer is added with probe at a concentration of 100—
500 ng/ml of buffer. The filters are prehybridized and hybridized in polypropylene bags with mild
agitation. Hybridization is performed overnight at 42 C. Hybridized filters are washed twice in 2 x
SSC/0.1% SDS for 10 minutes at room temperature and twice in l.0 x SSC/0.1% SDS for 15 minutes at
65 C.
Immunological detection. Detection of bound probe is performed according to the method
described by Boehringer Mannheim Corp. for the Genius Nonradioactive DNA Labeling and Detection
Kit®, utilizing an anti-digoxigenin antibody conjugated to alkaline phosphatase (AP) and the
substrates:nitroblue tetrazolium salt (75 mg/ml in 70% dimethylformamide) and 5-bromo-4-chloro-3-](https://image.slidesharecdn.com/advancedlabtechniquesrevised8-12-2013-160325173547/85/Advanced-Lab-Techniques-in-Avian-Medicine-163-320.jpg)
![180
32
P
P
P labeled cDNA Synthesis
(Amersham cDNA Synthesis kit)
I Synthesizing cDNA Probe
1. Prepare RNA-primer*
RNA (0.5 ug)
primer (0.5 ug/ul)
1 ul
1 ul
*primer is a specific 18 to 22 bp synthetic oligonucleotide (single-strand of
DNA) synthesized or a random hexamer primer. The sequence for the specific primer
is taken from the previously published area of the gene in which you want to study. If
the sequence is not known, a random hexamer is chosen which will randomly prime any
gene at various places.
2. Heat 3 min (boiling) to denature. Use Styrofoam float over water bath. Place on ice
when finished.
3. Separate tube on ice, add the following:
5x 1st
strand buffer 10 ul
Na pyrophosphate soln. 2.5 ul
HPRI (Human Placental ribonuclease
from Amersham Lab. Inc.) 2.5 ul
dNTP mix 5 ul
32
[-P
P
P]dCTP(50uCi)
RNA-primer (from #1)
Enzyme* 8 ul
5. Mix gently and spin for a few seconds in a microcentrifuge.
5. Add 20 units of Rtase per ug of mRNA
5. Incubate at 42C for a minimum of 40 min (90 min)
7. Stop reaction by adding 10 ul 250 mM EDTA — quick spin before adding NaOH
25 ul 1N NaOH (hydrolyses RNA)
8. Heat for 30 min at 70C.](https://image.slidesharecdn.com/advancedlabtechniquesrevised8-12-2013-160325173547/85/Advanced-Lab-Techniques-in-Avian-Medicine-180-320.jpg)
![182
32
IV. Gel Electrophoresis
Alkaline gel can be used as a denaturing formaldehyde gel for separating the RNA bands prior
to transfer to a filter.
1. Alkaline gel Buffer
0.3 gm agarose 1.5 ml 10M NaOH
150 ul NaOH 1.2 ml 200 mM EDTA
120 ul EDTA q.s. 300 ml HB
2BO
q.s. to 30 ml
— Run gel at 45 volts 182rthore. 2 hrs
— 5 ul sample 5 ul dye
2. The formaldehyde gel is prepared and run as previously stated and develop the film as
previously stated in prior sections.
3. Figure 2.11 shows P
IBDV.
PP labeled cDNA probe which hybridizes to RNA segments of
In situ assay. cDNA probes are labeled with digoxigenen using the Genius Kit (Boehringer Mannheim
Corp., Indianapolis, Ind.) according to the same procedures in the section for the detection of IBDV
RNA using Dot Blot and a Nonradioactive Probe. The concentration of labeled probe is an
approximately 0.3 ng/ul. A 30 ul volume containing 9.0 ng of probe is placed on each slide for
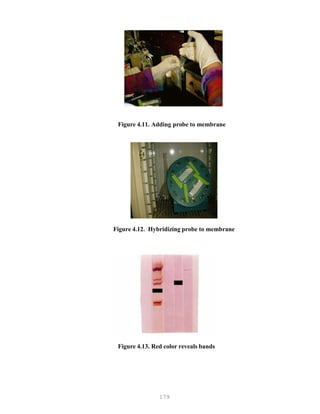
hybridization (Figure 4.13).
Hybridization. Tissue samples are prehybridized and hybridized in a buffer containing 2 x
SSC, 50% formamide, 1 x Denhardt’s solution (0.02% [wt:vol] ficoll, 0.02% [wt:vol]
polyvinylpyrrolidone, 0.2% [wt:vol] bovine serum albumin), 500 g/ml salmon sperm DNA, 250
g/ml yeast tRNA, and 10% dextran sulfate. A 300-ul volume of prehybridization buffer is added to
each slide, which was then covered with a Paraffin (American National Can, Greenwich, Conn.) cover
slip. Prehybridization is conducted at room temperature for 1 hr in a humid chamber. Following
prehybridization, the slides are rinsed in 2 x SSC, and a 30- l volume of hybridization buffer
containing 9.0 ng of digoxigenin-labeled probe is added to each slide. The slides are covered with
Parafilm coverslips and incubated in a humid chamber at 42 C for 16 hr.
Following hybridization, samples are washed sequentially in 2 x SSC for 1 hr at room
temperature, 1 x SSC for 1 hr at room temperature, 0.5 x SSC for 30 minutes at 37 C, and 0.5 x SSC
for 30 minutes at room temperature. The digoxigenin-labeled probes are then detected using the](https://image.slidesharecdn.com/advancedlabtechniquesrevised8-12-2013-160325173547/85/Advanced-Lab-Techniques-in-Avian-Medicine-182-320.jpg)
![184
The slides containing tissue sections are heated at 56 C; and paraffin is removed from tissues
by means of two 5 minute incubations in xylene. The tissues are hydrated through graded
concentrations of ethanol followed by a final wash in phosphate-buffered saline (PBS [pH 7.4]).
Proteinase-K pretreatment. Tissues sections are incubated in 0.2 N HCl for 20 minutes, rinsed
in deionized water, and placed in 2 x SSC (1 x SSC = 0.15 M NaCl, 0.015 M sodium citrate [pH 7.4])
for 30 minutes at 70 C. The tissue sections are rinsed in deionized water and placed in a solution
containing 10 mM Tris (pH 7.4), 2 mM CaClB
2B, and 1 ug/ml proteinase K for 15 minutes at 37 C.
Samples are rinsed twice in deionized water and then dehydrated through graded concentrations of
ethanol.
Tissue Printing. Tissue printing is a simplified form of in situ hybridization. This procedure
employs imprinting tissues of infected birds directly onto nitrocellulose and then fixing and
hybridizing the imprinted viral nucleic acid with a labeled probe. This technique is more rapid than
other previously named dot blot procedures which employ isolation of viral nucleic acid from tissues
or fixing and processing of embedded tissue sections on microscope slides as described with the
standard in situ technique. The disadvantage of this procedure is that it can not quantitate the nucleic
acid as with the dot blot procedure and it does not yield the histologic detail of the tissue as with in situ
hybridization using fixed, embedded and sectioned tissue sections. Also, background staining is
considerably more a problem with tissue printing when compared to in situ work with tissue sections
on microscopic slides.
Tissue Print Hybridization
I Blot – fresh or frozen tissues may be used.
5. Thaw out bursae at room temperature.
2. Blot on to nitrocellulose that has been soaked in 20 x SSC and air dried.
3. Place in UV cross linker (Fisher Scientific) and run at optimum factory setting (120
millijoules per unit area).
5. Alkaline denature by soaking in a glass petri dish containing 0.1M NaOH in 1M NaCl
for 15 minutes (2X).
5. Neutralize in 0.1M Tris-HCl, pH 7.4, in 1M NaCl for 15 minutes (2X).
5. Treat blots with proteinase K (20ug/ml) in 1% SDS in 2 X SSC for 30 minutes at room
temperature.](https://image.slidesharecdn.com/advancedlabtechniquesrevised8-12-2013-160325173547/85/Advanced-Lab-Techniques-in-Avian-Medicine-184-320.jpg)
![191
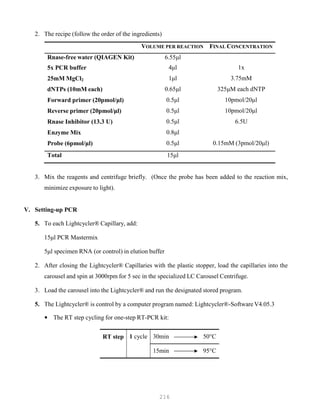
2. Label new tubes (MicroAmp® tubes) with corresponding samples. Dispense 40 ul of master
mix into each tube.
3. Collect 10 ul of RT product (be careful- do not take the oil) then add to corresponding
MicroAmp tube.
4. Spin for 15 sec to mix well.
5. Load unto GeneAmp® PCR machine. Run PCR using program: 950
C 5 min (initial
denaturation); 30 cycles [950
C 1 min, 550
C 1 min, 720
C 1 min]; 720
C 7 min (final extension)
and hold @ 40
C.
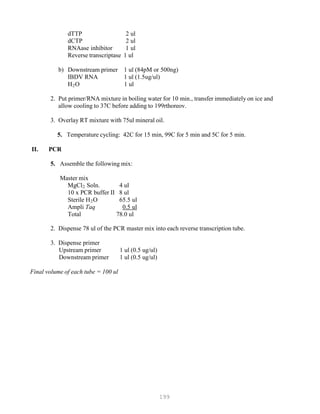
IV. Nested PCR
1. Assemble master mix:
MgCl2 4 ul
10X PCR buffer 5 ul
dATP 1 ul
dTTP 1 ul
dCTP 1 ul
dGTP 1 ul
Primer P3 0.5 ul (50 pmol/ul)
Primer P4 0.5 ul (50 umol/ul)
DEPC water 33 ul
Taq Polymerase 0.5 ul
2. Label new MicroAmp® tubes with corresponding samples. Dispense 47.5 ul master mix into
each tube. Add 2.5ul of RT –PCR product to corresponding MicroAmp® tube.
3. Spin for 15 sec to mix.
4. Load unto GeneAmp® PCR machine, then run using the same program as the 1
st
PCR
amplification.
AGAROSE GEL ELECTROPHORESIS
5. Prepare running buffer – 1 X TBE
300 ml – small gel
2 liters – big gel
2. Tape the sides of the chamber, set the comb in place](https://image.slidesharecdn.com/advancedlabtechniquesrevised8-12-2013-160325173547/85/Advanced-Lab-Techniques-in-Avian-Medicine-191-320.jpg)
![200
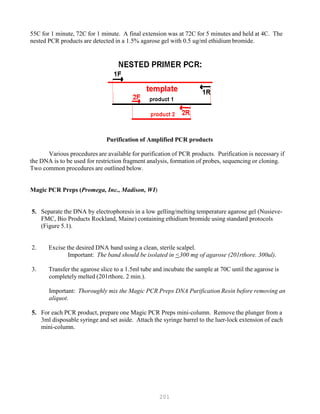
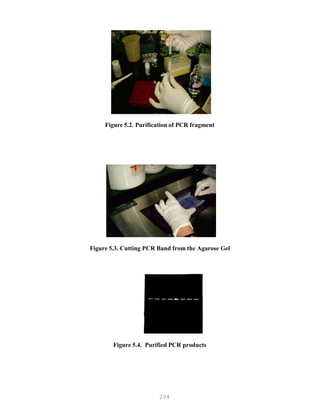
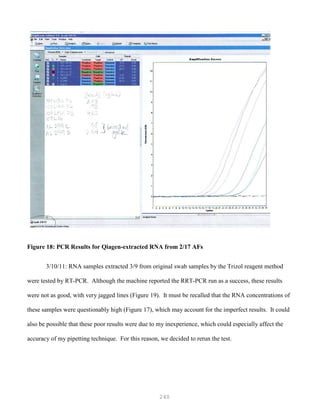
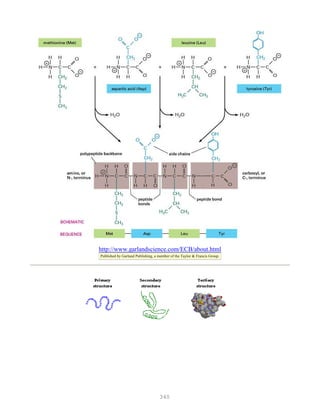
Figure 5.1. RT-PCR/RFLP of Unknown (left) and IBDV vaccines viruses (right)
5. Spin the tubes for 30 sec.
5. Temperature: 2 min at 95C, [1 min at 95C & 1 min at 60C, 30 cycles], 7 min at 60C, store at
4C.
Nested PCR.
The nested PCR procedure is sometimes needed to further amplify a nucleic acid fragment or as a
method to prove that the fragment amplified was indeed the fragment that was desired. In this
procedure the piece of RNA is first reverse transcribed (RT) to cDNA and then amplified as previously
described. This first PCR product is then re-amplified using a second set of internal primers (located
internal on the gene to the position of the first set of primers). This will result in the production of a
second fragment with a smaller size than the first. This smaller sized fragment should be the exact
length of the number of nucleic acid bases that are found between the second set of primers. If this
second PCR product has the exact predicted size, then it must be the intended fragment that you desire.
Nested PCR protocol for IBDV RNA.
The RTPCR protocol is as previously described. In the second PCR, the sequence of the internal
primers is as follows: P3 (5-GCCCAGAGTCTACACCATAACTGC-3) complementary to positions
654 to 677) and P4 (5-GCGACCGTAACGACAGATCC-3)(complementary to positions 1125 to
1144). Sequence numbering follows that of Kibenge from the standard APHIS virus.
The 100 ul reaction mixture contained 10 ul of 10X PCR buffer II, 2 ul each of 10mM dNTP (dGTP,
dATP, dTTP, dCTP), 1ul each of primer 3 and primer 4, 5ul of RTPCR products, 1ul of Ampli Taq, and
66 ul of ddH2O. The reaction was carried out at 95C for 5 minutes, 30 cycles at 95C for 1 minute,](https://image.slidesharecdn.com/advancedlabtechniquesrevised8-12-2013-160325173547/85/Advanced-Lab-Techniques-in-Avian-Medicine-200-320.jpg)
![327
3. Put primer/template mixture in boiling water for 5 min, transfer immediately on ice and allow
cooling to 37C before adding to master mix.
4. Amplification: 2 min at 95C, [30 sec at 95C, 30 sec at 60C and 1 min at 72C, 30 cycles], 4C.
Note: 1) Final volume of each tube = 100 ul
2) 2nd Asymmetric PCR may be done using the above protocol, but using 50:1 pmol
primer ratio in order to produce single-stranded DNA.
5. The asymmetric PCR product is now ready for sequencing.
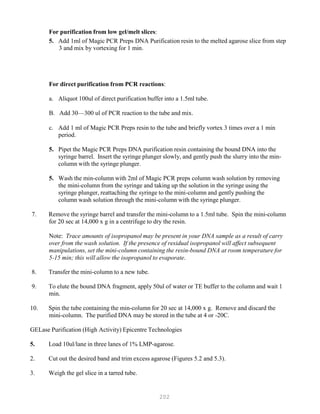
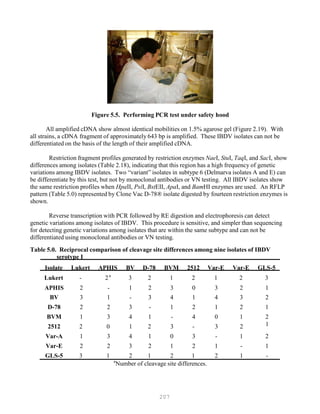
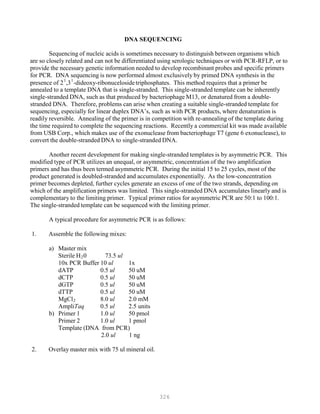
Overview of DNA Sequencing Methods
DNA sequencing techniques are based on electrophoretic procedures using high-resolution
denaturing polyacrylamide (sequencing) gels, which are capable of resolving single-stranded
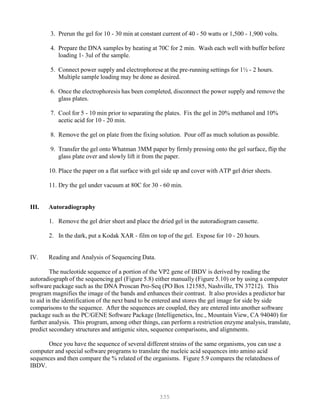
oligonucleotides up to 500 bases in length that differ by a single deoxynucleotide (Figures 5.6 and 5.7).
The practical limit on the amount of information that can be obtained from a set of sequencing
reactions is the resolution of the sequencing gel. Current technology allows 500 nucleotides of
sequence information to be reliably obtained in one set of reactions.
Figure 5.6. DNA sequencing](https://image.slidesharecdn.com/advancedlabtechniquesrevised8-12-2013-160325173547/85/Advanced-Lab-Techniques-in-Avian-Medicine-327-320.jpg)
![329
The labeling/termination method is capable of yielding longer sequencing products, on average,
than those obtained using the original Sanger protocol. Therefore, the labeling/termination method is
advantageous for obtaining the maximum amount of sequence information per template. For applications
where large amounts of sequence information are not needed (such as verifying constructions or
sequencing small regions of DNA), the Sanger procedure is usually adequate. The anger procedure may
be more reliable for obtaining the first few nucleotides of sequence information after the primer.
Dideoxy sequencing requires a single-stranded template to which the primer can anneal. Single-
stranded templates can be easily generated using specialized vectors derived from M13. Dideoxy
sequencing can also be readily carried out using double-stranded DNA if it is first denatured with alkali
or heat. The product of the polymerase chain reaction (PCR) can also be sequenced by the dideoxy
method which we will describe herein.
Radiolabeling of Dideoxy Sequencing Reactions
The dideoxy sequencing protocols involve radiolabeling the nascent DNA chains with 35SdATP
rather than with [32P]dATP since the low-energy emissions of a 35S result in sharper autoradiographic
bands compared to those generated by 32P, allowing more sequence to be read from the upper portion of
the gel. The lower-energy emissions of 35S also cause fewer breaks in the sugar-phosphate backbone of
the DNA, allowing 35S-reaction products to be stored at -20C for several weeks without significant
degradation; 32P0reaction products should be electrophoresed within a day. In addition, users receive a
lower dose with 35S than with 32P.
However, 32 P offers the advantage of short exposure times and is particularly useful in
situations, such as verifying plasmid constructions, where maximizing resolution in the higher region of
the sequencing gel is not a priority. Recently, the use of a new labeled nucleotide analog [33P]dATP in
sequencing reactions has been described. 32P has a maximum 0-emmision energy that is 50% stronger
than 35S, but fivefold weaker than 32P. Sequences generates using 33PdATP have short exposure times
like 32P, but have band resolution comparable to 35S.
5’end labeling: An alternative to labeling the nascent oligonucleotide with 35SdATP is to use a
5’-end-labeled primer generated by T4 polynucleotide kinase and 33PATP of 35SATP](https://image.slidesharecdn.com/advancedlabtechniquesrevised8-12-2013-160325173547/85/Advanced-Lab-Techniques-in-Avian-Medicine-329-320.jpg)
![330
Cycle Sequencing
Sequencing has only become practical for diagnostic purposes with the introduction of the PCR
for amplifying the gene, automated techniques for performing the sequencing reaction (e.g. cycle
sequencing), and computer programs to increase the accuracy and speed of the sequences analysis.
Commercial kits eliminate the need to assemble numerous mixes and can save a significant amount of
startup time, although they are somewhat less flexible and can limit the ability to troubleshoot reactions.
Two procedures from commercial kits made by Promega, Co (Madison, WI) and Epicentre
Technologies (Madison, WI) are being outlined here. They both utilize the newly emerging thermal
cycle sequencing technology. This procedure does not require single-stranded DNA templates, so
DNAs such as cosmids, PCR products and double stranded plasmids can be directly sequenced without
sub-cloning into M13 or phagemid vectors.
Unlike conventional sequencing protocols, cycle sequencing utilizes a thermostable DNApolymerase and
multiple rounds of high-temperature DNA synthesis. A small number of template DNA molecules are
repetitively utilized to generate a sequencing ladder from each template/primer combination. Each
reaction contains a base-specific, chain-terminating dideoxynucleotide (i.e., ddATP, ddCTP, ddGTP, or
ddTTP) as well as a primer that is end-labeled with P or P can be incorporated in to the growing chains,
the dideoxy sequencing reaction mixture is subjected to repeated rounds of denaturation annealing and
synthesis steps in a thermal cycling machine, similar to PCR. The resulting radiolabeled DNA prodcuts
are then loaded in adjacent lanes of a polyacrylamide/urea gel. After electrophoresis, the gel is exposed
to x-ray film, creating an image of four “ladders” of DNA molecules ending in G, A, T or C from which
the DNA sequence can be determined.
Sequencing Reaction using fmol DNA Sequencing Kit from Promega, Co.
I. Primer Radiolabeling Reaction
1. Combine the following in a tube:
Primer 1 ul 10 pmol
[PP]ATP 5 ul 10 pmol
P. kinase buffer 1 ul
P. kinase 1 ul 5 units
Sterile HB
2BO 2 ul
2. Incubate at 37C for 30 min and then inactivate the kinase at 90C for 2 min.
3. Briefly spin in a microcentrifuge to collect any condensation. The end-labeled primers may
be stored at -20C for as long as a month.
II. Extension/Termination Reactions
1. Label four 0.5ml tubes (G, A, T, C). Add 2ul of the appropriate d/ddNTP Mix to each tube.
Cap the tubes and store on ice or at 4C until needed.
2. Mix the following in a tube:](https://image.slidesharecdn.com/advancedlabtechniquesrevised8-12-2013-160325173547/85/Advanced-Lab-Techniques-in-Avian-Medicine-330-320.jpg)
![331
P
P
32
32
Template DNA 2 ul * 4 - 40 fmol
Seq. 5x buffer 5 ul
Labeled primer 1.5 ul 1.5 pmol
Sterile HB
2BO 7.5 ul
3. Add 1.0 ul of Taq Polymerase (5 u/ ul) to the primer/template mix. Mix briefly by pipetting
up and down.
4. Add 4 ul of the enzyme/primer/template mix from step II.3 to the inside wall of each tube
containing d/ddNTP Mix.
5. Add one drop of mineral oil to each tube and spin briefly.
6. Place the reaction tubes in a thermal cycler programmed as follows: 2 min at 95C, [30 sec
at 95C, 30 sec at 60C and 1 min at 72C, 30 cycles], 4C.
7. After the thermocycling program has been completed, add 3ul of Stop solution to the inside
wall of each tube. Spin briefly.
8. Heat the reactions at 70C for 2 min immediately before loading on a sequencing gel.
Sequencing using Sequitherm Cycle Sequencing Kit
from Epicentre Technologies
A new kit from Epicentre Technologies (1202 Ann Street, Madison, WI 53713) has been developed for
direct sequencing of double stranded PCR amplified DNA. The starting material is double stranded RNA
of infectious Bursal Disease Virus isolated from chickens. cDNA is made and amplified using the Gene
Amp RNA PCR®Kit from Perkin Elmer Cetus as previously described. The amplified cDNA is purified
using three different purification procedures such as Magic PCR Prep® procedure from Promega, Inc.,
Ultra free- MC 30,000 NMWL filter units (Millipore Corp., Bedford, MA) and Gelase Agaraose Gel-
Digesting Preparation (Epicenter Technologies, Madison, WI) as described previously. The purified
cDNA is then used as a template for the sequencing reactions as described below.
I. Primer radiolabelling reaction
1. Thaw the following reagents on ice and combine the stated amounts in a 0.5-ml
microcentrifuge tube.
Gama P
P— 0.5 ul (y-PPP) ATP (80 Ci; 12 pmol).
— 12 pmol primer (e.g., 1 l of the M 13 24-mer Forward Primer supplied with the
kit at 12.6 pmol/ l.)
— 1 l (1 unit) of T4 polynucleotide kinase (PNK).
— deionized HB
2BO to a final volume of 25 l.
Gama P
P
-- 3 ul (yPPP) ATP (3O ul; 30 pmole)-- 30 pmole primer
-- 1.5 ul 10XPNK buffer](https://image.slidesharecdn.com/advancedlabtechniquesrevised8-12-2013-160325173547/85/Advanced-Lab-Techniques-in-Avian-Medicine-331-320.jpg)

![388
Hybridization: The formation of hydrogen bonds between two nucleic acid molecules that
demonstrate some degree of complementarity. The specificity of hybridization is a direct function
of the stringency of the system in which the hybridization is being conducted.
Hydrogen bonding (see also Base-pairing): The highly directional attraction of an electropositive
hydrogen atom to an electronegative atom such as oxygen or nitrogen.
Hyperpolymer: A collection of labeled probe molecules that have hybridized to a target sequence and
with each other, in an overlapping fashion, such that a tail of labeled molecules is attached to the
target sequence. This phenomenon occurs when breakage of a nucleic acid occurs during labeling,
as in nick translation, or as a result of failure to seal the backbone during probe synthesis, as in
random priming. The effect is an amplification of the signal, which translates into shorter
autoradiographic exposure time. Because of this hyperpolymerization, a slight loss in resolution is
observed.
Ionizing radiation: Any radiation that displaces electrons from atoms or molecules, resulting in the
formation of ions; α, ß, and γ radiation are all forms of ionizing radiation.
Isotope: One of two or more atoms with the same atomic number but different atomic weights.
Library: A collection of clones that partially or completely represent the complexity of genomic DNA
or cDNA from a defined biological source, one or several members of which are of immediate
interest to the investigator. Members of the library, which consist of cDNA or genomic DNA
sequences ligated into a suitable vector, may be selected or retrieved from it by nucleic acid
hybridization or antibody recognition (in the case of expression vectors).
Methylmercuric hydroxide (Methyl mercury): An extremely toxic reagent used to denature RNA
before electrophoresis or other chromatographic application. Methylmercuric hydroxide should be
avoided in favor of other denaturation options whenever possible.
MOPS: (3-[N-morpholino]propanesulfonic acid): A key component of the buffering system used in
conjunction with formaldehyde/agarose gel electrophoresis of RNA.
Northern blot analysis: A technique for transferring electrophoretically chromat-orgraphed RNA from a
gel matrix, usually agarose, onto a filter paper, for subsequent immobilization and hybridization. The
information gained from Northern blot analysis is used to qualitatively and quantitatively assess the
expression of specific genes.
Oligonucleotide: A short, artificially synthesized, single-stranded DNA molecule that can function as
a nucleic acid probe or a molecular primer.
Phosphate buffered saline (PBS): An isotonic salt solution frequently used to wash residual growth
medium from a cell monolayer. 10X PBS (per liter) = 40 g NaCl, 1g KCl, 5.75g NaB
2BHPOB
4B, 1g
KHB
2BPOB
4B.
Photon: A particle that has no mass but is able to transfer electromagnetic energy.
Post-transcriptional regulation: Any event that occurs after transcription and influences any of the
subsequent steps involved in the ultimate expression of a gene. Reference to posttranscriptional](https://image.slidesharecdn.com/advancedlabtechniquesrevised8-12-2013-160325173547/85/Advanced-Lab-Techniques-in-Avian-Medicine-388-320.jpg)

This document provides an introduction and table of contents for a book on advanced laboratory techniques in avian medicine. The introduction gives an overview of traditional diagnostic methods and emerging molecular biological techniques. The table of contents outlines two main sections - traditional diagnostic methods, and molecular biological techniques - covering topics like isolation and identification of microorganisms, serological procedures, and nucleic acid and protein methods.


