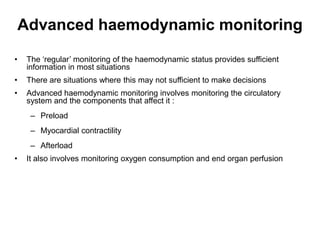
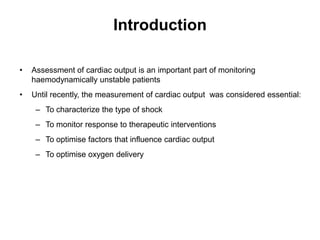
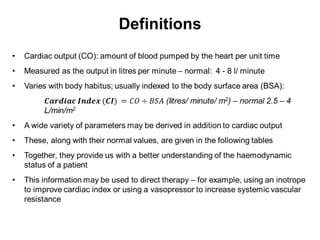
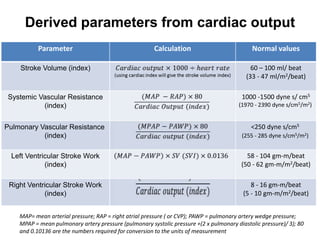
Advanced haemodynamic monitoring involves closely monitoring parameters of the circulatory system such as preload, contractility, and afterload. This summary provides an overview of some key aspects of advanced haemodynamic monitoring discussed in the document:
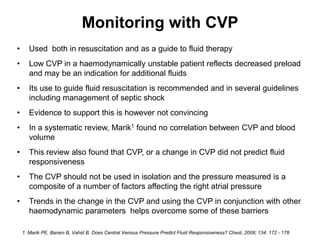
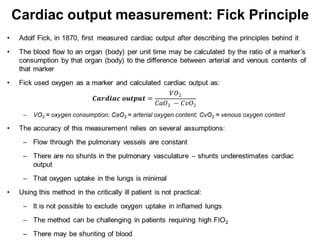
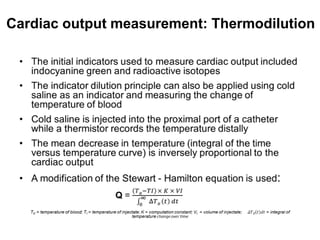
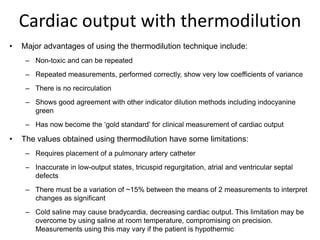
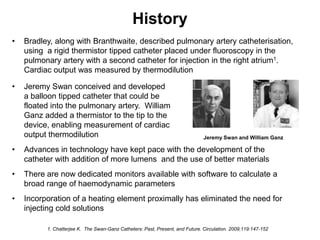
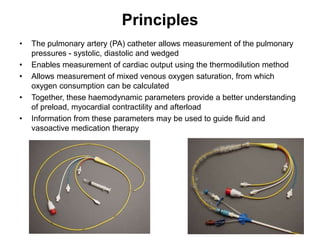
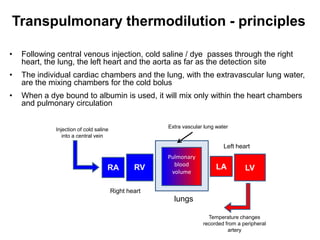
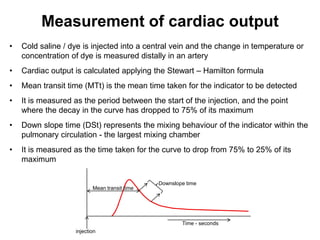
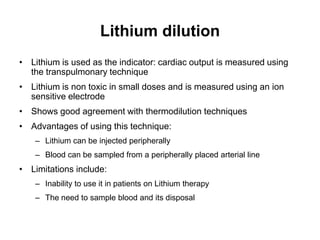
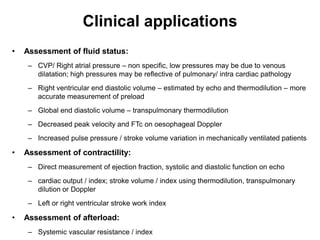
Central venous pressure (CVP) monitoring is commonly used but CVP is an indirect measure influenced by many factors and does not always accurately reflect cardiac preload. Cardiac output can be measured using techniques such as thermodilution which involves injecting cold saline through a pulmonary artery catheter. Pulmonary artery catheters allow measurement of pulmonary pressures and cardiac output but require an invasive procedure and have some limitations. Advanced monitoring provides more detailed information than basic monitoring but also has greater risks and limitations
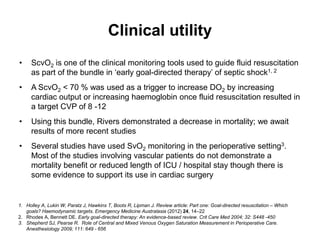
This document discusses static and dynamic indices used for hemodynamic monitoring. Static indices like CVP and PAOP are poor predictors of fluid responsiveness. Only about 50% of critically ill patients are fluid responsive. Dynamic indices that measure the response of cardiac output to fluid challenges or changes in preload are better predictors. The passive leg raise test is a non-invasive dynamic index that can reliably assess fluid responsiveness. Dynamic monitoring allows for goal-directed fluid therapy to optimize cardiac preload while avoiding over-resuscitation.
The document discusses the FloTrac system, which uses an existing arterial line to continuously monitor cardiac output (CO) and other hemodynamic values through advanced arterial waveform analysis. While the trends provided by FloTrac can be useful for estimating hemodynamic status, its specific CO and cardiac index values may not correlate exactly with pulmonary artery catheter measurements. FloTrac requires good arterial signal quality and its values could be affected by factors like arrhythmias, hemodynamic instability, or ventilator settings like PEEP. Clinical judgment is still needed to interpret the data from FloTrac.
Cardiac output can be measured through various invasive and non-invasive methods. The pulmonary artery catheter using thermodilution is still considered the gold standard but is invasive. Minimally invasive methods include lithium dilution, pulse contour analysis devices, esophageal Doppler, and transesophageal echocardiography. Non-invasive methods include partial gas rebreathing, thoracic bioimpedance, and Doppler ultrasound. The ideal monitor is accurate, continuous, non-invasive and provides reliable measurements during different physiological states.
The document discusses several newer modes of mechanical ventilation including volume assured pressure support (VAPS), volume support (VS), pressure regulated volume control (PRVC), and adaptive support ventilation (ASV). VAPS switches between pressure control and volume control modes within a breath to ensure a minimum tidal volume. VS adjusts pressure support levels between breaths to maintain a target tidal volume. PRVC aims to deliver a set tidal volume with the lowest possible airway pressure by modifying flow and time. ASV automatically adapts support levels to provide a minimum minute ventilation with the least work of breathing.
This document discusses several advanced modes of mechanical ventilation. It begins by describing triggered modes like volume support (VS) and proportional assist ventilation (PAV) which provide pressure support that varies based on patient effort. It then covers hybrid modes like volume-assured pressure support and pressure regulated volume control (PRVC) which use dual controls. Newer dual-controlled modes are presented that regulate pressure and volume both within and between breaths. Modes like adaptive support ventilation (ASV) automatically adapt settings to patient changes. Pros, cons and indications are provided for some of the more complex modes.
Cardiac output monitoring provides important information about a patient's hemodynamic status. There are several invasive and non-invasive methods to measure cardiac output. Invasive methods include thermodilution, Fick method, lithium dilution. Thermodilution, using a pulmonary artery catheter, is considered the clinical gold standard but has fallen out of favor due to risks. Non-invasive options include esophageal Doppler, bioreactance, pulse contour analysis, and partial CO2 rebreathing. Choice of monitoring method depends on the patient's condition and goals of therapy.
Fluid responsiveness in critically ill patientsUbaidur Rahaman
This document discusses fluid responsiveness in critically ill patients. It begins by defining fluid responsiveness as an increase in cardiac index after fluid infusion. It then describes three scenarios involving fluid resuscitation: patients with acute blood or fluid loss requiring immediate resuscitation, patients with suspected septic shock where early goal-directed therapy with fluids is important, and ICU patients who have already received fluids and their fluid responsiveness needs to be assessed. The document discusses various methods of assessing preload and preload dependence, including filling pressures, volumes, respiratory variations in inferior vena cava diameter, inspiratory drops in right atrial pressure, and predicting responsiveness through respiratory variations in parameters related to cardiac index. It emphasizes that preload alone
Assessment of haemodynamics a critically ill patient and its management has always been a matter if debate. Over time a lot of studies and therapeutic interventions have been carried out. This presentation is a review of such interventions and their impact on the outcome.
This document summarizes different methods for measuring cardiac output, including clinical assessment, minimally invasive techniques, and invasive pulmonary artery catheterization. Clinical assessment involves evaluating end organ perfusion rather than direct cardiac output measurements. Minimally invasive techniques discussed include thoracic bioimpedance and esophageal Doppler. Invasive pulmonary artery catheterization provides direct cardiac output measurements via thermodilution but carries risks of complications. The document evaluates the advantages, limitations, and evidence for various cardiac output monitoring methods.
Ventilatory management in obstructive airway diseasesVitrag Shah
Presentation on ventilatory management in COPD & Asthma
Updated information till 26/5/16
For powerpoint format, contact dr.vitrag@gmail.com
http://www.medicalgeek.com/presentation/36441-ventilatory-management-obstructive-airway-diseases-presentation.html
This document discusses cardiac output and methods for monitoring it. It begins by defining cardiac output and factors that influence it, such as stroke volume, preload, afterload, and contractility. Both invasive and minimally invasive methods for monitoring cardiac output are described, including pulmonary artery catheters and techniques such as thermodilution that use temperature sensors. The principles behind various monitors that can measure cardiac output and its determinants using methods such as Fick's principle and thermodilution are explained. The document also discusses using echocardiography to monitor cardiac output and principles guiding fluid therapy.
Recruitment Maneuvers in ARDS Dr Chennamchetty Vijay KumarVizae Kumar Chennam
This document discusses recruitment maneuvers for mechanically ventilated patients. It begins with a case study of a patient presenting with respiratory failure. It then provides definitions and the physiological rationale for recruitment maneuvers, including how alveolar collapse occurs in ARDS. Different types of recruitment maneuvers are described, as well as factors that influence their effectiveness. Clinical trials on recruitment maneuvers are summarized, which found no significant reduction in mortality but some improvement in secondary outcomes. Limitations of recruitment maneuvers are discussed, such as potential hemodynamic effects. The document concludes with emphasizing the complexity of lung recruitment and ongoing controversies regarding recruitment maneuvers.
This document discusses respiratory function and its importance to anesthesia. It covers topics like cellular respiration, aerobic vs anaerobic respiration, muscles of respiration, mechanisms of ventilation, lung volumes, compliance, and factors that affect respiration. The speaker is Dr. Tipu and the event is being coordinated by Dr. Shivali Pandey.
1) Recruitment maneuvers (RMs) aim to reopen collapsed alveoli in ARDS patients through temporarily increasing transpulmonary pressure. Common types include sighs, sustained inflations, and stepwise increases in pressure.
2) While RMs often improve short-term oxygenation, clinical trials have found no evidence of reduced mortality or improved outcomes. One large trial found RMs may actually increase mortality.
3) Not all ARDS patients respond equally to RMs due to factors like etiology, severity, and lung recruitability. RMs should only be considered for hypoxemic individuals based on an individual risk-benefit assessment.
Fluid administration is commonly used to resuscitate ICU patients, but determining which patients will respond to fluids, known as fluid responsiveness, remains challenging. Static parameters like CVP are poor predictors of fluid responsiveness. Dynamic parameters that measure beat-to-beat variations related to mechanical ventilation, such as PPV, SVV, IVC collapsibility, and changes in aortic blood flow with PLR have been shown to more accurately predict fluid responsiveness with sensitivities and specificities often over 90%. However, factors like arrhythmias, spontaneous breathing, and suboptimal ventilator settings can limit the reliability of dynamic parameters in some clinical situations.
Lung protective strategies in anaesthesiadrsoliman
This document discusses ventilator-induced lung injury during general anesthesia. It notes that mechanical ventilation can damage the lungs through overinflation, repetitive opening and closing of alveoli, and other mechanisms. This can lead to lung inflammation and injury referred to as ventilator-induced lung injury (VILI). The document recommends protective ventilatory strategies with low tidal volumes, moderate pressures, and positive end-expiratory pressure to prevent VILI during surgery and anesthesia. It also discusses atelectasis and aspiration as risks during anesthesia and their prevention.
Tissue oxygenation involves the cascade of oxygen from the atmosphere to the mitochondria in cells. Oxygen partial pressure progressively decreases from 150 mmHg in inspired air to 10-20 mmHg in cell mitochondria. Factors like ventilation, cardiac output, hemoglobin levels, and oxygen consumption can impact oxygen levels at different points in the cascade. Clinicians assess tissue oxygenation using variables derived from oxygen delivery and uptake, such as oxygen saturation, lactate levels, and base deficit. Monitoring these factors provides insight into a patient's oxygenation status.
The document discusses the anesthetic management of patients undergoing treatment for cerebral aneurysms, including definitions, epidemiology, presentation, diagnosis, management of vasospasm, intracranial pressure, pre-operative assessment and testing, and radiological procedures such as coiling of aneurysms. Precise management of hemodynamics, fluid balance, and respiratory status is important due to the risks of re-bleeding, cerebral ischemia, and impaired autoregulation in these patients.
The document discusses basic principles of mechanical ventilation including factors that can lead to ventilatory failure, airway resistance, lung compliance, hypoventilation, V/Q mismatch, intrapulmonary shunting, and diffusion defects. It also covers different types of ventilator waveforms including pressure, volume, flow and pressure/volume loops which can be used to assess a patient's respiratory status and response to therapy.
Advanced modes of Mechanical Ventilation-Do we need them?chandra talur
The document discusses advanced modes of mechanical ventilation. It begins by outlining newer modes such as VAPS, APRV/BIPAP, PAV+, Smartcare, and their benefits over basic modes. These advanced modes aim to improve synchrony between the patient and ventilator, reduce asynchrony issues, and make ventilation proportional to patient effort through feedback loops. The document argues that automated closed-loop ventilation is the future as it reduces workload and errors while allowing for quicker weaning and lower costs through greater ease of use and patient safety.
This document discusses fluid responsiveness and methods for assessing preload responsiveness. It summarizes that dynamic indices of preload responsiveness like pulse pressure variation (PPV) and stroke volume variation (SVV) can help identify patients who will respond to fluid by increasing their stroke volume. However, these indices have limitations and may not be reliable in patients with spontaneous breathing, arrhythmias, low tidal volumes, low lung compliance, high frequency ventilation, open chest conditions, or severe right ventricular failure. In these situations where the indices cannot be interpreted reliably, other dynamic tests are needed to assess fluid responsiveness.
Hemodynamic monitoring has advanced with new equipment allowing continuous, non-invasive monitoring of key parameters. Pulse contour analysis uses an arterial catheter to provide beat-to-beat measurements used to calculate stroke volume, cardiac output, and contractility. Thermodilution techniques inject cold saline to measure parameters like intrathoracic blood volume, extravascular lung water, and ejection fraction. Echocardiography non-invasively assesses cardiac structure and function. These advances allow early detection and guided therapy for shock.
Flotrac is a monitoring platform that displays both intermittent and continuous hemodynamic measurements related to the assessment of the essential components of oxygen delivery as well as the balance of oxygen delivery against consumption
The document discusses pulmonary artery catheter monitoring and measurements. It provides details on:
- The history and uses of pulmonary artery catheters
- Physiological measurements that can be obtained from pulmonary artery catheters including pressures, oxygen saturations, and derived variables
- Placement technique for pulmonary artery catheters and ensuring accurate measurements
- Interpretation of catheter waveforms and pressures from different locations within the heart and how they are affected in different disease states
1) The patient presented with severe ARDS due to bilateral pneumonia and septic cardiomyopathy. She required intubation and mechanical ventilation with hypoxemia.
2) She was treated with prone ventilation for 20 hours which improved her oxygenation with PaO2/FiO2 ratio increasing from 96 to 207.
3) Prone positioning has physiological benefits for ARDS including improving ventilation distribution and oxygenation, reducing ventilator-induced lung injury, and facilitates secretion clearance. It has been shown to reduce mortality in patients with severe ARDS.
Mechanical ventilation graphics provide important information to interpret patient response, disease status, and ventilator function. Scalars plot pressure, volume, or flow over time, while loops plot pressure versus volume or flow versus volume with no time component. Common waveforms include square, ramp, and sine waves. Pressure modes result in square pressure waves while volume modes produce ramp waves. Loops can indicate breath type and assess issues like air trapping, resistance, compliance, and asynchrony. Graphical analysis is a critical tool for ventilator management and optimization.
The main components of an intra-arterial blood pressure measuring system are:
1. Biological variable (arterial blood pressure)
2. Sensor (pressure transducer)
3. Integrator (computer for calibration and processing the signal)
4. Output (display of pressure waveform and numeric values)
This document discusses cardiac output and the factors that regulate it. Cardiac output is the amount of blood pumped by the heart each minute and is determined by heart rate and stroke volume. Stroke volume is influenced by three main factors: preload, contractility, and afterload. Preload refers to the stretching of the heart before contraction and is represented by end-diastolic volume; increased preload results in increased stroke volume according to the Frank-Starling law. Contractility is the strength of ventricular contraction independent of preload; increased contractility also increases stroke volume. Afterload is the resistance against which the heart must pump during contraction; increased afterload decreases stroke volume. The relationship between cardiac output and these factors can
This presentation gives you a brief, understandable, captivating and presentable idea on the physiology of blood pressure regulation both on hypertension and hypotension cases.
Blood pressure and Its Applied Physiology In Dentistry (Prosthodontics)Self employed
This document discusses blood pressure, including an overview, variations, determinants, regulation, and measurement. It defines systolic and diastolic blood pressure and other related terms. The key factors that determine and regulate blood pressure are described, including cardiac output, peripheral resistance, blood volume, hormones, the nervous system, kidneys, and local mechanisms. Methods for measuring blood pressure are outlined, including palpatory, auscultatory, and oscillometric techniques. Special considerations for taking blood pressure in certain populations are also noted.
Here are the steps to measure blood pressure using different types of sphygmomanometers:
1. Aeroid (mercurial and non-mercurial) sphygmomanometer:
- Attach the cuff to the upper arm and pump the bulb until the column of mercury rises to 200 mmHg.
- Slowly release the pressure and listen over the brachial artery with a stethoscope. Note the first appearance and disappearance of Korotkoff sounds.
2. Anaeroid (automatic) sphygmomanometer:
- Turn on the device and make sure it is functioning properly. Select the appropriate cuff size.
- Apply the cuff to the upper arm and press start. The c
This document discusses hemodynamic monitoring, which involves measuring the pressure, flow, and oxygenation of blood within the cardiovascular system. It describes both noninvasive and invasive methods of hemodynamic monitoring. Noninvasive methods include measuring vital signs like blood pressure and heart rate, while invasive methods involve placing catheters in the central circulation to directly measure pressures. Specific invasive monitoring techniques covered are arterial line placement, central venous pressure monitoring via a central line, and pulmonary artery catheterization to measure pressures and determine cardiac output. Normal ranges for various hemodynamic parameters are also provided.
This document discusses central venous pressure (CVP), including its indications, measurement sites, determinants, and limitations. Some key points:
- CVP is the pressure measured in central veins close to the heart and reflects right atrial pressure. It provides information about right ventricular preload but does not indicate blood volume.
- CVP can be measured through the internal jugular, femoral, or subclavian veins. Factors like cardiac function, vascular compliance, blood volume, and intrathoracic pressure determine CVP.
- While CVP provides data on circulatory equilibrium between the heart and veins, it does not predict fluid responsiveness or tissue perfusion. Dynamic variables obtained through fluid challenges or
This is a very simple presentation prepared for nurses. It will help nurses to understand the need of monitoring and the available methods. The presentation has been constructed on a clinical case base scenario and gradually different methods of monitoring has been introduced.
This document provides an overview of hemodynamic monitoring principles in the ICU. It discusses the steps for assessing global and regional perfusion, including initial clinical assessment and basic monitoring of vital signs and lactate levels. It then covers monitoring of preload and fluid responsiveness, methods for measuring cardiac output, assessing cardiac contractility and tissue perfusion. A variety of invasive and non-invasive monitoring techniques are explained, from pulmonary artery catheters and arterial waveform analysis to echocardiography, near-infrared spectroscopy and analysis of the microcirculation. Key principles emphasized are that no single monitor determines outcomes, and monitoring needs may change over time based on equipment and integrating multiple variables.
physiological monitoring of a surgical patient.pptxkiogakimathi
Physiological monitoring of surgical patients allows assessment of physiological reserve and response to treatment. It includes monitoring of vital signs like temperature, heart rate, blood pressure, respiratory rate, and oxygen saturation. Specific organ systems that are monitored include the cardiovascular, respiratory, nervous, renal, hematological, and hepatic systems. This is done through methods like ECG, arterial blood gas analysis, capnography, intracranial pressure monitoring, EEG, urinalysis, renal function tests, and liver function tests. Scoring systems like APACHE, MEWS, SOFA, and NEWS are also used to assess patient status. Close physiological monitoring is important for optimizing patient care and outcomes during surgery and recovery.
This document discusses monitoring of critically ill patients. It covers monitoring of the cardiovascular, respiratory, central nervous, renal, hepatic and hematological systems. Key points include:
- Continuous cardiac monitoring and 12-lead ECG are used to monitor the cardiovascular system. Parameters like heart rate, rhythm, blood pressure are observed.
- Respiratory monitoring includes pulse oximetry, arterial blood gases analysis, and ventilation monitoring to assess oxygenation, ventilation, and acid-base balance.
- Invasive hemodynamic monitoring like pulmonary artery pressure, central venous pressure and cardiac output help guide therapy in unstable patients.
The document summarizes key aspects of cardiac physiology, including:
- The functions of the heart in generating blood pressure, routing blood flow, ensuring one-way flow, and regulating blood supply.
- The cardiac cycle and its phases of isovolumic contraction, ejection, isovolumic relaxation, and diastole.
- Factors that affect cardiac output including venous return, heart rate, contractility, and peripheral resistance.
- Key reflexes that regulate cardiac function such as the baroreceptor, chemoreceptor, and Bezold-Jarisch reflexes.
This document provides an overview of cardiogenic shock, including its definition, pathophysiology, etiology, clinical presentation, diagnosis, and management. Cardiogenic shock is defined as inadequate tissue perfusion due to the heart's inability to pump an adequate amount of blood, despite adequate intravascular volume. It results from a severe reduction in cardiac output and stroke volume. The most common cause is severe left ventricular dysfunction following acute myocardial infarction, though right ventricular failure can also cause cardiogenic shock. Management involves general support measures, pharmacological therapy including inotropes and vasopressors, hemodynamic management, mechanical support such as IABP, and early reperfusion when possible. Early invasive management and avoidance of excessive fluids for right
This document provides an overview of cardiogenic shock, including its definition, pathophysiology, etiology, clinical presentation, diagnosis, and management. Cardiogenic shock is defined as inadequate tissue perfusion due to the heart's inability to pump an adequate amount of blood, despite adequate intravascular volume. It results from a severe reduction in cardiac output and stroke volume. The most common cause is severe left ventricular dysfunction following acute myocardial infarction, though right ventricular failure can also cause cardiogenic shock. Management involves general support measures, pharmacological therapy including inotropes and vasopressors, hemodynamic management, mechanical support such as IABP, and early reperfusion when possible. Early invasive management and treatment of mechanical complications can increase
Day 1 -RESERVE CONPENSATION FAILURE2wb.pptxMkindi Mkindi
There are nearly 100 viruses of the herpes group that infect many different animal species.
Official name of herpesviruses that commonly infect human is Humans herpesvirus (HHV)
herpes simplex virus types 1 (HHV 1)
Herpes simplex virus type 2 (HHV 2)
Varicella-zoster virus (HHV 3)
Epstein-Barr virus, (HHV 4)
Cytomegalovirus (HHV 5)
Human herpesvirus 6 (HHV 6)
Human herpesvirus 7 (HHV 7)
Human herpesvirus 8 (HHV 8) (Kaposi's sarcoma-associated herpesvirus).
Herpes B virus of monkeys can also infect humans
hELMINTHS#corona virus#Aspergillosis#BUGANDO#CUHAS#CUHAS#CUHAS#CELL MEMBRANE TRANSPORT#PHYSIOLOGY#BODY FLUIDS#RENAL PHYSIOLOGY#
BLOOD PRESSURE
BY: SAIYED FALAKAARA
ASSISTANT PROFESSOR
DEPARTMENT OF PHARMACY
SUMANDEEP VIDYAPEETH
Definition
Arterial blood pressure can be defined as the lateral pressure exerted by moving the column of blood on the walls of the arteries.
Significance
To ensure the blood flow to various organs
Plays an important role in exchange of nutrients and gases across the capillaries
Required to form urine
Required for the formation of lymph
Normal values
Normal adult range can fluctuate within a wide range and still be normal
Systolic/diastolic
100/60 – 140/80
Unit - mmHg
1) The document provides guidance on performing a physical examination for cardiac patients, including assessment of general appearance, vital signs, neck veins, precordial examination, and auscultation of heart sounds.
2) Key assessments include blood pressure, pulse, respiratory rate, jugular venous pressure, point of maximal impulse, thrills, and the first and second heart sounds.
3) Findings are compared to normal values and associated with various cardiac conditions to help evaluate patients.
The document discusses hypertension and the heart. It provides details on:
1) The structure and layers of the heart, including the myocardium and pericardium.
2) The path of blood through the heart, from the vena cava and atria to the ventricles, arteries and lungs before returning to the left atria and ventricle.
3) Hypertension, also known as high blood pressure, which increases risks of health problems if not controlled. It can be essential/primary or secondary to other conditions.
Hypertension and its pathophysiology.pptxImtiyaz60
The document discusses hypertension and the heart. It provides details on:
- The structure and layers of the heart, including the myocardium and pericardium.
- The path of blood through the heart, from the vena cava and atria to the ventricles, valves, and out the aorta to the body.
- Additional details are given on heart size, location in the thoracic cavity, and the double-walled pericardium surrounding and protecting the heart.
This document summarizes key concepts in cardiovascular physiology including:
1. Determinants of cardiac output which are stroke volume and heart rate. Stroke volume is determined by preload, afterload, and contractility as described by Frank-Starling law of the heart.
2. Control of arterial blood pressure involves immediate control by baroreceptors and chemoreceptors, intermediate control by the renin-angiotensin-aldosterone system and atrial natriuretic peptide, and long-term control through sodium and water retention in the kidneys.
3. Coronary physiology includes characteristics of coronary blood flow such as intermittent flow, autoregulation to maintain flow, and metabolic and
Similar to Advanced+Haemodynamic+Monitoring+and+support+-+part+1+vs+1+0.pptx (20)
3. Contents
1. Introduction 6. Monitoring Perfusion – Gastric Tonometry
2. What is haemodynamic monitoring? 7. Monitoring Oxygen Consumption – Mixed
3. Advanced haemodynamic monitoring Venous Saturation
4. Central Venous Pressure Monitoring 8. Summary
5. Cardiac Output Measurement
a) Introduction
b) Derived parameters from cardiac output
c) Cardiac Output using CO2
d) Cardiac output using dilution technique
e) Pulmonary Artery Catheters
f) Transpulmonary Thermodilution
g) Lithium dilution
h) Stroke Volume / Pulse Pressure Variation
i) Oesophageal Doppler
j) Echocardiography
k) Thoracic bioimpedance
l) Indications for monitoring cardiac output
m) Clinical applications
n) Evidence to support cardiac output
monitoring
4. Introduction
• Monitoring is one of the fundamental aspects of intensive care
• We monitor several physiological parameters regularly:
– ECG, heart rate, SpO2, arterial blood pressure in real time
– Other parameters such as temperature, urine output, respiration rate, GCS
and blood sugars are monitored at frequent, but regular intervals
• We monitor these parameters:
– To alert us of deterioration or potential deterioration of patient’s state
– To intervene when there are signs pointing to a deterioration
– To assess response to treatment
‘Not everything that counts can be counted and not everything that
can be counted counts’ . . . Albert Einstein
5. What is haemodynamic monitoring?
• Haemodynamic monitoring focuses on the circulatory system, its adequacy
and end organ perfusion
• Markers such as blood pressure and heart rate give an indirect measure of the
circulatory system
• Tachycardia and hypotension may thus indicate either a decreased preload or
impaired myocardial contractility
• They are not accurate:
– The heart rate is influenced by many other factors
– Tachycardia may be the result of pain, anxiety, drugs or arrhythmias and
not necessarily a reduced preload or decreased cardiac output
– Similarly, a low blood pressure may be secondary to drugs, postural
effects or vasodilatation
– A ‘normal’ blood pressure in a hypertensive patient may actually indicate a
shocked state!
6. What is haemodynamic monitoring?
• Surrogate markers of organ perfusion include:
– Skin perfusion - measured by capillary refill
– Urine output
– Mental state – usually assessed by the GCS
• These may do not accurately measure perfusion:
– Capillary refill may be affected by other factors including ambient
temperature
– Urine output may be vary in the setting of previous renal dysfunction
– Mental alertness may not be assessable in the intubated patient;
delirium may contribute to a decreased GCS
• Other indirect markers of perfusion including serum lactate are not exclusive
to poor perfusion and are elevated in other medical conditions as well
7. Advanced haemodynamic monitoring
• The ‘regular’ monitoring of the haemodynamic status provides sufficient
information in most situations
• There are situations where this may not sufficient to make decisions
• Advanced haemodynamic monitoring involves monitoring the circulatory
system and the components that affect it :
– Preload
– Myocardial contractility
– Afterload
• It also involves monitoring oxygen consumption and end organ perfusion
9. Central Venous Pressure
• The pressure measured in the superior and inferior venacava
• Reflects right atrial pressure
• Usually measured through a catheter inserted into the internal jugular or
subclavian veins as well as through peripherally inserted central venous
catheters
• The pressure in the femoral veins also reflects central venous pressure,
although increased abdominal pressure may modify this sufficiently to render
it inaccurate
• The right atrial pressure may be directly measured using the pulmonary artery
catheter (see section on PA catheters)
• CVP pressure monitoring is common - catheters in the central veins are
inserted frequently for administration of vasoactive agents or hypertonic
solutions and for long-term venous access
10. History
• First described in patients undergoing thoracic surgery
• Hughes and Magovern1 described a fall in CVP with blood loss and a rise in
CVP with transfusion in 1959
• CVP was initially used as a guide for fluid resuscitation and monitoring in
cardiac and thoracic surgery and later on was used in major operative
procedures
• This practice then spilled over to the Intensive Care Units and now forms a
common modality of haemodynamic monitoring in critically ill patients
1. Hughes RE, Magovern GJ. The Relationship Between Right Atrial Pressure and Blood Volume. Arch Surg. 1959;79: 238-243.
11. Central Venous Pressure
• Used as a surrogate marker for cardiac filling pressures - rise in CVP
indicates better cardiac filling
• Frank- Starling principle states that the force of cardiac contraction is
proportional to the end-diastolic length of the fibre
• This muscle length is proportional to the volume of blood at the end of
diastole: the preload
• Thus, preload is one of the determinants of cardiac output
• Increased preload results in proportionately increased stroke volume
• In clinical practice, it is not possible to measure the end diastolic volume of
the right ventricle to determine the preload
• End diastolic right ventricular pressure is reflected in the CVP which is
therefore used as a surrogate marker of preload
12. Central Venous Pressure
• The relationship between ventricular
end diastolic volume and pressure is
not linear but curvilinear (see figure)
Decreased
• When the ventricle is operating in the compliance
flat portion of the curve, there is little
Left ventricular pressure
change in pressure with end diastolic
volume Normal
End diastolic pressure
• In the steep area of the curve, small
changes of volume results in greater
changes in pressure End diastolic pressure
• Decreased ventricular compliance Increased
compliance
End diastolic pressure
causes greater pressure changes with
volume Left ventricular volume
• Ventricular compliance is influenced
by relaxation, geometry and the
mechanical characteristics of the
ventricle
13. Factors affecting CVP
• Normal CVP in a healthy adult: 0 -7 mm Hg
• CVP of 0 may be normal in a healthy person - central veins are capacitance veins,
potentially able to hold large volumes of blood without appreciable changes in pressure
• Higher CVP may reflect poor ventricular compliance than good filling pressures
• Changes in the transmural pressure - difference in the pressure between the cardiac
chamber and the juxtacardiac pressure – also affects CVP
• Juxtacardiac pressure is affected by pericardial and pleural pressures
• In a ventilated patient, pleural pressures are affected by the compliance of the lung,
pressures exerted by the ventilator, and PEEP
• These pressure changes are complex and do not affect the CVP in a linear fashion. The
practice of subtracting PEEP pressure to the CVP may not always reflect actual CVP
• Pressures in the right atria may also be affected by changes in the ventricles or the atria:
– Valvular abnormalities of the tricuspid and rarely, the pulmonary valves
– Pulmonary hypertension
14. Factors affecting CVP…
• The pressures are affected by changes in the respiratory cycle:
– Decreased intra-thoracic pressure at the beginning of spontaneous
ventilation decreases the CVP
– The onset of positive pressure ventilation causes an increase in CVP
• The CVP is usually measured at the end of expiration when
juxtacardiac pressures approach atmospheric pressure
• Technical issues may also affect the actual CVP measurement,
including:
– Improper position of the catheter – abutment against a vessel wall
– Thrombus in the catheter
– Improper zeroing or placement of the transducer
– Simultaneous rapid Infusion of fluids1 (rates > 50 ml/hour tends to
increase the CVP)
1. Ho AM-H, Dion PW, Karmakar MK and Jenkins CR. Accuracy of central venous pressure monitoring during simultaneous continuous
infusion through the same catheter. Anaesthesia, 2005; 60: 1027–1030
15. CVP waveform
• Waveform has a characteristic trace
coinciding with changes in the cardiac cycle:
– Prominent positive a wave - atrial
contraction
– Smaller, positive c wave – closure of
tricuspid valve during isovolumetric
contraction
• Atrial relaxation decreases in atrial pressure
(x descent)
• Filling of the atrium causes pressures to rise
again (v wave)
• This is followed by the y descent, a negative
waveform reflecting ventricular filling as the
tricuspid valve opens
16. Monitoring with CVP
• Used both in resuscitation and as a guide to fluid therapy
• Low CVP in a haemodynamically unstable patient reflects decreased preload
and may be an indication for additional fluids
• Its use to guide fluid resuscitation is recommended and in several guidelines
including management of septic shock
• Evidence to support this is however not convincing
• In a systematic review, Marik1 found no correlation between CVP and blood
volume
• This review also found that CVP, or a change in CVP did not predict fluid
responsiveness
• The CVP should not be used in isolation and the pressure measured is a
composite of a number of factors affecting the right atrial pressure
• Trends in the change in the CVP and using the CVP in conjunction with other
haemodynamic parameters helps overcome some of these barriers
1. Marik PE, Baram B, Vahid B. Does Central Venous Pressure Predict Fluid Responsiveness? Chest, 2008; 134: 172 - 178
18. Introduction
• Assessment of cardiac output is an important part of monitoring
haemodynamically unstable patients
• Until recently, the measurement of cardiac output was considered essential:
– To characterize the type of shock
– To monitor response to therapeutic interventions
– To optimise factors that influence cardiac output
– To optimise oxygen delivery
26. Cardiac output measurement using CO2
• The potential benefits using this technique include its non-invasive nature and its ability to be
repeated at relatively frequent intervals
• It can be only done in intubated and ventilated patients; large gas leaks in non-invasive
ventilation preclude its use
• It has not shown consistent correlation with other techniques of measurement of CO
• Its measurement is unreliable in several clinical situations:
– Large intra pulmonary shunts
– Where tidal volumes vary (spontaneously breathing patient) or when ventilator settings
may alter dead space
– Chronic lung disease, where ventilator- perfusion mismatch can occur
– The postoperative cardiac patient where increased pulmonary dead space and shunts
may occur
– Acute lung injury (ALI) and ARDS where the heterogeneous nature of the injury causes
a wide variation of gas exchange. End tidal CO2 may be a poor estimate of CaCO2
30. Cardiac output with thermodilution
• Major advantages of using the thermodilution technique include:
– Non-toxic and can be repeated
– Repeated measurements, performed correctly, show very low coefficients of variance
– There is no recirculation
– Shows good agreement with other indicator dilution methods including indocyanine
green
– Has now become the ‘gold standard’ for clinical measurement of cardiac output
• The values obtained using thermodilution have some limitations:
– Requires placement of a pulmonary artery catheter
– Inaccurate in low-output states, tricuspid regurgitation, atrial and ventricular septal
defects
– There must be a variation of ~15% between the means of 2 measurements to interpret
changes as significant
– Cold saline may cause bradycardia, decreasing cardiac output. This limitation may be
overcome by using saline at room temperature, compromising on precision.
Measurements using this may vary if the patient is hypothermic
32. History
• Bradley, along with Branthwaite, described pulmonary artery catheterisation,
using a rigid thermistor tipped catheter placed under fluoroscopy in the
pulmonary artery with a second catheter for injection in the right atrium1.
Cardiac output was measured by thermodilution
• Jeremy Swan conceived and developed
a balloon tipped catheter that could be
floated into the pulmonary artery. William
Ganz added a thermistor to the tip to the
device, enabling measurement of cardiac
output thermodilution Jeremy Swan and William Ganz
• Advances in technology have kept pace with the development of the
catheter with addition of more lumens and the use of better materials
• There are now dedicated monitors available with software to calculate a
broad range of haemodynamic parameters
• Incorporation of a heating element proximally has eliminated the need for
injecting cold solutions
1. Chatterjee K. The Swan-Ganz Catheters: Past, Present, and Future. Circulation. 2009;119:147-152
33. Principles
• The pulmonary artery (PA) catheter allows measurement of the pulmonary
pressures - systolic, diastolic and wedged
• Enables measurement of cardiac output using the thermodilution method
• Allows measurement of mixed venous oxygen saturation, from which
oxygen consumption can be calculated
• Together, these haemodynamic parameters provide a better understanding
of preload, myocardial contractility and afterload
• Information from these parameters may be used to guide fluid and
vasoactive medication therapy
34. Principles
• The balloon at the end of the PA catheter is
inflated to wedge the catheter in the pulmonary
artery and isolate it from upstream pressures Pulmonary
artery
• The pressure measured at the tip of the catheter
reflects the pressure of a distal static column of
blood which ends at the junction of the pulmonary
vein with the left atrium
• As the resistance of the pulmonary venous RV LV
system is negligible, this pressure reflects
pulmonary venous and left atrial pressure – a
measure of the left ventricular filling pressure
• Sometimes the pulmonary artery diastolic
pressure is used as a measure of left atrial Pulmonary
artery
pressure instead of the wedged pressure wedged
• This is acceptable in normal circumstances
because at the end of diastole, the pulmonary
artery pressure equilibrates with the downstream
capillary and venous pressures RV LV
36. Normal waveforms
• The pressure waveforms in the wedged position resembles a damped CVP
waveform with ‘a’, ‘c’ and ‘v’ waves along with an ‘x’ and ‘y’ descents
• When the catheter is not wedged, it displays the pulmonary artery waveform
• There is a phase delay in the waveform compared to the ECG trace
• the peak of the a wave follows the P wave of the ECG by about 240
milliseconds; the v wave follows the T wave of the ECG; the v wave is larger
than the a wave
Right atrium Right ventricle Pulmonary artery wedged
20
pressure
v
a
10
a v
37. Normal Values
Right atrial pressure 2 – 6 mm Hg
Right ventricular systolic pressure 15 – 25 mm Hg
Right ventricular diastolic pressure 0 – 8 mm Hg
Pulmonary artery systolic pressure 15 – 25 mm Hg
Pulmonary artery diastolic pressure 8 – 15 mm Hg
10-20 mm Hg
Pulmonary artery wedged pressure 6 – 12 mm Hg
38. Inaccuracies with thermodilution
• Catheter malposition:
Normal curve
– Thermistor wedged against a vessel wall
– Coiling of the catheter - thermistor close to the injectate port
• Injection/ technique:
Uneven injection
– Incorrect recording of injectate temperature
– Slow injection - underestimates cardiac output (see figure)
– Large volume – underestimates; small volume over estimates
cardiac output
Uneven injection
• Cardiac:
– Cardiac dysrhythmias
– Extremes of cardiac output Prolonged
injection time
• Others:
– Abnormal respiratory patterns – respirations cause
fluctuations in cardiac output
Artefacts in thermodilution
– Rapid infusion of IV fluids at the same time caused by improper injection
– Abnormal haematocrit – will affect K value
39. Semicontinuous thermodilution cardiac output
• Thermodilution technique requires a injection of cold saline every time one needs
to measure cardiac output
• Limits its use as a continuous monitoring tool – particularly in conditions where
haemodynamic changes can potentially occur rapidly
• One way to overcome this challenge is to use heat instead of cold as an indicator
• Achieved by using a heating filament on the proximal portion of the catheter with
a thermistor distally to measure temperature
• Heating filament generates low power pulses of heat; decay of heat is measured
by the thermistor and cardiac output computed
• Shows good correlation with the Fick and thermodilution techniques
• Potential disadvantages include:
– Inaccuracy when cold fluid is boloused through the same line
– Incompatibility with Magnetic Resonance Imaging
– Interference from electro-diathermy
– Inability to detect sudden changes in cardiac output
41. Cardiac Output : Transpulmonary thermodilution
• Transpulmonary thermodilution technique is a variation of the traditional
thermodilution technique
• Does not require a pulmonary artery catheter - a central venous catheter
and an arterial line, preferably placed in the femoral vein is required
• Allows calculation of additional parameters: intra thoracic blood volume,
global end diastolic volume and extra vascular lung water that may be
help in the management of complex haemodynamic states
• Commercially available packages also uses the arterial pulse waveform
(pulse contour analysis), referenced to the thermodilution curve, to give a
beat by beat analysis of cardiac output
• This allows calculation of additional parameters such as pulse pressure
variation and stroke volume variation that can aid in determining fluid
status
42. Transpulmonary thermodilution - principles
• Following central venous injection, cold saline / dye passes through the right
heart, the lung, the left heart and the aorta as far as the detection site
• The individual cardiac chambers and the lung, with the extravascular lung water,
are the mixing chambers for the cold bolus
• When a dye bound to albumin is used, it will mix only within the heart chambers
and pulmonary circulation
Extra vascular lung water
Injection of cold saline
into a central vein
Left heart
Pulmonary
blood LA
RA RV volume
LV
Right heart
lungs
Temperature changes
recorded from a peripheral
artery
43. Transpulmonary dilution - principles
• If a cold injectate is used, the chambers of the heart and the lung become
the mixing chamber. The volume of this mixing chamber is the intrathoracic
thermal volume (ITTV)
• The lungs, along with the extravascular lung water (EVLW) is the largest
mixing chamber and its the volume is the pulmonary thermal volume (PTV)
Pulmonary
RA RV blood LA LV
volume
Intrathoracic thermal volume
Pulmonary thermal volume
44. Transpulmonary dilution - principles
• Indicators bound to albumin (like indocyanine green) do not leave the
circulation
• It mixes within the chambers of the heart and the pulmonary circulation
• The volume within the chambers of the heart and the pulmonary
circulation is the intrathoracic blood volume (ITBV)
• The volume of blood within the lung is the pulmonary blood volume
(PBV)
Pulmonary
RA RV blood LA LV
volume
Intrathoracic blood volume
Pulmonary blood volume
45. Measurement of cardiac output
• Cold saline / dye is injected into a central vein and the change in temperature or
concentration of dye is measured distally in an artery
• Cardiac output is calculated applying the Stewart – Hamilton formula
• Mean transit time (MTt) is the mean time taken for the indicator to be detected
• It is measured as the period between the start of the injection, and the point
where the decay in the curve has dropped to 75% of its maximum
• Down slope time (DSt) represents the mixing behaviour of the indicator within the
pulmonary circulation - the largest mixing chamber
• It is measured as the time taken for the curve to drop from 75% to 25% of its
maximum
Downslope time
Mean transit time
Time - seconds
injection
47. Cardiac output using double indicators
• A second indicator bound to albumin, usually a dye such indocyanine green, in
addition cold saline can be also used to to obtain a cardiac output
• This indicator remains confined to the intravascular compartment
• Using the MTt for both indicators, ITBV and ITTV can be computed:
ITBV = MTtdye x cardiac output
ITTV = MTtthermal x cardiac output
Extravascular lung water (EVLW) = ITTV - ITBV
• EVLW represents the interstitial mixing compartment and has been shown to
correlate with severity of illness1. It may be used as a guide to reduce positive
fluid balance
Downslope time
Mean transit time
1. Sakka SG, Klein M, Reinhart K, Meier-Hellmann A.
Prognostic value of extravascular lung water in critically ill
patients. Chest. 2002; 122: 2080- 2086.
injection Time - seconds
48. Single indicator technique
• The single indicator technique retains the same approach but uses only cold
saline as the indicator
• The advantage is convenience and decreased costs
• It allows calculation of the same parameters as the double indicator
technique and correlates well with both the double indicator technique and
thermodilution technique
• It also allows referencing cardiac output to the pulse waveform, and using
proprietary algorithms, to provide a continuous cardiac output using pulse
contour analysis
49. Cardiac output – derived values
• Subtracting PTV from ITTV gives the volume of the four chambers of the
heart: the global end diastolic volume (GEDV):
GEDV = ITTV - PTV
• ITBV has been demonstrated to have a linear relationship with GEDV1:
ITBV = (GEDV x 1.25) – 28.4 ml
• Extravascular lung water can be calculated by subtracting ITTV from ITBV
EVLW = ITTV - ITBV
• Both GEDV and ITBV are indicators of preload. Being volumetric measurements,
they are better than pressure based measurements
• They do not differentiate between right and left cardiac volumes and can be
unreliable in right heart failure
Pulmonary
RA RV blood LA LV
1. Genahr A, McLuckie A. Transpulmonary volume
thermodilution in the critically ill. British J Intensive
Care 2004: 6 - 10
50. Lithium dilution
• Lithium is used as the indicator: cardiac output is measured using
the transpulmonary technique
• Lithium is non toxic in small doses and is measured using an ion
sensitive electrode
• Shows good agreement with thermodilution techniques
• Advantages of using this technique:
– Lithium can be injected peripherally
– Blood can be sampled from a peripherally placed arterial line
• Limitations include:
– Inability to use it in patients on Lithium therapy
– The need to sample blood and its disposal
52. Principles
• Both techniques rely on the principle that raised intrathoracic pressures in the
inspiratory cycle of mechanical ventilators decreases venous return and
therefore, cardiac output
• This decrease is determined by calculating cardiac output (area under the arterial
waveform in systole) during inspiration (decreases) and expiration (SVV)
• The calculated cardiac output is usually Maximum pulse pressure
referenced to a previous measurement of Minimum pulse pressure
cardiac output using a transpulmonary
dilution technique
• The Flo trac™ system developed by
Edwards Life Sciences uses a proprietary inspiration expiration
algorithm to calculate cardiac output using
pulse waveform analysis without the need
for calibration
• The difference between pulse pressures
(PPV) or the systolic pressures (SPV) is
Stroke volume max
also used as a surrogate marker, obviating Stroke volume min
the need for cardiac output measurement
53. Application
• Pulse pressure variation and stroke volume variation is calculated as the
difference between the maximum and minimum systolic pressure / stroke
volume during the inspiratory cycle
• The variation is usually expressed as a percentage of the mean pulse
pressure/ stroke volume
• Larger variations have been shown to correlate with fluid responsiveness,
indicating that the heart is operating on the steep side of the Frank-Starling
curve
• In a meta-analysis1, variations between over 11 % appeared to correlate
well with fluid responsiveness in mechanically ventilated patients
• Robust data on spontaneously breathing patients is awaited
1. Marik PE, Cavallazzi R, VasuT , Hirani A. Dynamic changes in arterial waveform derived variables and fluid responsiveness
in mechanically ventilated patients: A systematic review of the literature. Crit Care Med 2009; 37: 2642 - 2647
55. Oesophageal Doppler
oesophagus aorta
Doppler probe
ft = transmitted frequency
c = velocity of sound in tissue (1540 m/s)
f transmitted
cos θ = incident angle between the ultrasound beam and blood flow
direction (if the probe is parallel to the aorta, θ = 0 and cos θ = 1)
f received
Δf = ft - fr
56. Oesophageal Doppler
• Multiplying the flow velocity by the cross-sectional area of the aorta and the
ejection time gives an estimate of the stroke volume
• Depending on the equipment used, the cross-sectional area of the aorta is
estimated either from a normogram based on patient height, weight and age or,
from direct estimates using the ultrasound
• A correctional factor is applied to account for that proportion of stroke volume
distributed to the coronary, carotid and subclavian arteries
• Cardiac output is calculated by multiplying the stroke volume with the heart rate
• In addition to cardiac output, the system also gives information about the
preload and contractility of the heart by analysing the waveform
57. Oesophageal Doppler – waveform analysis
• Waveform of velocity against time is shown below
• The base of the triangle represents the systolic ejection time, also called the flow
time. Because this is dependent on the heart rate, it is corrected using a
modification of Bazett’s equation for correction of QT interval in the ECG
• The corrected flow time (FTc) is the systolic ejection time corrected to one
cardiac cycle per second
• The area under the curve (shaded orange) is the stroke distance: the distance
the column of blood has moved forward in the aorta during systole
• Multiplying the stroke distance with the cross-sectional area of the aorta (direct
measurement or normogram) gives the stroke volume. A correction is applied to
account for blood flow to the branches of the aortic arch and coronaries
velocity
peak velocity
AUC =
Stroke
distance
flow time Time
58. Oesophageal Doppler – waveform analysis
• In addition to measuring stroke volume and cardiac output, analysis of the
Doppler waveform gives information about preload and contractility
• FTc and peak velocity are the parameters used to indicate preload
• A shortened FTc with a normal or moderately reduced peak velocity (waveform
with narrow base and near normal amplitude) is seen in hypovolemic states
• A shortened FTc with a markedly reduced peak velocity (waveform with a
narrow base and decreased amplitude) reflects increased afterload
• Reduced amplitude with a more shallow slope and rounded apex is seen with
left ventricular failure
• Peak velocity and mean acceleration reflect contractility
velocity
peak velocity
AUC =
Stroke
distance
flow time Time
59. Oesophageal Doppler – waveform analysis
SV=47 PV=63 SV=64 PV=63.5
• The waveform is also used
to see response to therapy
such as fluid boluses or
inotropes – see figure
Hypovolemia - ↓ FTc, stroke Response to fluids
• While this does look volume, normal peak velocity
promising, there are limited
number of studies1 that have SV=42 PV=42 FTc= 232 SV=72 PV=65 FTc= 345
validated oesophageal
Doppler as a monitoring tool
• Most of the studies have
Increased afterload - ↓ SV, Response to vasodilators
been done in a peri- PV and FTc
operative setting and its
applicability to a general ICU SV=42 PV=45.5 SV=59 PV=63
setting is not clear
1. Ospina-Tascón GA, Cordioli RL Vincent J-L. What type of
monitoring has been shown to improve outcomes in acutely ill Left ventricular failure - ↓
Response to inotropes
patients? Intensive Care Med. 2008; 34: 800–820 SV, PV and normal FTc
60. Oesophageal Doppler - limitations
• The measurements assume that flow in the aorta is laminar. This may not
always be the case and the values may not be accurate in:
– Coarction of aorta or aortic stenosis
– Aneurysms or dissection
– When balloon pump counter pulsation is used
• Deviations from the assumed angle of insonation (θ, the angle at which the
Doppler signals are sent) will result in erroneous velocity values
• The cross sectional area of the aorta is assumed to be a perfect circle. This
may not be true, especially if there are aortic plaques or compliance is poor
• Estimation of cardiac output assumes that a fixed proportion of blood goes
to the coronaries and the branches of the aortic arch. This may not always
be true. Shock states result in redistribution of cardiac output
61. Echocardiography
• Provides accurate assessment of stroke volume and chamber pressures
• Also enables estimation of myocardial function / dysfunction including
diastolic dysfunction
• Severity of valvular dysfunction can be assessed
• Disadvantages:
– Requires trained personnel
– Equipment costs
– Operator dependent
– Body habitus, ventilation and position of the patient may preclude obtaining
good images
– Examination takes considerable time; real time imaging is not possible – can be
overcome to a certain extent by limiting assessment to fixed protocols
62. Thoracic bioimpedance
• Measures thoracic impedance to a high frequency, low magnitude current applied
between electrodes in the neck and thorax
• Bioimpedance of the thorax is influenced by
the amount of fluid in the thorax
• Fluid in the thorax (mainly blood in the
venacavae and aorta) changes with cardiac
cycle – causing changes in bioimpedance
Thoracic
• Bioimpedance is inversely proportional to High frequency
low magnitude
Bioimpedance
and ECG
the amount of fluid in the thorax current
sensing
• Stroke volume and cardiac output is
computed after filtering electric noise
caused by other fluid movement
• Results using thoracic bioimpedance have been mixed - some studies have shown
good correlation with invasive methods currently used, others have not
• Acute lung injury, pleural effusions, pneumonia and obesity interfere with
bioimpedance and result in inaccurate measurements
63. Indications for monitoring cardiac output
Diagnostic Therapeutic
• Differential diagnosis of shock • Guide therapy in shock
– Cardiogenic – Fluid management
– Septic – Vasopressor / inotropes
– Hypovolemic • Guide therapy peri-operatively
• Evaluation of pulmonary oedema • Guide therapy in cardiac failure
– Cardiogenic from non cardiogenic
• Ventilator management
• Evaluation of cardiac failure
• Multi - organ failure
– Tamponade
• Evaluation of cardiac structures
– Valvular disease and intracardiac
shunts
• Others
– Shock in acute myocardial infarction
– Pulmonary hypertension
64. Clinical applications
• Assessment of fluid status:
– CVP/ Right atrial pressure – non specific, low pressures may be due to venous
dilatation; high pressures may be reflective of pulmonary/ intra cardiac pathology
– Right ventricular end diastolic volume – estimated by echo and thermodilution – more
accurate measurement of preload
– Global end diastolic volume – transpulmonary thermodilution
– Decreased peak velocity and FTc on oesophageal Doppler
– Increased pulse pressure / stroke volume variation in mechanically ventilated patients
• Assessment of contractility:
– Direct measurement of ejection fraction, systolic and diastolic function on echo
– cardiac output / index; stroke volume / index using thermodilution, transpulmonary
dilution or Doppler
– Left or right ventricular stroke work index
• Assessment of afterload:
– Systemic vascular resistance / index
65. Evidence to support cardiac output monitoring
• Most of the evidence comes from the use of PA catheters
• Several reports published1 - suggesting harm from the use of PA catheters
• More recent randomized control studies and several meta analyses2 have
not shown harm from their use
• These studies also failed to show a proven benefit (mortality or length of
ICU/ hospital stay) of using PA catheters compared with standard care3
• Paucity of studies on the efficacy of other forms of cardiac output
monitoring; however they are likely to reflect data from PA catheters
• Routine use of cardiac output monitoring may not be beneficial
• There may be may be some conditions where it may provide additional data
aiding in diagnosis and therapy
1. Connors AF, Speroff T, Dawson NV, Thomas CT, Harrell FE, Wagner D et al.The Effectiveness of Right Heart Catheterization in the Initial
Care of Critically III Patients. JAMA. 1996; 276: 889-897
2. Shah MR, Hasselblad V, Stevenson LW, Binanay C, O’Connor CM, Sopko G et al. Impact of the Pulmonary Artery Catheter in Critically Ill
Patients. JAMA. 2005; 294: 1664-1670
3. Harvey S, Young D, BramptonW, Cooper A,Doig GS, SibbaldW, Rowan K. Pulmonary artery catheters for adult patients in intensive care.
Cochrane Database of Systematic Reviews 2006, Issue 3.
67. Introduction
• The goal of haemodynamic monitoring and support - ensure organs are
adequately perfused
• Assessment of the mental state and urine output are important clinical
markers of organ perfusion in the brain and kidney
• Often, these organs become involved in the disease process or cannot be
assessed because of sedation / existing disease
• Gastric tonometry is one technique used to assess regional perfusion
68. Gastric tonometry
• Assesses splanchnic perfusion based on stomach’s mucosal pH by measuring
gastric luminal PCO2 using a fluid filled balloon permeable to gases
• The balloon is attached to a nasogastric tube and allowed to equilibrate with
the luminal carbon dioxide. Luminal CO2 reflects intramucosal CO2
• PCO2 is measured along with a simultaneous arterial blood gas and the luminal
pH is calculated
• Several limitations to using gastric tonometry routinely:
– takes about 90 minutes for CO2 to equilibrate between the balloon and the lumen
– Luminal CO2 may be affected by acid secretion (or lack of it if the patient is on acid
suppressing agents) and feeding
– No convincing evidence1 to support its routine use in the intensive care as several trials
have failed to show benefit in using this form of monitoring
1. Holley A, Lukin W, Paratz J, Hawkins T, Boots R Lipman J. Review article: Part two: Goal-directed resuscitation – Which goals?
Perfusion targets. Emergency Medicine Australasia (2012) 24, 127–135
70. Mixed venous saturation
• Oxygen content of venous blood (CvO2) in the pulmonary artery (mixed venous
blood) is used to estimate oxygen consumption (VO2), using the Fick equation
• Indicative of the global metabolic requirements of the body
• Relationship between oxygen delivery (DO2) and VO2 is linear – DO2 increases to
keep up VO2 - up to a point (critical DO2). Beyond this, consumption exceeds
supply, forces cells to revert to anaerobic metabolism
• The point at which critical DO2 occurs is not the same for all organs; it also
changes with disease states like sepsis
• Low CvO2 reflects inadequate DO2 or increased consumption with greater oxygen
extraction
• Saturation of mixed venous blood (SvO2) can be used instead of CvO2
• The normal SvO2 is > 75%
• The central venous saturation (ScvO2) of the superior venacava is used instead of
SvO2 ; there is some evidence that changes parallel that of SvO2
• SvO2 is usually lower than ScvO2 by 2-5 %; this can reverse in shocked states
71. Clinical utility
• ScvO2 is one of the clinical monitoring tools used to guide fluid resuscitation
as part of the bundle in ‘early goal-directed therapy’ of septic shock1, 2
• A ScvO2 < 70 % was used as a trigger to increase DO2 by increasing
cardiac output or increasing haemoglobin once fluid resuscitation resulted in
a target CVP of 8 -12
• Using this bundle, Rivers demonstrated a decrease in mortality; we await
results of more recent studies
• Several studies have used SvO2 monitoring in the perioperative setting3.
Most of the studies involving vascular patients do not demonstrate a
mortality benefit or reduced length of ICU / hospital stay though there is
some evidence to support its use in cardiac surgery
1. Holley A, Lukin W, Paratz J, Hawkins T, Boots R, Lipman J. Review article: Part one: Goal-directed resuscitation – Which
goals? Haemodynamic targets. Emergency Medicine Australasia (2012) 24, 14–22
2. Rhodes A, Bennett DE. Early goal-directed therapy: An evidence-based review. Crit Care Med 2004; 32: S448 -450
3. Shepherd SJ, Pearse R. Role of Central and Mixed Venous Oxygen Saturation Measurement in Perioperative Care.
Anesthesiology 2009; 111: 649 - 656
72. Summary
• Advanced haemodynamic monitoring is useful in critically ill patients with
haemodynamic instability
• It provides more information about the circulatory state of the patient
including
– Preload
– Myocardial contractility
– Afterload
– Perfusion and oxygen consumption
• Cardiac output monitoring provides information about all these parameters
• There are several modalities of monitoring to choose from
• Decisions on which modality is best depends on the clinical situation,
available resources and institutional preference
• There is no clear evidence that cardiac output monitoring improves outcomes
– but information from it can be used in clinical decision making
• Mixed venous saturation is useful to monitor oxygen consumption and is one
of the parameters used to titrate therapy in septic shock