Downloaded 102 times

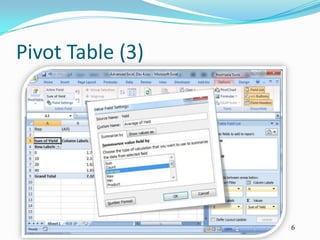
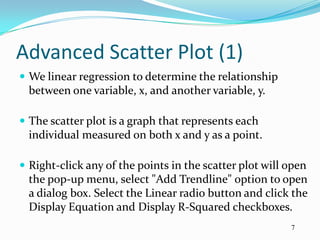
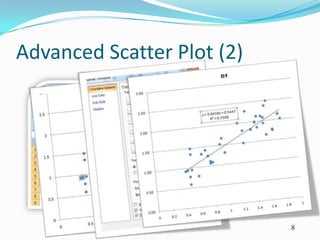
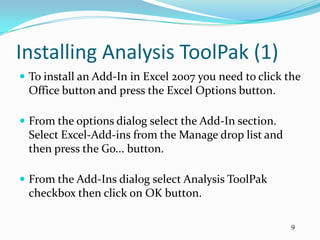
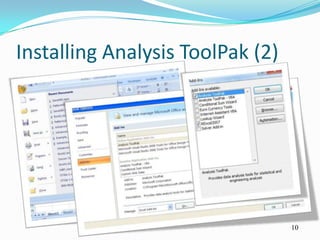
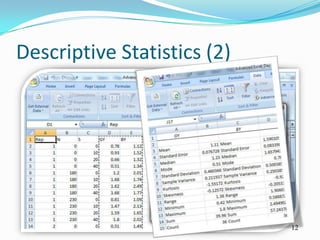
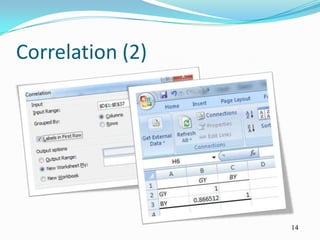
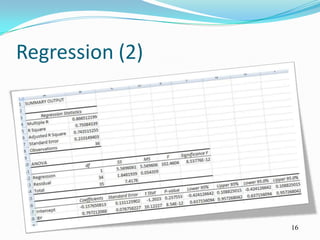


This document contains summaries of various Excel data analysis techniques including: text to columns to separate cell content into different columns based on delimiters; pivot tables to analyze data from different perspectives; scatter plots and linear regression to determine relationships between variables; installing the Analysis ToolPak add-in; descriptive statistics like measures of central tendency, variance, skewness, and kurtosis; correlation to examine relationships between variables; and regression to make predictions by modeling relationships between independent and dependent variables with lines and equations.